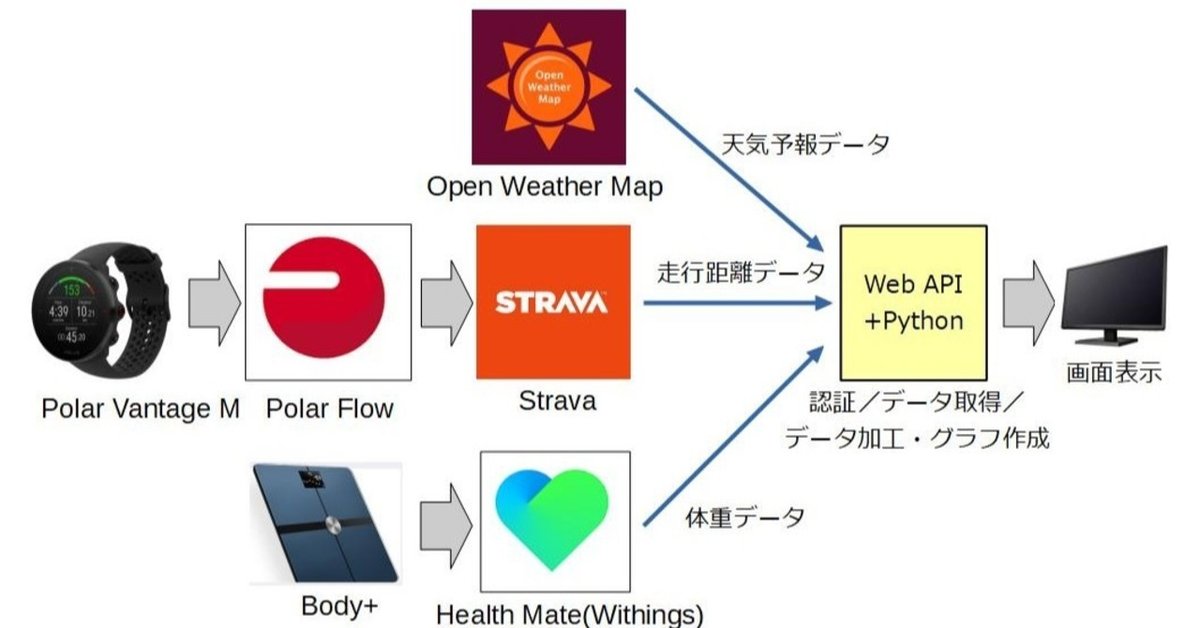
Strava/Withings Web API開発 - 開発編③(Withings)
WithingsはStravaほど情報は出回っていませんでしたが、Web API開発の考え方は似通っているので、Stravaで開発した後はそれほど苦労しませんでした。
(参考)Withings API developer documentation (v1.0)(公式)
(参考)body+で計った体重をWithings APIで取得する
概要
データ取得(Withings)
・RefreshTokenを実行し、新しいAccessTokenを取得
・AccessTokenを使用してリクエストを実行(Withings APIへResuests)し、取得したJSONデータを辞書型で格納
(設定パラメーター)
data={
'meastype': '1,6', ##meastype 1:体重、6:体脂肪率
'category': '1',
'startdate': '1546300800', ##2019/1/1
'enddate': '1735657200', ##2025/1/1
}
meastypeで指定可能なパラメーターは以下の通り。複数指定すると何故か全項目取れてしまいました。(謎)
https://developer.withings.com/oauth2/#tag/measure%2Fpaths%2Fhttps%3A~1~1wbsapi.withings.net~1measure%3Faction%3Dgetmeas%2Fget
<JSONデータのサンプル>
{
 "status": 0,
 "body": {
   "updatetime": 1590201515,
   "timezone": "Asia/Tokyo",
   "measuregrps": [
     {
       "grpid": 1234567890,
       "attrib": 0,
       "date": 1589609476,
       "created": 1589609514,
       "category": 1,
       "deviceid": "xxxxxxxxxxxxxxxxxxxxxxxx",
       "measures": [
         {
           "value": 64800,
           "type": 1,
           "unit": -3,
           "algo": 3,
           "fm": 131
         },
         {
           "value": 13580,
           "type": 6,
           "unit": -3
         },
         {
           "value": 56000,
           "type": 5,
         :
この例だと、"measures"のブロック以下に、type毎に値がリストされているのがわかると思います。type1(体重)が64.8kg、type6(体脂肪率)が13.58%になりますね。
開発(データ加工)
辞書型で格納したデータから、"body" -> "measuregrps"のブロックを特定して、測定データ件数をカウントして配列(グラフ作成用)を作成します。
また、測定データ1件1件に対して以下の処理を行います。
- "dt"(タイムスタンプ)をもとに日付を取得
- "type":1 に該当する"value"の値を取得(体重)
- "type":6 に該当する"value"の値を取得(体脂肪率)
開発(グラフ表示)
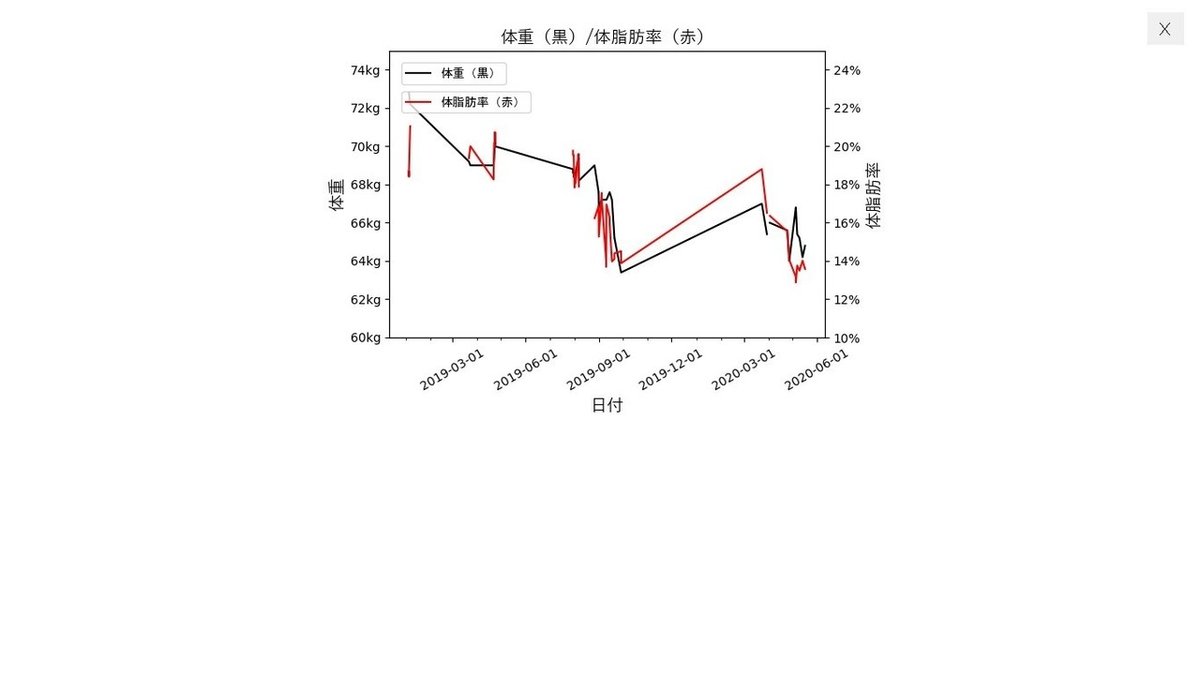
listy1に測定タイミング毎の体重、listy2に体脂肪率を格納し、2軸グラフとします。その後に書式設定を行った結果、以下のように表示されました。

ソースコード
################################
###        Withings        #####
################################
###
## withingsアクセストークンファイル			withingsAccessTokenFile
## Withings API(Measure) URL			withingsMeasureUrl
## Withings API(Measure) URLパラメーター	withingsMeasureUrlParams
## Withings API(Measure) URLヘッダー		withingsMeasureUrlHeaders
## Withings API(Measure) URLデータ		withingsMeasureUrlData
## Withings測定データ						withingsMeasureGrps
## Withings測定データ件数					withingsMeasureCount

## 各種パッケージのインポート
from tkinter import *
import tkinter.ttk as ttk
import os
import requests
import json
import datetime
import matplotlib.pyplot as plt
from matplotlib.font_manager import FontProperties
from matplotlib.backends.backend_tkagg import FigureCanvasTkAgg
import matplotlib.ticker as ticker
import matplotlib.dates as mdates
from matplotlib.dates import DateFormatter


## WithingsのAccessTokenをRefreshする。(ファイルに保管)
scr_path = os.path.dirname(os.path.abspath(sys.argv[0]))  ## このスクリプトの絶対パス
import Withings_RefreshToken

## WithingsのAccessTokenをファイルから取得する。
withingsAccessTokenFile = 'Withings_AccessToken.txt'
with open(withingsAccessTokenFile, 'r') as fd:
   WITHING_ACCESS_TOKEN = fd.readline().rstrip('\n')

## WithingsへのWeb APIアクセス時のパラメーター(設定値)
withingsMeasureUrl = "https://wbsapi.withings.net/measure"
withingsMeasureUrlParams = {"action":"getmeas"}
withingsMeasureUrlHeaders = {'Authorization': 'Bearer ' + WITHING_ACCESS_TOKEN}
withingsMeasureUrlData ={
     'meastype': '1,6',        ##体重は1(Weight (kg))、体脂肪率は6(Fat Ratio (%))を指定
     'category': '1',            ##
     'startdate': '1546300800',  ##2019/1/1
     'enddate': '1735657200',    ##2025/1/1
     }

##################################    メイン処理    ##################################

## メインウィンドウ作成
root = Tk()

## メインウィンドウサイズ
root.geometry("1024x768")

## フレームを作成
frame1=Frame(root, bg="white")    ##グラフ表示用フレーム

## ジオメトリマネージャーで各項目を表示
frame1.pack(fill='both',expand=True)

## レイアウト調整(横幅を画面に合わせる)
frame1.columnconfigure(0, weight=1)  ##frame1は1項目なので引数は0

## メインウィンドウを閉じる
def wm_close():
   root.destroy()

## 閉じるボタン作成
btn=Button(root, text=" X ", font=('', 16), relief=FLAT, command=wm_close)

## 画面がリサイズされたとき
def change_size(event):
   ## ボタンの位置を右上に
   btn.place(x=root.winfo_width() - 60, y=14)

## 画面のリサイズをバインドする
root.bind('<Configure>', change_size)

## メインウィンドウの最大化、最前面表示
root.attributes("-fullscreen", "1")
root.attributes("-topmost", True)

########################    Withingsデータ取得/更新    ########################

def withingsUpdate():

   ## Withings に問い合わせを行う
   response = requests.get(withingsMeasureUrl,params=withingsMeasureUrlParams,headers=withingsMeasureUrlHeaders,data=withingsMeasureUrlData)
   rtext = response.json()
   withingsMeasureGrps = rtext['body']['measuregrps']

   ## "body" -> "measuregrps"配下の測定データの個数をカウントして、その個数分の配列を作成
   withingsMeasureCount = len(withingsMeasureGrps)
   ## x軸:時間、y軸(1):体重、y軸(2):体脂肪率
   listx = [None]*withingsMeasureCount
   listy1 = [None]*withingsMeasureCount
   listy2 = [None]*withingsMeasureCount


   ##### 測定データから"date"の値を取得し、"maeasures"以下からtype:1(体重)、type:6(体脂肪率)を取得

   ## 測定データの個数分、以下を繰り返す
   for i in range(withingsMeasureCount):
       tmpMeasureGrp = withingsMeasureGrps[i]  ##tmpMeasureGrp:測定データ(1回分)
   ## "date"の値を取得して、timestampから日付形式に変換
       listx[i] = datetime.datetime.fromtimestamp(tmpMeasureGrp['date'])

   ## "maeasures"以下の各type毎のデータのうち、type:1(体重)、type:6(体脂肪率)のデータを取得
       for j in range(len(tmpMeasureGrp['measures'])):
           tmpMeasure = tmpMeasureGrp['measures'][j]    ##tmpMeasure:Type毎データ
           if tmpMeasure['type'] == 1:
               listy1[i] = tmpMeasure['value']/1000  ##Weight
           elif tmpMeasure['type'] == 6:
               listy2[i] = tmpMeasure['value']/1000  ##Fat Ratio


########################    Withingsグラフ作成    ########################

   ## 表示エリアの設定
   fig = plt.Figure()
   fig.subplots_adjust(bottom=0.2)
   ax1 = fig.add_subplot()

   ## 2軸グラフの設定(ax1とax2を関連させる)
   ax2 = ax1.twinx()

   ax1.plot(listx,listy1,color='black',label="体重")  ## 体重グラフ(1軸)を作成
   ax2.plot(listx,listy2,color='red',label="体脂肪率")  ## 体脂肪率グラフ(2軸)を作成

   fp = FontProperties(fname=r'C:\WINDOWS\Fonts\YuGothM.ttc', size=14)    ##フォントファイルを指定

   ## 体重グラフ(1軸)の表示設定
   ax1.set_title(u'体重(黒)/体脂肪率(赤)',fontproperties = fp)  ## タイトル名
   ax1.set_xlabel(u'日付',fontproperties = fp)     ## 横軸のラベル名
   ax1.set_ylabel(u'体重',fontproperties = fp)    ## 縦軸のラベル名
   ax1.legend(['体重(黒)'],bbox_to_anchor=(0, 1), loc='upper left', borderaxespad=1, fontsize=8, prop={"family":"MS Gothic"})    ## 凡例を設定
   ax1.set_ylim(60,75)    ## 縦軸の上限、下限を設定

   ## 体脂肪率グラフ(2軸)の表示設定
   ax2.set_xlabel(u'',fontproperties = fp)              ## 横軸のラベル名
   ax2.set_ylabel(u'体脂肪率',fontproperties = fp)          ## 縦軸のラベル名
   ax2.legend(['体脂肪率(赤)'],bbox_to_anchor=(0, 0.9), loc='upper left', borderaxespad=1, fontsize=8, prop={"family":"MS Gothic"})    ## 凡例を設定
   ax2.set_ylim(10,25)    ## 縦軸の上限、下限を設定

   ## 軸の目盛りに単位をつける
   ax1.yaxis.set_major_formatter(ticker.FormatStrFormatter("%dkg"))    ## 単位(kg)を付与
   ax2.yaxis.set_major_formatter(ticker.FormatStrFormatter("%d%%"))    ## 単位(%)を付与

   ## x軸(日付)の表示設定
   xaxis_ = ax1.xaxis
   xaxis_.set_major_formatter(DateFormatter('%Y-%m-%d'))    ## x軸(日付)の表記フォーマット
   xaxis_.set_major_locator(mdates.MonthLocator(interval=3))    ## x軸(日付)のラベル間隔
   xaxis_.set_minor_locator(mdates.MonthLocator(interval=1))    ## x軸(日付)の目盛間隔
   xlabels = ax1.get_xticklabels()
   plt.setp(xlabels, rotation=30)    ## x軸(日付)の表示が重ならなうように回転

   canvas = FigureCanvasTkAgg(fig, master=root)
   canvas.draw()
   canvas.get_tk_widget().pack(in_=frame1)

   return

## 初回起動
withingsUpdate()

## メインループ
root.mainloop()
<関連記事>
Strava/Withings Web API開発(天気と走行距離と体重をダッシュボードで表示してみた)
https://note.com/sanoatsu/n/nbe00ce35d3b1
Strava/Withings Web API開発 - 全体概要
https://note.com/sanoatsu/n/ncc074b9ce5f7
Strava/Withings Web API開発 - 準備編①
https://note.com/sanoatsu/n/n0104f85631cf
Strava/Withings Web API開発 - 準備編②
https://note.com/sanoatsu/n/n4d05a6f1cb2d
Strava/Withings Web API開発 - 準備編③
https://note.com/sanoatsu/n/nb60129601d54
Strava/Withings Web API開発 - 開発編①(OpenWeather)
https://note.com/sanoatsu/n/n69dd5ca2b560
Strava/Withings Web API開発 - 開発編②(Strava)
https://note.com/sanoatsu/n/naffa4afd4325
Strava/Withings Web API開発 - Pythonリファレンス
Web API認証
https://note.com/sanoatsu/n/n98742c974b17
GUIレイアウト作成:Tkinter
https://note.com/sanoatsu/n/ncb830ae933dd/
日付・時刻処理:datetime
https://note.com/sanoatsu/n/n050ca16df6c7/
HTTPでのデータ取得:Requests
https://note.com/sanoatsu/n/n75e81bc2896a
データ格納:JSONと配列、辞書
https://note.com/sanoatsu/n/na76312571869/
Stravaのデータ処理:StravaIO
https://note.com/sanoatsu/n/n3d9593ff83c6/
よろしければサポートお願いします。
