【R言語】prophet;時系列予測モデル
背景
本業でブランド別の将来売上を予測するというタスクが降ってきまして。。
知ってはいたもののあまり手を付けていなかったprophetというmeta社が開発した時系列モデルのパッケージが有能だということで、備忘録がてら使い方含めnoteに記しておこうと思った次第です。
prophetについて
metaの公式サイトは英語で書かれていますが、結構丁寧に、わかりやすく記述されているので、何か不明点があれば、確認してみるとよいでしょう。
ただハイパーパラメータのチューニングはなぜかpythonコードしか書かれておらず、Rユーザーにとってはぐぬぬ。。という感じは否めません。。
こちらのブログ記事もわかりやすかったので参考までにシェアします。
公式サイトの簡単な実行コード
まずはパッケージのインストールからモデリング、予測、可視化までの一連の作業を行っても、たかだか以下のコードだけで済みます。
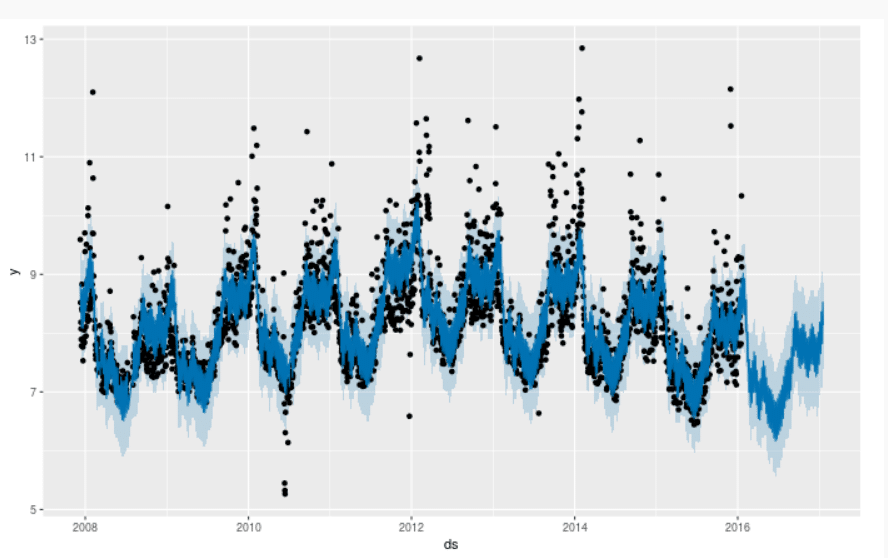
雑にまわしても、そこそこ当てはまりの悪くなさそうな予測になっていそうです。高いスパイク部分が当て切れていなそうですが、処理コードとしては、とても簡便なつくりになっています。
# まずはインストール
install.packages('prophet')
# 呼び出し
library(prophet)

# データ読み込み(公式サイトデータ)
df <- read.csv('https://raw.githubusercontent.com/facebook/prophet/main/examples/example_wp_log_peyton_manning.csv')

# prophet関数にdfを渡す
m <- prophet(df)

# 予測したい期間のデータフレームを作る
future <- make_future_dataframe(m, periods = 365)
tail(future)

# predictにm,futureを渡すと予測結果を返してくれる
forecast <- predict(m, future)

# 可視化
plot(m, forecast)
実装
概要
簡単な使い方は上記で理解できたかと思うので、ここからは実践的なやり方をご紹介していきます。
やりたいことは、あるブランドの時系列的な動きと外部変数(配荷量と投資媒体費用)を用いてブランドの将来売上を予測する、です。
公式サイトにはなかった、ハイパーパラメータをチューニングするコードも記載していますので、参考例としてみていただければと思います。
処理1:ライブラリと環境セットアップ
まずは必要なライブラリを読み込んでいきますが、ハイパーパラメータのチューニングの際に、pythonのoptunaというライブラリを用いるので、python環境のセットアップも行ってください。(ここらへんでエラーが出る方も多いかもしれませんが、chatgptに聞いたりすると数回のやり取りで解決する場合が多いです)
# ライブラリの読み込み
library(pacman)
p_load(reticulate, tidyverse, lubridate, prophet, scales)

# python環境のセットアップ
use_condaenv("base")
# py_install("optuna") # 未インストールの場合要実施
optuna = import("optuna")
処理2:サンプルデータの生成
次にサンプルデータの生成を行います。
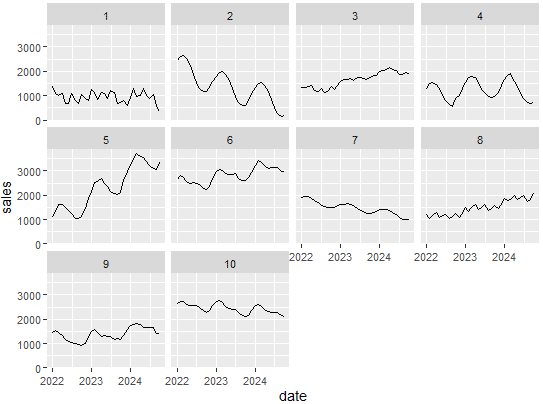
ややコードが長いですが、色々な条件(トレンドや季節性など)がランダムに発生するデータを吐き出してくれる関数になります。
以下の[1:10]の部分を調整することで、吐き出すブランド数(brand_id)の数を調整することが出来ます。
なおデータについては、ブランドID別に売上(sales)、配荷数量(distribution_sales)、媒体費(media_cost)が入っています。
sales_data = map_dfr(1:10, generate_brand_data) |> arrange(brand_id, date)
# creat dataset
# 時系列データを吐き出す関数
generate_brand_data = function(brand_id, start_date = "2022-01-01", end_date = "2024-10-31") {
  # 日付シーケンスの生成
  dates = seq(as.Date(start_date), as.Date(end_date), by = "month")
  n_months = length(dates)

  # より多様なブランドタイプ(1-10の間でランダム)
  brand_type = sample(1:10, 1)

  # 基準値の動的設定
  base_value = runif(1, 800, 2500)
  growth_rate = runif(1, 20, 80)
  decline_rate = runif(1, 15, 45)

  # 変化点の生成(データ長の調整を確実に)
  generate_segmented_trend = function(n_points, base_value) {
    n_segments = sample(2:4, 1)  # 2から4のセグメント数
    segment_points = sort(sample(2:(n_points-1), n_segments-1))
    segment_lengths = diff(c(0, segment_points, n_points))
    segment_values = base_value * runif(n_segments, 0.7, 1.3)

    result = numeric(n_points)
    current_pos = 1

    for(i in 1:n_segments) {
      end_pos = current_pos + segment_lengths[i] - 1
      result[current_pos:end_pos] = seq(
        segment_values[i],
        if(i < n_segments) segment_values[i+1] else segment_values[i],
        length.out = segment_lengths[i]
      )
      current_pos = end_pos + 1
    }

    return(result)
  }

  # より複雑なトレンドパターンの生成
  base_trend = case_when(
    # 通常の上昇トレンド(変動率ランダム)
    brand_type == 1 ~ {
      growth = runif(1, 0.8, 1.2) * growth_rate
      seq(base_value, base_value + n_months * growth, length.out = n_months)
    },

    # 通常の下降トレンド(変動率ランダム)
    brand_type == 2 ~ {
      decline = runif(1, 0.8, 1.2) * decline_rate
      seq(base_value, base_value - n_months * decline, length.out = n_months)
    },

    # 変動するフラットトレンド
    brand_type == 3 ~ {
      base_value + sin(seq(0, 2*pi, length.out = n_months)) * runif(1, 50, 150)
    },

    # 複数の変化点を持つトレンド
    brand_type == 4 ~ generate_segmented_trend(n_months, base_value),

    # 複雑なランダムウォーク
    brand_type == 5 ~ {
      steps = rnorm(n_months, 0, runif(1, 30, 70))
      volatility = runif(n_months, 0.8, 1.2)
      base_value + cumsum(steps * volatility)
    },

    # 段階的な成長
    brand_type == 6 ~ {
      n_steps = 4
      step_length = ceiling(n_months/n_steps)
      plateau_levels = base_value * c(1, runif(n_steps-1, 1.1, 1.5))
      rep(plateau_levels, each = step_length)[1:n_months]
    },

    # 周期的なパターン(複数の周期を組み合わせ)
    brand_type == 7 ~ {
      period1 = runif(1, 3, 6)
      period2 = runif(1, 6, 12)
      base_value +
        sin(2 * pi * (1:n_months)/period1) * 200 +
        cos(2 * pi * (1:n_months)/period2) * 150
    },

    # 指数的成長(変動率ランダム)
    brand_type == 8 ~ {
      growth_rate = runif(1, 0.3, 0.7)
      base_value * exp(seq(0, growth_rate, length.out = n_months))
    },

    # S字カーブ
    brand_type == 9 ~ {
      midpoint = n_months/2
      steepness = runif(1, 0.1, 0.3)
      range = runif(1, 500, 1000)
      base_value + range/(1 + exp(-steepness * (1:n_months - midpoint)))
    },

    # 複合パターン
    brand_type == 10 ~ {
      base = seq(base_value, base_value * runif(1, 1.2, 1.5), length.out = n_months)
      cycles = sin(2 * pi * (1:n_months)/runif(1, 4, 8)) * runif(1, 100, 200)
      base + cycles
    }
  )

  # 複雑な季節性パターンの生成
  season_type = sample(1:4, 1)
  seasonal_pattern = case_when(
    season_type == 1 ~ { # 単純な季節性
      amplitude = runif(1, 100, 600)
      sin(2 * pi * (1:n_months)/12) * amplitude
    },
    season_type == 2 ~ { # 複合季節性
      annual = sin(2 * pi * (1:n_months)/12) * runif(1, 100, 300)
      quarterly = sin(2 * pi * (1:n_months)/3) * runif(1, 50, 150)
      annual + quarterly
    },
    season_type == 3 ~ { # 変動する季節性
      base_amplitude = runif(1, 100, 400)
      amplitude_trend = seq(1, runif(1, 0.5, 1.5), length.out = n_months)
      sin(2 * pi * (1:n_months)/12) * base_amplitude * amplitude_trend
    },
    season_type == 4 ~ { # 非対称な季節性
      x = 2 * pi * (1:n_months)/12
      amplitude = runif(1, 100, 400)
      (sin(x) + 0.5 * sin(2*x)) * amplitude
    }
  )

  # ノイズの生成(自己相関を含む)
  noise_type = sample(1:3, 1)
  noise = case_when(
    noise_type == 1 ~ as.numeric(arima.sim(list(ar = runif(1, 0.2, 0.4)), n = n_months)) * runif(1, 30, 70),
    noise_type == 2 ~ cumsum(rnorm(n_months, 0, runif(1, 10, 30))),
    noise_type == 3 ~ rnorm(n_months, 0, runif(1, 40, 80))
  )

  # 最終的な売上の計算
  sales = pmax(base_trend + seasonal_pattern + noise, 100)

  # より複雑な配荷売上と媒体費用の関係性
  distribution_factor = runif(1, 0.7, 0.9)
  media_efficiency = runif(1, 0.1, 0.4)

  distribution_sales = sales * (distribution_factor + rnorm(n_months, 0, 0.05))
  media_cost = sales * (media_efficiency * (1 + sin(2 * pi * (1:n_months)/6) * 0.2) +
                          rnorm(n_months, 0, 0.02))

  # データフレームの作成
  tibble(
    brand_id = brand_id,
    date = dates,
    sales = round(sales, 0),
    distribution_sales = round(distribution_sales, 0),
    media_cost = round(media_cost, 0)
  )
}
sales_data = map_dfr(1:10, generate_brand_data) |>
  arrange(brand_id, date)

# graph
sales_data |>
  ggplot(aes(x = date, y = sales)) +
  geom_line() +
  facet_wrap(~brand_id)
例えば以下のような時系列データを出力します。様々な時系列データを吐き出してくれていますね。

処理3:関数化
ここでは4つの自作関数を生成しています。
正規化関数(normalize_column)
これは正規化を行う関数になります。データ処理関数(data_processing)
prophetは日付をds, 目的変数(本データの場合はsales)をyと命名する必要があるので、その処理を関数化しています。最適化の目的関数(objective_function_optuna)
ハイパーパラメータのチューニングにおける目的関数を定義した関数になります。ここではoptunaというpythonライブラリのベイズ最適化手法を用いていますが、rBayesianOptimizationというRのパッケージを用いたものより、処理の性能、速度ともに圧倒的に優れていたので採用しています。(ここらへんやはりpython>>>>Rは否めません。。)最適化の実行関数(run_optimization_optuna)
最適化を実行する関数です。戻り値として、ベストなパラメータとMAPEを返すようにしています。
# 正規化関数の定義
normalize_column = function(x) {
  (x - mean(x)) / sd(x)
}

# データの処理関数を修正(正規化版と非正規化版)
data_processing = function(df, normalize = FALSE) {
  df_processed = sales_data |>
    filter(brand_id == BRAND) |>
    select(all_of(c(key_cols, add_vars))) |>
    rename(ds = date, y = sales) |>
    select(-brand_id) |>
    arrange(ds)

  if (normalize) {
    # 外部変数のみを正規化
    df_processed = df_processed |>
      mutate(across(all_of(add_vars), normalize_column))
  }

  return(df_processed)
}

# Optunaのobjective関数の定義
objective_function_optuna = function(trial) {
  # Optunaでパラメータの提案を受け取る
  params <- list(
    changepoint_prior_scale = trial$suggest_float("changepoint_prior_scale", 0.001, 0.5, log=TRUE),
    seasonality_prior_scale = trial$suggest_float("seasonality_prior_scale", 0.01, 10, log=TRUE),
    changepoint_range = trial$suggest_float("changepoint_range", 0.8, 0.95),
    n_changepoints = trial$suggest_int("n_changepoints", 5, 35),
    seasonality_mode = trial$suggest_categorical("seasonality_mode", c("additive", "multiplicative")),
    # 正規化の有無をパラメータとして追加
    normalize = trial$suggest_categorical("normalize", c(TRUE, FALSE))
  )

  tryCatch({
    # データの準備(正規化の有無をparamsから取得)
    train_data <- data_processing(df_processed, normalize = params$normalize) %>%
      filter(ds >= train_period_from & ds <= train_period_to)
    valid_data <- data_processing(df_processed, normalize = params$normalize) %>%
      filter(ds >= valid_period_from & ds <= valid_period_to)

    # モデルの初期化
    model <- prophet(
      changepoint.prior.scale = params$changepoint_prior_scale,
      seasonality.prior.scale = params$seasonality_prior_scale,
      changepoint.range = params$changepoint_range,
      n.changepoints = params$n_changepoints,
      seasonality.mode = params$seasonality_mode
    )

    # 説明変数の追加
    for (col in add_vars) {
      model <- add_regressor(model, col)
    }

    # モデルのフィッティング
    model <- fit.prophet(model, train_data)

    # 予測用データフレームの作成
    future <- make_future_dataframe(model, periods = nrow(valid_data), freq = 'month')

    # 説明変数を追加
    for (col in add_vars) {
      future[[col]] <- c(train_data[[col]], valid_data[[col]])
    }

    # 予測実行
    forecast <- predict(model, future)
    valid_forecast <- tail(forecast, nrow(valid_data))

    # MAPEの計算
    if (any(valid_data$y == 0)) {
      return(Inf)
    }
    val_mape <- mean(abs((valid_forecast$yhat - valid_data$y) / valid_data$y)) * 100

    return(val_mape)
  }, error = function(e) {
    warning(sprintf("Trial failed with error: %s", e$message))
    return(Inf)
  })
}

# Optunaでの最適化実行関数
run_optimization_optuna <- function(n_trials) {
  study <- optuna$create_study(direction = "minimize")

  # 最適化実行
  study$optimize(objective_function_optuna, n_trials = n_trials)

  # 最適なパラメータとスコアを返す
  best_params <- study$best_params
  best_value <- study$best_value

  return(list(
    params = best_params,
    score = best_value,
    study = study
  ))
}
処理4:ハイパーパラメータのチューニング
では、先ほどの関数を用いながら、ハイパーパラメータのチューニングを実行していきます。
ブランド数が10あるので、まとめて実行するコードでもよかったのですが、コードが複雑になってしまいそうなので、いったんbrand_id == 1のみを対象に回してみたいと思います。
run_optimizationのn_trialsという引数で最適化の中でのイテレーションの数を設定します。optunaで高速化できているとはいえ、多少時間もかかるので(わたくしの環境でn_trials=50で8分程度)、その点ご了承ください。
# キーとなる列
key_cols = c('brand_id', 'date', 'sales')

# 予測に用いる外部変数
add_vars = c(
  'distribution_sales',
  'media_cost'
)

# 対象ブランド
BRAND = 1

# データの処理
df_processed = data_processing(df)

# 学習期間
train_period_from = '2022-01-01'
train_period_to = '2024-03-01'

# 精度検証期間
valid_period_from = (ymd(train_period_to) + months(1)) |> as.character()
valid_period_to = df_processed |>
  filter(y > 0) |>
  summarise(max_date = max(ds)) |>
  pull(max_date) |>
  as.character()

# パラメータの探索範囲
bounds = list(
  changepoint_prior_scale = c(0.001, 0.5),
  seasonality_prior_scale = c(0.01, 10),
  changepoint_range = c(0.8, 0.95),
  n_changepoints = c(5, 35),
  seasonality_mode = c("additive", "multiplicative")
)

# 使用例
# 時間も計測
tictoc::tic()
result_optuna = run_optimization_optuna(n_trials = 50)
tictoc::toc()
処理5:予測
チューニングしたパラメータを用いて、学習と予測を行っていきます。
# 結果の比較
compare_results_optuna = function(results) {
  # 単一の結果を受け取るように修正
  result_df = tibble(
    best_score = results$score,
    best_params = list(results$params)
  ) %>%
    unnest_wider(best_params)

  # パラメータと結果を表示
  cat("\nBest Configuration:\n")
  cat("MAPE:", round(result_df$best_score, 2), "%\n")
  cat("Seasonality Mode:", result_df$seasonality_mode, "\n")
  cat("Normalization:", result_df$normalize, "\n")
  cat("Changepoint Prior Scale:", round(result_df$changepoint_prior_scale, 4), "\n")
  cat("Seasonality Prior Scale:", round(result_df$seasonality_prior_scale, 4), "\n")
  cat("Changepoint Range:", round(result_df$changepoint_range, 4), "\n")
  cat("Number of Changepoints:", result_df$n_changepoints, "\n")

  return(result_df)
}

# 最良のモデルを特定
get_best_model = function(results) {
  # パラメータを直接取得
  best_params <- results$params

  list(
    params = best_params,
    mape = results$score
  )
}

# 予測を実行
make_prediction = function(best_model_info) {
  # テストデータの準備(最後の2ヶ月)
  test_data = data_processing(df_processed, normalize = best_model_info$params$normalize) %>%
    slice_tail(n = 2)

  # 学習データの準備(テストデータを除いた部分)
  train_data = data_processing(df_processed, normalize = best_model_info$params$normalize) %>%
    slice_head(n = nrow(df_processed) - 2)

  # モデルの初期化
  m = prophet::prophet(
    changepoint.prior.scale = best_model_info$params$changepoint_prior_scale,
    seasonality.prior.scale = best_model_info$params$seasonality_prior_scale,
    changepoint.range = best_model_info$params$changepoint_range,
    n.changepoints = as.integer(best_model_info$params$n_changepoints),
    seasonality.mode = best_model_info$params$seasonality_mode
  )

  # 説明変数を追加
  for (col in add_vars) {
    m = add_regressor(m, col)
  }

  # モデルのフィッティング
  m = fit.prophet(m, train_data)

  # 予測用データフレームの作成
  future = make_future_dataframe(m, periods = 2, freq = 'month')

  # 説明変数を予測用データフレームに追加
  for (col in add_vars) {
    future[[col]] = c(train_data[[col]], test_data[[col]])
  }

  # 予測の実行
  forecast = predict(m, future)

  # 予測値と実績値の比較(最後の2ヶ月)
  predictions = tail(forecast, 2)
  mape = mean(abs((test_data$y - predictions$yhat) / test_data$y)) * 100

  # 結果の表示
  cat("\nTest period MAPE:", round(mape, 2), "%\n")
  cat("\nActual vs Predicted values:\n")
  print(tibble(
    Date = test_data$ds,
    Actual = test_data$y,
    Predicted = round(predictions$yhat, 1)
  ))

  # モデルと予測結果を返す
  list(
    model = m,
    forecast = forecast,
    mape = mape
  )
}

# 実行例
# 結果の比較
results_comparison = compare_results_optuna(result_optuna)

# 最良モデルの取得と予測
best_model_info = get_best_model(result_optuna)
prediction_results = make_prediction(best_model_info)

# プロット
plot(prediction_results$model, prediction_results$forecast)
prophet_plot_components(prediction_results$model, prediction_results$forecast)
# 予測期間のMAPE
prediction_results$mape
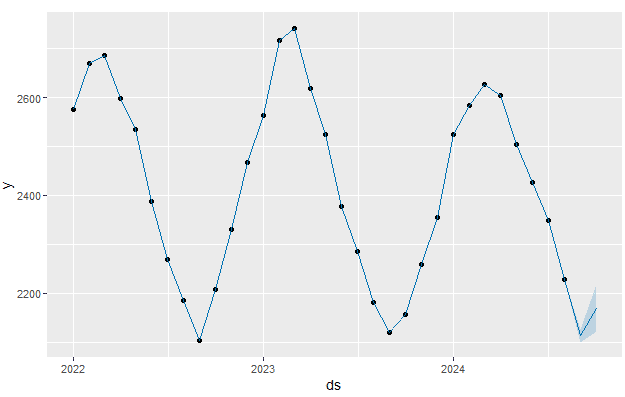
以下が予測結果です。点が実績値、青線が予測値になります。過学習していそうな気配で気になりますが、予測期間のMAPEも1.63なので、問題なさそうです。(本コードは学習期間後の翌月、翌々月の売上を予測するものになっているので、より長期に予測したい場合はコード内の該当部分を可変させてください)

全コード
library(pacman)

p_load(reticulate, tidyverse, lubridate, prophet, scales)

# Python環境のセットアップ
use_condaenv("base")
# py_install("optuna")
optuna = import("optuna")

# creat dataset
generate_brand_data = function(brand_id, start_date = "2022-01-01", end_date = "2024-10-31") {
  # 日付シーケンスの生成
  dates = seq(as.Date(start_date), as.Date(end_date), by = "month")
  n_months = length(dates)

  # より多様なブランドタイプ(1-10の間でランダム)
  brand_type = sample(1:10, 1)

  # 基準値の動的設定
  base_value = runif(1, 800, 2500)
  growth_rate = runif(1, 20, 80)
  decline_rate = runif(1, 15, 45)

  # 変化点の生成(データ長の調整を確実に)
  generate_segmented_trend = function(n_points, base_value) {
    n_segments = sample(2:4, 1)  # 2から4のセグメント数
    segment_points = sort(sample(2:(n_points-1), n_segments-1))
    segment_lengths = diff(c(0, segment_points, n_points))
    segment_values = base_value * runif(n_segments, 0.7, 1.3)

    result = numeric(n_points)
    current_pos = 1

    for(i in 1:n_segments) {
      end_pos = current_pos + segment_lengths[i] - 1
      result[current_pos:end_pos] = seq(
        segment_values[i],
        if(i < n_segments) segment_values[i+1] else segment_values[i],
        length.out = segment_lengths[i]
      )
      current_pos = end_pos + 1
    }

    return(result)
  }

  # より複雑なトレンドパターンの生成
  base_trend = case_when(
    # 通常の上昇トレンド(変動率ランダム)
    brand_type == 1 ~ {
      growth = runif(1, 0.8, 1.2) * growth_rate
      seq(base_value, base_value + n_months * growth, length.out = n_months)
    },

    # 通常の下降トレンド(変動率ランダム)
    brand_type == 2 ~ {
      decline = runif(1, 0.8, 1.2) * decline_rate
      seq(base_value, base_value - n_months * decline, length.out = n_months)
    },

    # 変動するフラットトレンド
    brand_type == 3 ~ {
      base_value + sin(seq(0, 2*pi, length.out = n_months)) * runif(1, 50, 150)
    },

    # 複数の変化点を持つトレンド
    brand_type == 4 ~ generate_segmented_trend(n_months, base_value),

    # 複雑なランダムウォーク
    brand_type == 5 ~ {
      steps = rnorm(n_months, 0, runif(1, 30, 70))
      volatility = runif(n_months, 0.8, 1.2)
      base_value + cumsum(steps * volatility)
    },

    # 段階的な成長
    brand_type == 6 ~ {
      n_steps = 4
      step_length = ceiling(n_months/n_steps)
      plateau_levels = base_value * c(1, runif(n_steps-1, 1.1, 1.5))
      rep(plateau_levels, each = step_length)[1:n_months]
    },

    # 周期的なパターン(複数の周期を組み合わせ)
    brand_type == 7 ~ {
      period1 = runif(1, 3, 6)
      period2 = runif(1, 6, 12)
      base_value +
        sin(2 * pi * (1:n_months)/period1) * 200 +
        cos(2 * pi * (1:n_months)/period2) * 150
    },

    # 指数的成長(変動率ランダム)
    brand_type == 8 ~ {
      growth_rate = runif(1, 0.3, 0.7)
      base_value * exp(seq(0, growth_rate, length.out = n_months))
    },

    # S字カーブ
    brand_type == 9 ~ {
      midpoint = n_months/2
      steepness = runif(1, 0.1, 0.3)
      range = runif(1, 500, 1000)
      base_value + range/(1 + exp(-steepness * (1:n_months - midpoint)))
    },

    # 複合パターン
    brand_type == 10 ~ {
      base = seq(base_value, base_value * runif(1, 1.2, 1.5), length.out = n_months)
      cycles = sin(2 * pi * (1:n_months)/runif(1, 4, 8)) * runif(1, 100, 200)
      base + cycles
    }
  )

  # 複雑な季節性パターンの生成
  season_type = sample(1:4, 1)
  seasonal_pattern = case_when(
    season_type == 1 ~ { # 単純な季節性
      amplitude = runif(1, 100, 600)
      sin(2 * pi * (1:n_months)/12) * amplitude
    },
    season_type == 2 ~ { # 複合季節性
      annual = sin(2 * pi * (1:n_months)/12) * runif(1, 100, 300)
      quarterly = sin(2 * pi * (1:n_months)/3) * runif(1, 50, 150)
      annual + quarterly
    },
    season_type == 3 ~ { # 変動する季節性
      base_amplitude = runif(1, 100, 400)
      amplitude_trend = seq(1, runif(1, 0.5, 1.5), length.out = n_months)
      sin(2 * pi * (1:n_months)/12) * base_amplitude * amplitude_trend
    },
    season_type == 4 ~ { # 非対称な季節性
      x = 2 * pi * (1:n_months)/12
      amplitude = runif(1, 100, 400)
      (sin(x) + 0.5 * sin(2*x)) * amplitude
    }
  )

  # ノイズの生成(自己相関を含む)
  noise_type = sample(1:3, 1)
  noise = case_when(
    noise_type == 1 ~ as.numeric(arima.sim(list(ar = runif(1, 0.2, 0.4)), n = n_months)) * runif(1, 30, 70),
    noise_type == 2 ~ cumsum(rnorm(n_months, 0, runif(1, 10, 30))),
    noise_type == 3 ~ rnorm(n_months, 0, runif(1, 40, 80))
  )

  # 最終的な売上の計算
  sales = pmax(base_trend + seasonal_pattern + noise, 100)

  # より複雑な配荷売上と媒体費用の関係性
  distribution_factor = runif(1, 0.7, 0.9)
  media_efficiency = runif(1, 0.1, 0.4)

  distribution_sales = sales * (distribution_factor + rnorm(n_months, 0, 0.05))
  media_cost = sales * (media_efficiency * (1 + sin(2 * pi * (1:n_months)/6) * 0.2) +
                          rnorm(n_months, 0, 0.02))

  # データフレームの作成
  tibble(
    brand_id = brand_id,
    date = dates,
    sales = round(sales, 0),
    distribution_sales = round(distribution_sales, 0),
    media_cost = round(media_cost, 0)
  )
}
sales_data = map_dfr(1:10, generate_brand_data) |>
  arrange(brand_id, date)

# graph
sales_data |>
  ggplot(aes(x = date, y = sales)) +
  geom_line() +
  facet_wrap(~brand_id)


# キーとなる列
key_cols = c('brand_id', 'date', 'sales')

# 予測に用いる外部変数
add_vars = c(
  'distribution_sales',
  'media_cost'
)

# 対象ブランド
BRAND = 1

# 正規化関数の定義
normalize_column = function(x) {
  (x - mean(x)) / sd(x)
}

# データの処理関数を修正(正規化版と非正規化版)
data_processing = function(df, normalize = FALSE) {
  df_processed = sales_data |>
    filter(brand_id == BRAND) |>
    select(all_of(c(key_cols, add_vars))) |>
    rename(ds = date, y = sales) |>
    select(-brand_id) |>
    arrange(ds)

  if (normalize) {
    # 外部変数のみを正規化
    df_processed = df_processed |>
      mutate(across(all_of(add_vars), normalize_column))
  }

  return(df_processed)
}

# Optunaのobjective関数の定義
objective_function_optuna = function(trial) {
  # Optunaでパラメータの提案を受け取る
  params <- list(
    changepoint_prior_scale = trial$suggest_float("changepoint_prior_scale", 0.001, 0.5, log=TRUE),
    seasonality_prior_scale = trial$suggest_float("seasonality_prior_scale", 0.01, 10, log=TRUE),
    changepoint_range = trial$suggest_float("changepoint_range", 0.8, 0.95),
    n_changepoints = trial$suggest_int("n_changepoints", 5, 35),
    seasonality_mode = trial$suggest_categorical("seasonality_mode", c("additive", "multiplicative")),
    # 正規化の有無をパラメータとして追加
    normalize = trial$suggest_categorical("normalize", c(TRUE, FALSE))
  )

  tryCatch({
    # データの準備(正規化の有無をparamsから取得)
    train_data <- data_processing(df_processed, normalize = params$normalize) %>%
      filter(ds >= train_period_from & ds <= train_period_to)
    valid_data <- data_processing(df_processed, normalize = params$normalize) %>%
      filter(ds >= valid_period_from & ds <= valid_period_to)

    # モデルの初期化
    model <- prophet(
      changepoint.prior.scale = params$changepoint_prior_scale,
      seasonality.prior.scale = params$seasonality_prior_scale,
      changepoint.range = params$changepoint_range,
      n.changepoints = params$n_changepoints,
      seasonality.mode = params$seasonality_mode
    )

    # 説明変数の追加
    for (col in add_vars) {
      model <- add_regressor(model, col)
    }

    # モデルのフィッティング
    model <- fit.prophet(model, train_data)

    # 予測用データフレームの作成
    future <- make_future_dataframe(model, periods = nrow(valid_data), freq = 'month')

    # 説明変数を追加
    for (col in add_vars) {
      future[[col]] <- c(train_data[[col]], valid_data[[col]])
    }

    # 予測実行
    forecast <- predict(model, future)
    valid_forecast <- tail(forecast, nrow(valid_data))

    # MAPEの計算
    if (any(valid_data$y == 0)) {
      return(Inf)
    }
    val_mape <- mean(abs((valid_forecast$yhat - valid_data$y) / valid_data$y)) * 100

    return(val_mape)
  }, error = function(e) {
    warning(sprintf("Trial failed with error: %s", e$message))
    return(Inf)
  })
}

# Optunaでの最適化実行関数
run_optimization_optuna <- function(n_trials) {
  study <- optuna$create_study(direction = "minimize")

  # 最適化実行
  study$optimize(objective_function_optuna, n_trials = n_trials)

  # 最適なパラメータとスコアを返す
  best_params <- study$best_params
  best_value <- study$best_value

  return(list(
    params = best_params,
    score = best_value,
    study = study
  ))
}

# データの処理
df_processed = data_processing(df)

# 学習期間
train_period_from = '2022-01-01'
train_period_to = '2024-03-01'

# 精度検証期間
valid_period_from = (ymd(train_period_to) + months(1)) |> as.character()
valid_period_to = df_processed |>
  filter(y > 0) |>
  summarise(max_date = max(ds)) |>
  pull(max_date) |>
  as.character()

# パラメータのチューニング
bounds = list(
  changepoint_prior_scale = c(0.001, 0.5),
  seasonality_prior_scale = c(0.01, 10),
  changepoint_range = c(0.8, 0.95),
  n_changepoints = c(5, 35),
  seasonality_mode = c("additive", "multiplicative")
)

# 使用例
tictoc::tic()
result_optuna = run_optimization_optuna(n_trials = 50)
tictoc::toc()


# 結果の比較
compare_results_optuna = function(results) {
  # 単一の結果を受け取るように修正
  result_df = tibble(
    best_score = results$score,
    best_params = list(results$params)
  ) %>%
    unnest_wider(best_params)

  # パラメータと結果を表示
  cat("\nBest Configuration:\n")
  cat("MAPE:", round(result_df$best_score, 2), "%\n")
  cat("Seasonality Mode:", result_df$seasonality_mode, "\n")
  cat("Normalization:", result_df$normalize, "\n")
  cat("Changepoint Prior Scale:", round(result_df$changepoint_prior_scale, 4), "\n")
  cat("Seasonality Prior Scale:", round(result_df$seasonality_prior_scale, 4), "\n")
  cat("Changepoint Range:", round(result_df$changepoint_range, 4), "\n")
  cat("Number of Changepoints:", result_df$n_changepoints, "\n")

  return(result_df)
}

# 最良のモデルを特定
get_best_model = function(results) {
  # パラメータを直接取得
  best_params <- results$params

  list(
    params = best_params,
    mape = results$score
  )
}

# 予測を実行
make_prediction = function(best_model_info) {
  # テストデータの準備(最後の2ヶ月)
  test_data = data_processing(df_processed, normalize = best_model_info$params$normalize) %>%
    slice_tail(n = 2)

  # 学習データの準備(テストデータを除いた部分)
  train_data = data_processing(df_processed, normalize = best_model_info$params$normalize) %>%
    slice_head(n = nrow(df_processed) - 2)

  # モデルの初期化
  m = prophet::prophet(
    changepoint.prior.scale = best_model_info$params$changepoint_prior_scale,
    seasonality.prior.scale = best_model_info$params$seasonality_prior_scale,
    changepoint.range = best_model_info$params$changepoint_range,
    n.changepoints = as.integer(best_model_info$params$n_changepoints),
    seasonality.mode = best_model_info$params$seasonality_mode
  )

  # 説明変数を追加
  for (col in add_vars) {
    m = add_regressor(m, col)
  }

  # モデルのフィッティング
  m = fit.prophet(m, train_data)

  # 予測用データフレームの作成
  future = make_future_dataframe(m, periods = 2, freq = 'month')

  # 説明変数を予測用データフレームに追加
  for (col in add_vars) {
    future[[col]] = c(train_data[[col]], test_data[[col]])
  }

  # 予測の実行
  forecast = predict(m, future)

  # 予測値と実績値の比較(最後の2ヶ月)
  predictions = tail(forecast, 2)
  mape = mean(abs((test_data$y - predictions$yhat) / test_data$y)) * 100

  # 結果の表示
  cat("\nTest period MAPE:", round(mape, 2), "%\n")
  cat("\nActual vs Predicted values:\n")
  print(tibble(
    Date = test_data$ds,
    Actual = test_data$y,
    Predicted = round(predictions$yhat, 1)
  ))

  # モデルと予測結果を返す
  list(
    model = m,
    forecast = forecast,
    mape = mape
  )
}

# 実行例
# 結果の比較
results_comparison = compare_results_optuna(result_optuna)

# 最良モデルの取得と予測
best_model_info = get_best_model(result_optuna)
prediction_results = make_prediction(best_model_info)

# プロット
plot(prediction_results$model, prediction_results$forecast)
prophet_plot_components(prediction_results$model, prediction_results$forecast)
# 予測期間のMAPE
prediction_results$mape
感想
ハイパーパラメータのチューニングをpythonのoptunaライブラリを使って実行した例が調べた限り(2024/11/18時点)ではなかったので、何度もエラーを吐きながらどうにかコードを書いたので、疲れました。。笑
が、prophetは状態空間モデルよりも楽にコードが書けそうですし、外部変数を用いれない時系列モデル(SARIMAXなど)よりも、柔軟に時系列モデルに対応できそうで、素晴らしいライブラリだと感じました!
副業やってます
2024年から副業を本格的にやり始め、微力ながらも日本企業のインテリジェンス向上を狙いに、日々頑張っております。。!
何かお力になりそうなことがあれば、ご連絡いただけると幸いです。
いいなと思ったら応援しよう!

