【関連:sklearn版】線形回帰(重回帰分析)でハンドボール投げの飛距離を見積もる【python 最小二乗法】
【はじめに】
前回は「cvxpy」を使用し、「最小二乗法」を使った「線形回帰」で「ハンドボール投げの飛距離をみつもる近似式」を作成した。
今回は「線形回帰」に関連して、機械学習ライブラリの定番である「scikit-learn(sklearn)」を使って「ハンドボール投げの飛距離見積もり」を再現してみる。
【例題】:ハンドボール投げの飛距離 ※再掲
「握力(power)・身長(height)・体重(weight)」と「ハンドボール投げの飛距離(distance)」の関係式を次にように仮定する。
(※実際はこんな単純な関係式にはならない)

15人分のハンドボール投げのデータ(サンプルデータ)から、
「仮定した関係式の重み:w」と「オフセット:offset」
をいい感じに決めて、
これから投げる人のおおまかな飛距離を見積もるための「当たらずと雖も遠からず(あたらずといえどもとおからず)な近似式」を作りたい。
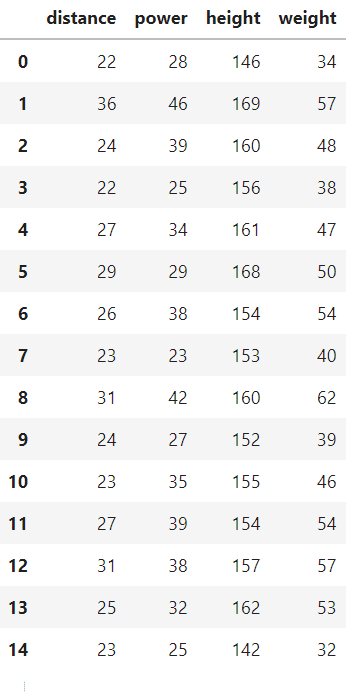
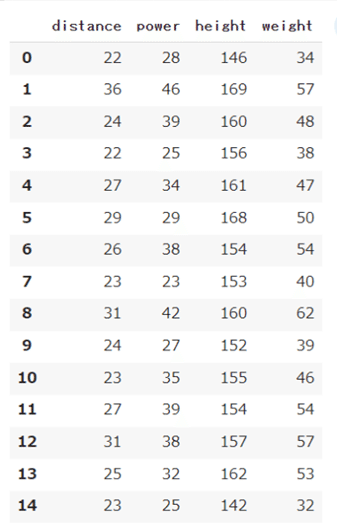
■サンプルデータ(15人分)

【解答例】
実行環境は「Google Colab」。
【1】scikit-learnのインストール/アップデート
※Google Colabには、あらかじめ「scikit-learn」がインストールされているので、やらなくてもOK
!pip install scikit-learn
!pip install -U scikit-learn
■バージョンを確認してみる場合
import sklearn

print(sklearn.__version__)
【ここまでの実行結果例】
1.0.2
【2】サンプルデータの用意
今回のサンプルデータは「pandas」の「DataFrame.from_dict()」を使って「DataFrame」として作成して取り扱う。
■サンプルデータの作成
import pandas as pd

# サンプルデータ
dict_sample_data = dict(
    distance = [22, 36, 24, 22, 27, 29, 26, 23, 31, 24, 23, 27, 31, 25, 23],
    power = [28, 46, 39, 25, 34, 29, 38, 23, 42, 27, 35, 39, 38, 32, 25],
    height =[146, 169, 160, 156, 161, 168, 154, 153, 160, 152, 155, 154, 157, 162, 142],
    weight =[34, 57, 48, 38, 47, 50, 54, 40, 62, 39, 46, 54, 57, 53, 32]
)
df_sample_data = pd.DataFrame.from_dict(dict_sample_data)
df_sample_data
【ここまでの実行結果例】

※offset(intercept:切片)相当のデータについて
「sklearn」では「offset(intercept:切片)相当のデータ」をサンプルデータに仕込む必要はない。
sklearnに「offset(intercept:切片)相当のデータ」を計算時に含めるかどうかの「フラグ」を与えれば裏で勝手に計算してくれる。
【3】サンプルデータを入力側と出力側に分離する
■入力データ側
my_matA = df_sample_data[["power","height","weight"]].to_numpy()
my_matA
【ここまでの実行結果例】
array([[ 28, 146, 34],
[ 46, 169, 57],
[ 39, 160, 48],
[ 25, 156, 38],
[ 34, 161, 47],
[ 29, 168, 50],
[ 38, 154, 54],
[ 23, 153, 40],
[ 42, 160, 62],
[ 27, 152, 39],
[ 35, 155, 46],
[ 39, 154, 54],
[ 38, 157, 57],
[ 32, 162, 53],
[ 25, 142, 32]])
# 形状確認
my_matA.shape
【ここまでの実行結果例】
(15, 3)
■出力データ側
my_matB = df_sample_data["distance"].to_numpy()
my_matB
【ここまでの実行結果例】
array([22, 36, 24, 22, 27, 29, 26, 23, 31, 24, 23, 27, 31, 25, 23])
# 形状確認
my_matB.shape
【ここまでの実行結果例】
(15,)
【4】LinearRegressionオブジェクトを作成
「sklearn」では一般的な「最小二乗法」での「線形回帰用オブジェクト」として「LinearRegressionオブジェクト」が用意されている。
from sklearn.linear_model import LinearRegression


#my_object = LinearRegression(fit_intercept = False)#切片なしの場合は明示的に設定する
my_object = LinearRegression()▲コメントアウト部分のように、「切片:intercept」を「考慮する/しない」の「フラグ」が実はある。デフォルトは「fit_intercept=True」なので明示的な記載はせず省略している。
【5】サンプルデータを使ってフィッティング(最適化)
model = my_object.fit(my_matA, my_matB)【6】結果の確認
■決定係数の確認
「求めた回帰方程式(モデル)」の「あてはまりの良さ」の尺度。「1」に近いほど相対的な残差が少ないことを示す。
model.score(my_matA, my_matB)【ここまでの実行結果例】
0.6913489585945568
■「重み係数:coef」と「切片:intercept」の確認
# 係数の確認
print(model.coef_)

# 切片の確認
print(model.intercept_)
【ここまでの実行結果例】
array([0.20137689, 0.17102457, 0.12494278])
-13.217298316378507
つまり、以下のような近似式が見積もられたということ。

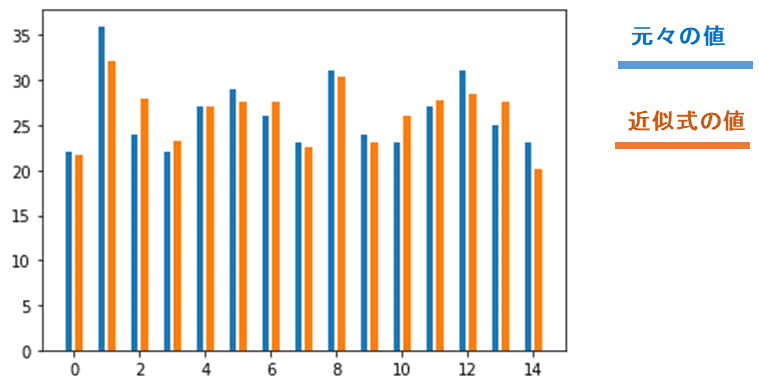
※matplotlibで誤差の可視化
pred = model.predict(my_matA)
print(pred)

%matplotlib inline
import matplotlib.pyplot as plt
import numpy as np

fig, ax = plt.subplots()

axis_x = np.arange(len(df_sample_data))

ax.bar(x=axis_x-0.15,height=df_sample_data["distance"],width=0.2)
ax.bar(x=axis_x+0.15,height=pred,width=0.2)
【実行結果例】
[21.63889629
32.07092924
27.9975849
23.24478244
27.03678226
27.60189815
27.51971724
22.5788405
30.35091442
23.0883807
26.08706895
27.72109413
28.40761928
27.55470971
20.10078179]

▲サンプルデータを近似式に入れた結果がオレンジ色の方。
元々の値(青色)と比べても「当たらずと雖も遠からず(あたらずといえどもとおからず)な近似式」ができているのがわかる
【7】全体コード
最後に全体コードを示しておく。
・実行環境:Google Colab
■インストールなど(colabの場合不要)
!pip install scikit-learn
!pip install -U scikit-learn
■全体コード
import sklearn

print(sklearn.__version__)


from sklearn.linear_model import LinearRegression
import pandas as pd

# サンプルデータ
dict_sample_data = dict(
    distance = [22, 36, 24, 22, 27, 29, 26, 23, 31, 24, 23, 27, 31, 25, 23],
    power = [28, 46, 39, 25, 34, 29, 38, 23, 42, 27, 35, 39, 38, 32, 25],
    height =[146, 169, 160, 156, 161, 168, 154, 153, 160, 152, 155, 154, 157, 162, 142],
    weight =[34, 57, 48, 38, 47, 50, 54, 40, 62, 39, 46, 54, 57, 53, 32]
)
df_sample_data = pd.DataFrame.from_dict(dict_sample_data)
#df_sample_data


# 入力データ側
my_matA = df_sample_data[["power","height","weight"]].to_numpy()
print(my_matA)

# 形状確認
print(my_matA.shape)


# 出力データ側
my_matB = df_sample_data["distance"].to_numpy()
print(my_matB)

# 形状確認
print(my_matB.shape)


# LinearRegresionオブジェクトの生成
#my_object = LinearRegression(fit_intercept = False)#切片なしの場合は明示的に設定する必要がある
my_object = LinearRegression()


# フィッティング(最適化)
model = my_object.fit(my_matA, my_matB)
#print(model)


## 結果の確認 ##
print(model.score(my_matA, my_matB)) # 決定係数
print(model.coef_) # 係数
print(model.intercept_) # 切片
【実行結果例】
1.0.2
[[ 28 146 34]
[ 46 169 57]
[ 39 160 48]
[ 25 156 38]
[ 34 161 47]
[ 29 168 50]
[ 38 154 54]
[ 23 153 40]
[ 42 160 62]
[ 27 152 39]
[ 35 155 46]
[ 39 154 54]
[ 38 157 57]
[ 32 162 53]
[ 25 142 32]]
(15, 3)
[22 36 24 22 27 29 26 23 31 24 23 27 31 25 23]
(15,)
0.6913489585945568
[0.20137689 0.17102457 0.12494278]
-13.217298316378507
■matplotlib可視化
pred = model.predict(my_matA)
print(pred)

%matplotlib inline
import matplotlib.pyplot as plt
import numpy as np

fig, ax = plt.subplots()

axis_x = np.arange(len(df_sample_data))

ax.bar(x=axis_x-0.15,height=df_sample_data["distance"],width=0.2)
ax.bar(x=axis_x+0.15,height=pred,width=0.2)
【実行結果例】
[21.63889629
32.07092924
27.9975849
23.24478244
27.03678226
27.60189815
27.51971724
22.5788405
30.35091442
23.0883807
26.08706895
27.72109413
28.40761928
27.55470971
20.10078179]

【まとめ】:sklearnが持つアルゴリズムについて
今回は、「最小二乗法:Ordinary Least Squares」を使った「線形回帰(重回帰分析)」を「scikit-learn(sklearn)」で行った。
このほか、「線形回帰(単回帰/重回帰分析)」だけでも、「sklearn」にはたくさんの「アルゴリズム」があり、様々に「工夫された数式」が「目的関数」として設定される。
例えば、
・Ridge回帰(L2正則)
・Lasso回帰(L1正則)
・ElasticNet(L2とL1のMixみたいなもの)
・SVR(サポートベクター回帰)
・・・などなど
...とにかく豊富にある。詳しくは以下を参照。
※ざっとまとめてあるのだが、正確に理解したい・詳しく知りたい・学びたい、といった場合は情報系、理・工学系の大学の講義や専門書などを見聞きした方がいい。
(例えば、設定した数式について、「どのパラメータ値が、何の役割を持っていて、その値を変更すると、どの部分にどれくらい影響与えるのか、最終的な結果にどれくらい波及するのか」、といった数字感覚は専門的な学びが必要になってくる)
なお、どのアルゴリズムを採用するかは、その時の状況次第である。
高精度な見積もり結果が出力されるからといって、複雑で高難度なアルゴリズムを無条件に選んではいけない。
「見積もり精度の高さ」「メモリ消費量」「計算負荷」「実行速度」、さらには「仮定している近似式の複雑さ」や「どんなアプリに使うのか」等々、実行する環境を踏まえて、採用するアルゴリズムを選ぼう。
【おまけ】:「LinearRegression」は「scipyの関数のwrapper関数」として実装されている
公式ドキュメントによると、
『LinearRegressionは「scipy.linalg.lstsq」や「scipy.optimize.nnls」の「wrapper関数」として実装している』
と記載している。
つまり、「sklearn」の「LinearRegression()」の実態としては「scipy」をコールしている、ということである。
そこで「scipy」自体を使った方法をざっとまとめていきたいが、、、
...記事が長くなったので「scipyを使った書き方」はあらためて別記事にする予定。
いいなと思ったら応援しよう!

