
フットボール統計学 ポゼッションを評価する指標xPG

QUANTIFYING SUCCESSFUL POSSESSION (xPG) /JULY 11, 2018 BY CHEUK HEI HO — American Soccer Analysis
Expected Goals (xG) have become one of the essential tools in soccer analytics. It offers more insight than any model which uses raw shot numbers. xG uses location date to help differentiate the quality of shots that traditional methods fail to take into account. xG-based variants such as Expected Assists (xA) attempts to extend xG beyond the primary shooter to a passer or anyone who has contributed to the passing sequence leading to a shot. They aim to broaden the impact of xG.
xGはフットボール分析の重要なツールの1つになっている。 それは生のシュート本数を使用するどのモデルよりも多くの洞察を提供する。 xGでは、位置座標を使用して、従来の方法では考慮しなかったシュートの質を区別する。 xAなどのxGベースの変種は、xGを主要なシュートを放つ選手を越えてパスを出す選手またはシュートにつながるパス連鎖に貢献した選手にまで拡張しようとする。 それらはxGの影響を拡大することを目指す。
But most xG-based methods still suffer one flaw: it describes a small portion of a soccer game. The typical soccer game in MLS averages about 15-20 shots per match. Organizing the game into possessions, sequences of uninterrupted – or if interrupted, the interruption lasts fewer than two seconds – action events (pass, dribble, shot…etc.), we will summarize the game into about 140 possession groups per game. Because most possessions can only create one shot every time, any xG-based method will overlook close to 90% of the possessions that don’t result in any shot. Therefore, any similar approach doesn’t provide a complete description of the game.
しかし、ほとんどのxGベースの方法はまだ1つの欠点を抱えている。それはフットボールの試合の小さな部分を記述する。 MLSの典型的なフットボールの試合は、1試合につき平均約15-20本のシュートを放つ。 試合をポゼッションに選別すると、アクションイベント(パスやドリブル、シュート等)の中断されない連鎖(中断の場合中断が2秒以下で終わる)で、試合ごとに約140のポゼッション連鎖に試合を要約できる。 ほとんどのポゼッションは毎回1つのシュートしか作成できないため、xGベースの方法では、シュートにならないポゼッションの90%近くが見過ごされる。 したがって、同様のアプローチではゲームの完全な説明が得られない。
We need a method that isn’t dependent on shot creation. Some elements of soccer don’t present a clear and direct interaction with the shot, such as the tactical or the formational change. You can use the location of the players to decipher the shape of a team, but how do you measure the efficiency and the individual contribution of each position? To this end, we developed an xG-based score – Expected Possession Goal (xPG) – that is dependent on the location of the ball but not the shots creation.
シュート作成に依存しない方法が必要である。 フットボールのいくつかの要素は、戦術的またはフォーメーション的な変化など、シュートとの明確で直接的な相互作用を提示しない。選手の位置を使用してチームの形状を解読することができるが、各ポジションの効率と個々の貢献度をどのように測定するか。この目的のために、ボールの位置に依存するが、シュートの作成には依存しない、xGベースの指標xPGを開発した。
Most possessions aim to move the ball within a shooting distance so that the player can score. xPG measures how a team uses its possession to achieve that goal. I first divide a soccer pitch into 162 zones. Each zone is assigned a zonal xG value by averaging all the shot xG values from the same zone from 2015 to 2018. I then group every match into the possession groups. Every action event, whether it is the shot or not, is given a zonal xG value based on which one of the 162 zones that it takes place. I summate all the zonal xG values within a possession to establish the xPG value for that possession. Any possession that reaches the shooting location, even if it doesn’t result in the shot, will have an xPG value. Every player will be given the same xPG if he has contributed to that possession.
ほとんどのポゼッションは、ボールを射撃距離内に移動させて、選手が得点することを目指す。xPGは、チームがその目標を達成するためにポゼッションをどのように使用するかを測定する。最初にフットボールピッチを162のゾーンに分ける。各ゾーンには、2015年から2018年までの同じゾーンのシュートxG値をすべて平均化することによってゾーンxG値が割り当てられる。次に、すべての試合をポゼッション連鎖にグループ分けする。シュートであろうとなかろうと、あらゆるアクションイベントには、それが起こる162のゾーンに基づいて、ゾーンxG値が与えられる。そのポゼッションのxPG値を確立するために、ポゼッションでのすべてのゾーンxG値を集計する。 射撃位置に到達したポゼッションはシュートに至らなくてもxPG値を持つ。そのポゼッションに貢献した場合、すべての選手に同じxPGが与えられる。
In short, we group the game into the possessions, assign a value for each possession based on how successful it is, add them up and that value becomes the total xPG. Each player gets a share of the total xPG based on how many of those possessions he has contributed.
要するに、試合をポゼッションにグループ化し、成功の度合いに基づいて各ポゼッションの価値を割り当て、それらを加算し、その価値が合計xPGになる。各選手は、貢献したポゼッションの数に基づいて、合計xPGのシェアを獲得する。
xPG measures how successfully the team and its players complete the possession.
xPGは、チームとその選手がどれだけ上手くポゼッションをしたか測定する。
We can use xPG to measure how different positions support the completion of possessions. I divide the players into six broad positions in this analysis:
xPGを使用して、さまざまなポジションがポゼッションの完了をどのようにサポートしているかを測定できる。この分析では、選手を6つの広いポジションに分けている。
1. Attacking central midfielder: an advanced central midfielder behind the forwards.
2. Central midfielder: any central midfielder except for the attacking central midfielder.
3. CB / center back: any central defender.
4. Forward: a lone striker or a forward in a two-striker’s formation.
5. Full back / Wing back: an outside defender on the flank or a wing back (an advanced full back) in a 3-5-2.
6. Wide attacker: a winger in a 4-4-2 or a 4-2-3-1, or an outside forward in a 4-3-3.
1. ACM:FWの背後にいる前方のセンターMF。
2. CM:ACMFを除くセンターMF。
3. CB:センターDF。
4. FW:1トップもしくは2トップの一角。
5. FB/WB:サイドDFもしくは3-5-2のウイングバック(前方のサイドDF)。
6. WG:4-4-2または4-2-3-1のサイドMF、または4-3-3のWG。
I exclude the keeper from this analysis. I have also isolated the attacking central midfielder since it has undergone numerous changes over the last decade. Its function has specialized and diversified in different systems.
この分析からGKを除外する。また、過去10年間に数多くの変化を遂げており、ACMを孤立させた。その機能は、異なるシステムで特殊化され、多様化している。
I first characterize how each player or position and xPG interact in MLS this season. I assign two xPG measures, xPG contribution and xPG per minute for every player who has started for more than three games this season. xPG contribution is a relative measure to estimate the player’s contribution of the team’s completed possessions. It is calculated by dividing the player’s xPG over the team’s xPG for the time span the player has participated in the game. xPG per minute is an absolute measure by normalizing the player’s xPG with the minutes he has spent on the pitch in each game.
まず、今シーズンに各選手やポジションとxPGがどのようにMLSで対応するのかを特徴づける。今シーズン3試合以上でスタートしたすべての選手に対して、2つのxPG測定値、xPG貢献度とxPG毎分を割り当てる。xPG貢献度は、チームの完了したポゼッションでの選手の貢献度を推定する相対的な尺度である。選手のxPGをチームのxPGで割って、選手が試合に参加した時間で計算する。 xPG毎分は、各試合のピッチに費やした分で選手のxPGを正規化することによる絶対的な尺度である。
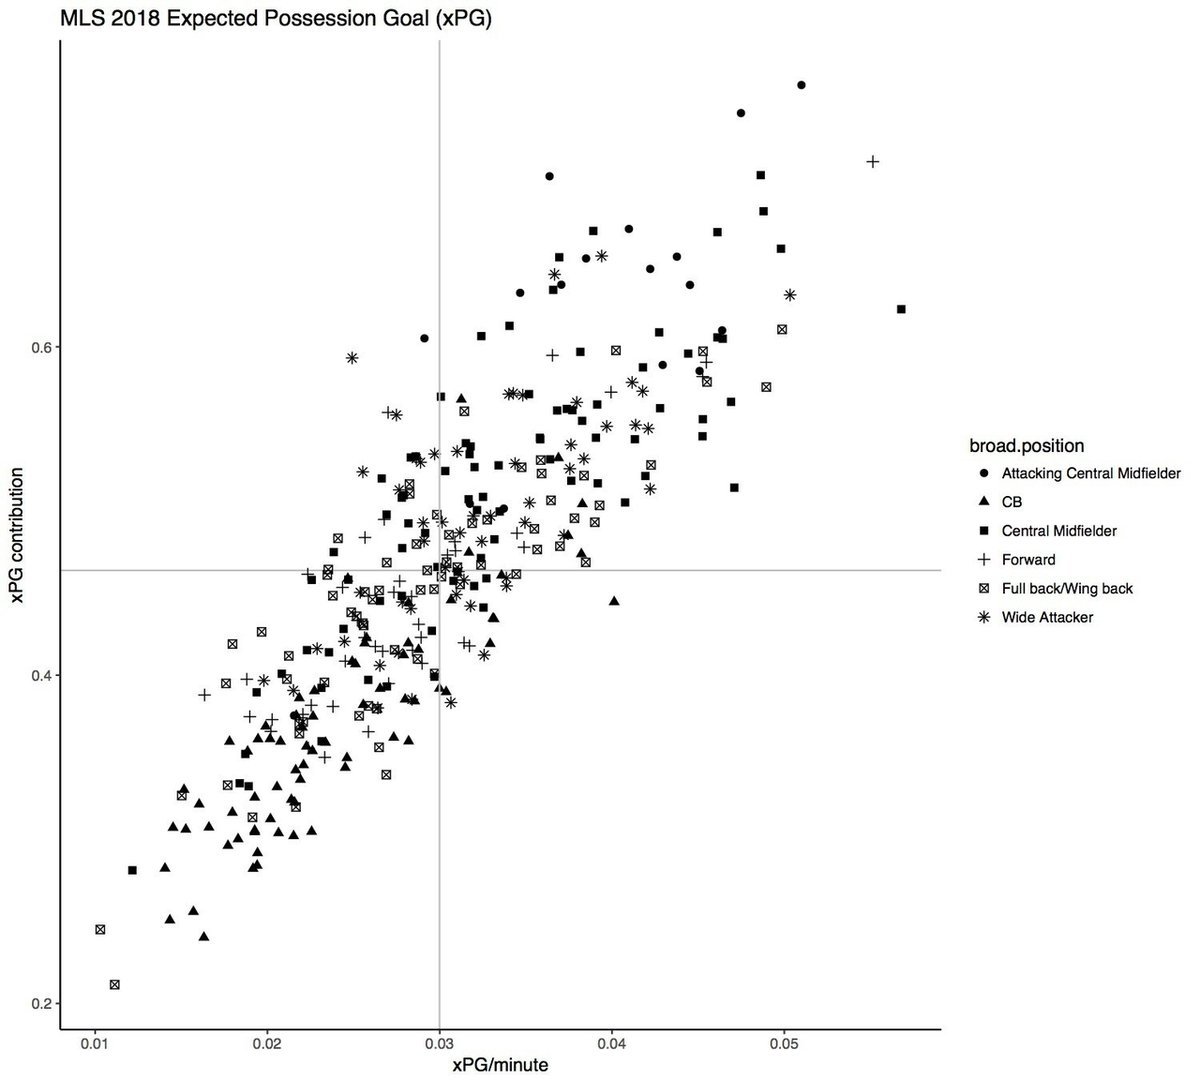
A summary plot of xPG contribution and xPG/minute. xPG contribution is a relative measure to estimate the player’s contribution of the team’s completed possessions. It is calculated by dividing the player’s xPG over the team’s xPG for the time span the player has participated in the game. xPG per minute is an absolute measure by normalizing the player’s xPG with the minutes he has spent on the pitch in each game. The correlation coefficient between xPG contribution and xPG is 0.85. Data accumulated until week 18 is used.
xPG貢献度とxPG毎分の要約プロット。 xPG貢献度は、チームの完了したポゼッションの選手の貢献度を推定する相対的な尺度である。選手のxPGをチームのxPGで割って、選手が試合に参加した時間で計算する。xPG毎分は、各試合のピッチに費やした分で選手のxPGを正規化することによる絶対的な尺度である。xPG貢献度とxPGとの間の相関係数は0.85である。第18週まで蓄積されたデータが使用される。
The attacking central midfielder has the highest xPG contribution, followed by the central midfielder, the wide attacker and the full back/wing back. The center back has the lowest successful possession contribution. Strikingly, most forwards have the lowest relative or absolute xPG. Why? If he is the most spatially advanced player, shouldn’t he also be the closest to the shooting distance where xPG tries to quantify, hence with a higher xPG? If we think about the problem more carefully, the forward’s low xPG is consistent with a principle of the game; the forward is the most capable player to convert the shot to the goal. A defending team should do everything it can to deter him from touching the ball at the shooting distance. Therefore, the forward should have low xPG; otherwise, you would be seeing a lot more goals in soccer.
ACMはxPG貢献度が最も高く、CM、WG、FB/WBが続く。CBは最も低いポゼッションの貢献度である。 驚くべきことに、ほとんどのFWは相対的または絶対的xPGが最も低い。なぜか。もし最も空間的に高度な選手であれば、xPGが定量化しようとする射撃距離に最も近くなるはずなので、より高いxPGではないか。問題をより慎重に考えると、FWの低いxPGは試合の原則と一致する。FWはシュートをゴールに変換する最も能力の高い選手である。守備側は、射撃距離でボールに触れることを防ぐためにできる限りのことをしなければならない。したがって、FWは低いxPGを持つ必要がある。さもなければ、フットボールでもっと多くの得点を見ているだろう。
xPG DETECTS TACTICAL DIFFERENCES BETWEEN DIFFERENT TEAMS
xPGはさまざまなチーム間の戦術的な差異を検出する
With a general idea of how different positions contribute to xPG league-wise, we can now examine how each role functions in different teams:
さまざまなポジションがリーグでどのようにxPGに貢献しているかという一般的な考え方から、各チームの各役割がどのように機能するかを調べられる。

A summary of xPG contribution by the position for every team in MLS 2018. Only the positions which has been played more than five times this season is used.
MLS 2018の各チームのポジション別xPG貢献度の要約。今シーズンの5回以上のプレーを果たしたポジションのみが使用される。
This plot summarizes the xPG contribution of every position that has played more than five times for each team this season. Every team has a unique order of the xPG contributions from various positions, because of using different formations with a distinct tactics. Moreover, every team has a different pattern of how the xPG spreads over various positions. We can summarize the distributions of xPG with some simple parameters:
このプロットは、今シーズンの各チームで5回以上プレーした各ポジションのxPGの貢献をまとめたものである。それぞれのチームは、明確な戦術を持つ異なるフォーメーションを使用するため、さまざまなポジションからのxPG貢献の独自の順序を持っている。さらに、各チームは、xPGがさまざまなポジションにどのように広がっているかについて異なるパターンを持っている。 いくつかの簡単なパラメータを使ってxPGの分布を要約できる。
A scatterplot of the xPG contribution parameters for every team in MLS 2018. The mean and the median aim to seek the most representative xPG value for the team. The range measures the maximal difference while the standard deviation quantifies every difference between each position. Grey lines depict the average values of the two parameters on x- and y- axis.
MLS 2018の各チームのxPG貢献度パラメータの散布図。平均と中央値は、チームにとって最も代表的なxPG値を求めることを目指す。 範囲は最大差を測定し、標準偏差は各ポジション間の差を定量化する。 灰色の線は、x軸およびy軸上の2つのパラメータの平均値を示す。
The mean and the median aim to seek the most representative xPG value for the team. The median is more stable than the mean when dealing with extreme values such as those of FC Dallas. Bear in mind that the xPG contribution is a relative measure; a small value means a particular position(s) contributes a small fraction, not a small absolute amount, of the successful possessions.
平均値と中央値は、チームにとって最も代表的なxPG値を求めることを目的としている。中央値は、FCダラスのような極端な値を扱うときに平均よりも安定している。xPG貢献度は相対的な尺度であることに留意する。小さい値は、特定のポジションが、成功したポゼッションのうちの小さな絶対量ではなく、小さな割合に寄与することを意味する。
For examples, teams like New York Red Bulls and New England Revolution have two of the lowest median xPG contribution values in MLS, meaning that most positions in these teams contribute small fractions of the successful possessions. Their highest contributor, the attacking central midfielder, provides only about 50% of their successful possessions. If every position only contributes a small fraction, they must show little overlap, meaning that there is little cooperation between different positions when these teams attack: for instance, the central midfielder doesn’t always combine with the wide attacker, or the full back rarely connects the forwards.
例えば、ニューヨーク・レッドブルズやニューイングランド・レボリューションなどのチームでは、MLSの中で最も低いxPG貢献度値を持っており、これらのチームのほとんどのポジションが成功したポゼッションの小さな部分に貢献していることを意味する。最も高い貢献者であるACMは、成功したポゼッションの約50%しか提供していない。すべてのポジションがわずかな割合しか貢献していない場合は、オーバーラップがほとんどなく、つまりこれらのチームが攻撃するときに、異なるポジション間での協力関係はほとんどない。例えば、CMは常にWGと組み合わされるとは限らず、FBがFWと結びつくことはめったにない。
The style of these teams is consistent with their overall small xPGs; Red Bull New York and New England play a direct and chaotic brand of soccer. They don’t rely on the possession control. They want to play at a fast pace. If you're going to play fast, you can’t have every player touching the ball in every possession. You want to limit every possession into a handful of touches so that the ball can reach the shooting distance as quickly as possible.
これらのチームのスタイルは、全体の小さなxPGと一貫している。ニューヨークRBやニューイングランドは、直接的でカオス的なフットボールをプレーする。彼らはポゼッションコントロールに頼っていない。彼らは速いペースでプレーしたい。速くプレーしようとしている場合は、すべての選手がすべてのポゼッションでボールに触れるようにすることはできない。ボールができるだけ早く射撃距離に達することができるように、すべてのポゼッションを一握りのタッチに制限したい。
The range measures the maximal difference while the standard deviation quantifies every difference between each position. Therefore, both values estimate how specialized the positions have evolved to help complete successful possessions. The range is easier to understand because it shows how much a team tends to specialize one role in xPG. For example, while every attacking central midfielder leads the xPG contribution, teams like FC Dallas and Portland Timbers deploy it as the sole position to orchestrate the attack with talented play-makers like Mauro Diaz, Sebastián Blanco, and Diego Valeri.
範囲は最大差を測定し、標準偏差は各ポジション間の差を定量化する。したがって、両方の値は、ポジションがどのように特殊化されて成功したポゼッションを完成させるのに役立つかを推定する。この範囲は、どれだけチームがxPGで1つの役割を専門化する傾向があることを示しているため、理解しやすくなる。例えば、すべてのACMがxPGの貢献をリードしているが、FCダラスやポートランド・ティンバーズなどのチームは、マウロ・ディーアス、セバスティアン・ブランコ、ディエゴ・バレリなどの才能のあるプレイメーカーを攻撃を統率する唯一の立場として展開する。
New York City is “a city of two tales” in xPG; New York Red Bulls and New York City FC have opposing styles regarding possession. In contrast to the furious and chaotic Red Bulls, New York City FC allocates many positions into the attack so that they can slowly build-up their offensive phase. However, they also have one designated offensive master in Maximiliano Moralez that is involved in close to 70% of the successful possessions while the Red Bull’s top offensive orchestrator, Alejandro “Kaku” Romero Gamarra doesn’t even hit half of their xPG.
ニューヨーク市はxPGの「2つの話の街」である。ニューヨークRBとニューヨークシティは、ポゼッションに関して反対のスタイルを持っている。猛烈で混沌としたRBとは対照的に、シティは攻撃に多くのポジションを割り当て、攻撃局面でゆっくりとビルドアップする。しかし、マキシミリアーノ・モラレスという特定の攻撃的マスターがいて、70%近くのポゼッションに関与しているが、RBのトップ攻撃的指揮者アレハンドロ・ロメロはxPGの半分にも達していない。
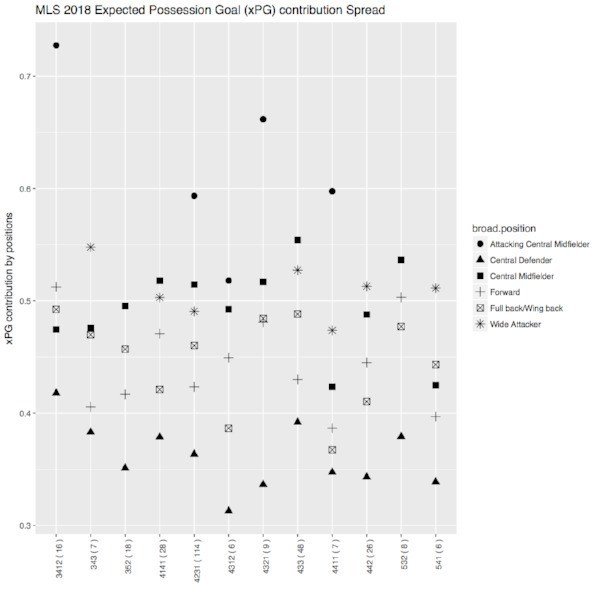
While the attacking central midfielder and the central midfielder are the dominant positions in the successful possession for 18 MLS teams this season, five teams use the forward, the wide attacker, or the full back/wing back as their top xPG contributor. For example, Sporting Kansas City designates their full back/wing back as the primary offensive contributor. Breaking down the xPG contribution by the player level:
今シーズンMLSの18チームでACMとCMが支配的なポジションだが、5チームはFW、WGまたはFB/WBをxPGのトップ貢献者として使用している。例えば、スポルティング・カンザスシティは、主要な攻撃的貢献者としてFB/WBを指定する。選手レベルによるxPGの貢献を分割する。

A summary of xPG contribution by position for Kansas City 2018. Only player in each position plays at least two times this season is included.
カンザスシティ2018のポジション別のxPG貢献の要約。今シーズンそれぞれのポジションで2回以上プレーした選手のみ含まれる。
Graham Zusi and Jimmy Medranda are Kansas City’s top two xPG contributors followed by the central midfielders and then the wide attackers. They are the only team this season that puts so much offensive focus on their full back/wing back.
グラハム・ズシとジミー・メドランダは、カンザスシティのトップ2のxPG貢献者であり、CMとWGが続く。 今シーズンFB/WBに非常に集中的な焦点を置いている唯一のチームである。
L.A. Galaxy is one of the two teams that uses their forward as the top xPG contributor. They use a 4-2-3-1 as the primary formation. Interestingly, other teams that use the 4-2-3-1 as the default shape, such as Columbus Crew and Minnesota United, usually deploy the central attacking midfielder as the crucial position in completing the possession. Comparing the xPG contribution by their player level:
ロサンゼルス・ギャラクシーは、xPG貢献度のトップとしてFWを使用する2チームの1つである。 彼らは主要なフォーメーションとして4-2-3-1を使用する。 興味深いことに、コロンバス・クルーやミネソタ・ユナイテッドFCなどのデフォルトとして4-2-3-1を使用する他のチームは、通常、ポゼッションを完了するための重要なポジションとしてACMを配置する。選手レベルによるxPG貢献度を比較する。
We find that L.A. Galaxy indeed use the attacking central midfielder as their top xPG contributor when they put Sebastian Lletget in that role. However, Lletget has only four starts in that positions and shares it with Romain Alessandrini, Jonathan dos Santos, and Giovani dos Santos. The most distinctive feature of the L.A.’s 4-2-3-1 is the xPG contribution by its star striker Zlatan Ibrahimovic; his xPG contribution is over 60%, at least 20% more than that of Columbus’ Gyasi Zardes or Minnesota United’s starter Christian Ramirez. Why? Zlatan is different from most strikers that he has excellent skill and can drop to the midfield and help to build up. In contrast, Zardes and Ramirez are typical strikers that focus on finishing the shot instead of building up the attack. The xPG data demonstrates those parts of their games.
LAギャラクシーはセバスチャン・レットゲットをACMに置くと、実際にxPGトップの貢献者として使用する。しかし、レットゲットはそのポジションでわずか4回のスタートで、ロマン・アレッサンドリーニ、ジョナタン・ドス・サントス、ジョバニ・ドス・サントスと分け合っている。 LAの4-2-3-1の最も顕著な特徴は、そのスターFWズラタン・イブラヒモビッチによるxPG貢献である。彼のxPG貢献度は60%以上で、コロンバスのギャシ・ザーデスまたはミネソタの先発クリスチャン・ラミレスより少なくとも20%多い。なぜか。スラタンはほとんどのFWとは違い優れたスキルを持ち、中盤に落ちてビルドアップを助けられる。対照的に、ザーデスとラミレスはビルドアップする代わりにシュートに焦点を当てた典型的なFWである。xPGデータは、試合のその部分を示す。
xPG DETECTS TACTICAL DIFFERENCES BETWEEN DIFFERENT FORMATIONS OF THE SAME TEAM
xPGは同じチームの異なるフォーメーション間の戦術的な違いを検出する
If we can compare two teams, we can also compare the change of xPG contribution between two lineups of the same team. Consider Chicago Fire’s formational changes:
2チームを比較できれば、同じチームの2つのラインアップのxPG貢献度の変化を比較できる。シカゴ・ファイアーのフォーメーションの変化を考えてみよう。

A summary of xPG contribution by position for Chicago Fire 2018. Only player in each position plays at least two times this season is included. Grey lines depict the changes of xPG contribution by each player in different formations.
シカゴ・ファイアー2018のポジションによるxPG貢献の概要。今シーズンそれぞれのポジションで2回以上プレーした選手のみを含む。灰色の線は、異なるフォーメーションにおける各選手のxPG貢献の変化を示す。
THE EVOLUTION OF POSITIONS AND FORMATIONS
ポジションとフォーメーションの進化
We can further develop the comparison of the xPG contributions across different formations ignoring the identity of the team so that we can examine how different positions evolve according to the formational change:
チームのアイデンティティを無視して、異なるフォーメーション間のxPG貢献度の比較をさらに進展させることができ、フォーメーションの変化に応じて異なるポジションがどのように変化するかを調べられる。
A summary of xPG contribution by the position for different formations in MLS 2018. Only the formation that has plays for more than five times this season is used.
MLS 2018の異なるフォーメーションのポジションによるxPG貢献の要約。今シーズン5回以上のプレーをしたフォーメーションのみが使用される。
This plot is similar to Fig.1, except that we separate the xPG contributions of the positions based on the 12 formations that have been used more than five times in MLS this season. Grouping the position based on the formation still preserves the trend we have seen; the attacking midfielder is the top xPG contributor while the wide attacker and the central midfielders are close behind it. The center back is again the lowest xPG contribution. But we also see some changes: the full back/the wing back and the forward are not the xPG priority in any formation, meaning that the role of Zusi or Ibrahimovic in Kansas City and L.A. must be player- and team- specific.
このプロットは図1と同様だが、今シーズンMLSで5回以上使用された12のフォーメーションを基にしたポジションのxPG貢献度に分けることを除く。 フォーメーションに基づいてポジションをグループ分けすることは、見てきた傾向を依然として維持する。 ACMはxPGトップの貢献者であり、WGとCMはその背後にいる。 CBはやはり最も低いxPG貢献度である。 しかし、いくつかの変更も見られる。FB/WBとFWは、いかなるフォーメーションにおいてもxPGで優先ではなく、カンザスシティとLAでのズシやイブラヒモビッチの役割は選手とチーム特有である。
The best way to test the accuracy of our method is to compare the result with a gold standard. Such a standard doesn't exist, so we need to find an alternative. We need to check whether our result is consistent with the similarity of the formations based on what we know about them. We can check if two similar formations have a similar order of the xPG contributions between different positions.
メソッドの精度をテストする最良の方法は、結果を金の標準と比較することである。そのような標準は存在しないので、代替手段を見つける必要がある。結果が、それらについて知っているものに基づいてフォーメーションの類似性と一貫しているかを確認する必要がある。 2つの類似したフォーメーションが、異なるポジション間のxPG貢献度の類似の秩序を有するかを調べられる。
Two formations, the 3-5-2, and the 5-3-2, closely resemble each other; they both use three center backs, three central midfielders, two forwards, and two wing backs. The only difference between them is the position of the wing backs: they stay closer to the center backs in the 5-3-2 than they do in the 3-5-2. Our xPG contribution ordering finds that the only difference between them is the order of the forward and the wing back: the wing back has a higher xPG contribution than the forward in the 3-5-2. This result makes sense, because the wing back has a more advanced position in the 3-5-2 than in the 5-3-2.
2つのフォーメーション3-5-2と5-3-2はお互いによく似ている。両方とも3バック、3センター、2トップおよび2WBを使用する。 両者の唯一の違いはWBの位置である。3-5-2の場合よりも、5-3-2ではDFに近い位置にいる。xPG貢献度では、それらの間の唯一の違いはFWとWBの順序である。WBは、3-5-2の時FWよりも高いxPG貢献度を持つ。この結果は理にかなっており、なぜならWBは5-3-2より3-5-2の方が高い位置にいるからである。
But we also have a discrepancy that the defensive 5-3-2 has a higher xPG contribution than that of the 3-5-2. Bear in mind the xPG contribution is a relative measure but not an absolute measure. The absolute measure of xPG, the xPG per minute, shows that both formations produce close to 10 xPG per 96 minutes (10.08 in the 3-5-2 vs. 9.89 xPG in the 5-3-2). xPG also only measures the offensive but not the defensive contribution, so the defensive strength of the formation may not show up in any xPG parameter. Therefore, our method can detect the subtle difference of the possession completion of various positions in similar formations.
しかしまた、守備的な5-3-2が3-5-2より高いxPG貢献度を有するという食い違いがある。xPG貢献度は相対的な尺度で絶対的な尺度ではないことに注意する。xPGの絶対的尺度であるxPG毎分は、両方のフォーメーションが96分あたり約10xPGになることを示す(3-5-2の10.08対5-3-2の9.89)。 xPGは攻撃だけを測定し、守備での貢献は測定しないので、xPGパラメータにはフォーメーションの守備力が現れないことがある。したがってこの方法は、類似のフォーメーションにおける様々なポジションのポゼッション完了の微妙な違いを検出できる。
The formations change according to the strategic shift and player development. A modern tactical trend is the specialization of the player’s role; we used to have three roles: the defender, the midfielder and the forward. Now we have the evolution of the wing back from the full back, or the split of the midfielder into the defensive and attacking one. The same movement has repeated in MLS; ten years ago every team played a primary 4-4-2 formation. This season, more than a dozen formations have been deployed. Almost every 4-4-2 variant such as 4-4-1-1 and the 4-2-3-1 have been used more than five times. The introduction of the attacking central midfielder changes how the 4-4-2 variants attack, as shown by the increased range and standard deviation of 4-4-1-1 / 4-2-3-1 vs. 4-4-2:
フォーメーションは、戦略的変更と選手発達に応じて変化する。 現代の戦術的傾向は、選手の役割の特殊化である。かつてDF、MF、FWの3つの役割を担っていた。 今やFBからWBの進化、またMFの守備的と攻撃的への分裂を持っている。MLSでも同じ動きが繰り返される。10年前、すべてのチームが4-4-2チームを編成した。今シーズンは、十数種類のフォーメーションが展開される。4-4-1-1や4-2-3-1のような4-4-2の変形のほとんどが5回以上使用される。ACMの導入により、4-4-2の変形がどのように攻撃されるかが変わる。

A summary of xPG contribution by the position for different formations in MLS 2018. Only the formation that has plays for more than five times this season is used.
MLS 2018の異なるフォーメーションのポジションによるxPG貢献の要約。今シーズン5回以上プレーしているフォーメーションのみが使用される。
A scatterplot of the xPG per 96 minutes and xPG contribution for every qualified formation in MLS 2018. Grey lines depict the average values of the two parameters on x- and y- axis.
MLS 2018でのxPG毎96分とxPG貢献度の散布図。灰色の線は、x軸およびy軸上の2つのパラメータの平均値を示す。
For example, a 4-3-1-2 uses the attacking central midfielder but its xPG / 96 minutes, an absolute measure of the offensive performance, is lower than the average of all of the qualified formations. Comparing to other formation featuring the attacking central midfielder, the 4-3-1-2 does not support its attack with the wing back or the wide attacker. The lack of width in attack is a trade-off of the 4-3-1-2; it is another 4-4-2’s variant with the wide-midfielders shifting toward the center to bolster the control of the middle area. These midfielders take on the #8 box-to-box role to strength both the offensive and the defensive phases. The full back has to carry the offensive load on the flank. The failure to boost its offensive contribution from this position may explain 4-3-1-2’s mediocre offensive output: the withdrawn position of the full back compared to that of the wing back may increase the physical burden for the former and prevents it from engaging in the attack.
例えば、4-3-1-2はACMを使用するが、攻撃的なパフォーマンスの絶対的な指標であるxPG毎96分は、全フォーメーションの平均よりも低くなっている。ACMを特徴とする他のフォーメーションと比較して、4-3-1-2はWBまたはWGによる攻撃をサポートしない。攻撃の幅の欠如は、4-3-1-2のトレードオフである。 中央のコントロールを強化するためにWGが内側に向かって移動する4-4-2の別の変形である。これらのMFは、8番のボックストゥーボックスの役割を果たし、攻撃と守備の両局面を強化する。FBは、サイドで攻撃的な負担を負わなければならない。このポジションからの攻撃的な貢献を高めないと、4-3-1-2の攻撃的なアウトプットが平凡になる。FBの低い位置はWBと比較して、前者の物理的負担を増加させ、それが攻撃に従事するのを妨げる可能性がある。
Nevertheless, a designation of the attacking central midfielder benefits the offensive performance of most formations. It also explains Atlanta United’s formation’s choice; the strength of the 3-5-2 is its focus in the center. A total of six players position in the middle of the first two lines. Although this arrangement promotes the control of the possession, its xPG output is low. By deploying Miguel Almiron as a specific offensive orchestrator in a 3-4-1-2, Gerardo Martino achieves an outstanding offensive prowess while retaining the advantage of the 3-5-2.
それにもかかわらず、ACMの指定は、ほとんどのフォーメーションの攻撃的なパフォーマンスに利益をもたらす。また、アトランタ・ユナイテッドのフォーメーションの選択についても説明する。3-5-2の強さは中央にある。2、3列目の中央には合計6人の選手が位置する。このフォーメーションはポゼッションの制御を促進するが、そのxPG出力は低い。3-4-1-2でミゲル・アルミロンを特定の攻撃の指揮者として配備することにより、指揮官ヘラルド・マルティーノは3-5-2の優位性を維持しながらも優れた攻撃力を発揮する。
THE LIMITATIONS OF xPG
xPGの限界
Because xPG measures how successfully the team and its players complete the possession, we can use it to determine how the role of individual position evolves in different formations. But it has its limitations. For example, it does not attempt to measure how effectively a team can convert the successful possession into the shot or the goal. We need to connect xPG with any or all of the xG variants. At this stage, xPG doesn’t provide a complete description of the game.
xPGは、チームとその選手がどれだけ上手くポゼッションを完了したかを測定するため、個々のポジションの役割がどのように異なるフォーメーションで進化するかを判断するために使用できる。しかし、それには限界がある。例えば、チームがポゼッションをシュートやゴールにどれくらい効果的に変換するかを測定することはできない。xPGを、xGの変形のいずれかまたはすべてに接続する必要がある。この段階で、xPGは試合の完全な説明を提供しない。
But no one single measure does; think about a final score of the game. It summarizes the outcome of the match with two numbers but discards the spatial, the temporal, or the individual player’s information. xG or its variants ignore any event that doesn’t lead to a shot, or the pass map/network collapses the spatial data into a dozen of spots by multiple orders. The only summary that retains all the data of the game is the game itself. Between the game and the score, many different summaries should be available so we can organize and analyze the game to approach the complete description.
しかし、どんな指標もそうではない。試合の最終スコアについて考える。それは、2つの数字で試合の結果を要約するが、空間的、時間的または個々の選手の情報を捨てる。xGまたはその変形では、シュートにつながらないイベントは無視されるか、パスマップは空間データを複数の秩序で十数のスポットに集約する。試合のすべてのデータを保持する唯一の要約は、試合自体である。試合とスコアの間には、さまざまな要約が用意されているので、完全な説明にアプローチするためにゲームを整理し分析できる。
ここから先は
¥ 100
Amazonギフトカード5,000円分が当たる
この記事が参加している募集
#フットボール統計学