
フットボール統計学 xPGの価値と他の指標との比較

EXPECTED POSSESSION GOALS: THE VALUE OF A POSSESSION AND COMPARING xPG TO OTHER METRICS /JULY 11, 2018 BY JAMON MOORE — American Soccer Analysis
THE HOW AND WHY OF EXPECTED POSSESSION GOALS (xPG)
xPGの方法と理由
It is probably easier to identify good possession by sight rather than a textbook definition: decisive movement and accurate passing lead to good looks, so I’ve been very interested in whether a metric like xG could quantify the value of a possession. If you have not already read it, please begin with Cheuk Hei’s xPG article (QUANTIFYING SUCCESSFUL POSSESSION (XPG) /JULY 11, 2018 BY CHEUK HEI HO). Expected Possession Goals (xPG) attempts to create a more holistic view of a soccer match by focusing on possessions rather than just shots. Possessions occur at about a 10-to-1 ratio to shots, so they can provide 10x the data for analyzing the flow of a game. Take into account just the average number of passes in a possession, and you get around 3x more data.
おそらく、教科書の定義ではなく視覚的に良いポゼッションを識別する方が簡単である。決定的な動きと正確なパスは見栄えに繋がり、そしてxGのような指標がポゼッションの価値を数値化できるかに非常に関心がある。まだ読んでいない場合は、Cheuk Hei氏のxPG記事(フットボール統計学 ポゼッションを評価する指標xPG)から始めてほしい。xPGは単にシュートではなくポゼッションに焦点を当てて、フットボールの試合をより包括的に表示しようとする。ポゼッションはシュートに対して約10対1の比率で発生するので、試合の流れを分析するために10倍のデータを提供できる。ポゼッションのパスの平均数を考慮に入れると、さらに3倍のデータが得られる。
For xPG, xG values are assigned using the 18 zones of the soccer pitch and adding 9 sub-zones in each for a total of 162 sub-zones.
xPGの場合、フットボールピッチの18ゾーンを使用してxG値が割り当てられ、それぞれに9つのサブゾーンが追加され、合計162のサブゾーンが作成される。
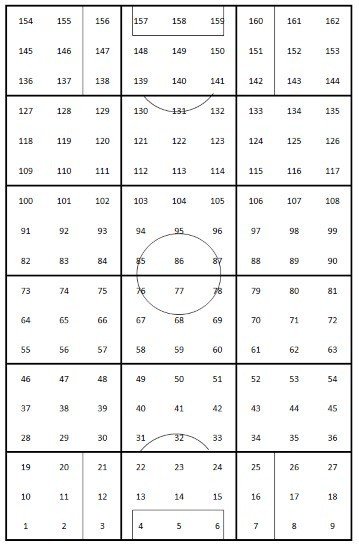
The attacking direction is from bottom to top. The average shot xG in any of those sub-zones is used whenever a successful action such as a pass, dribble or shot is completed. By adding up the xG of these successful actions, the possession xG (xPG value) is arrived at. Each player who contributes to possession with a successful action receives the xG of their action based on which of the 162 sub-zones the action took place. Many zones have no xG, and this is fine because if you just knock the ball around the back, you should get nothing. xG only starts to appear as ball gets closer to the goal. There are two elements of xPG, which is a player’s contribution to the team’s xPG and the average xPG per min a player generates when he is on the pitch.
攻撃方向は下から上である。 これらのサブゾーンの平均シュートxGは、パス、ドリブルまたはシュートなどの成功したアクションが完了するたびに使用される。これらの成功したアクションのxGを合計することによって、xPG値が到着する。成功したアクションでポゼッションに貢献した各選手は、アクションが行われた162のサブゾーンに基づいてアクションのxGを受け取る。多くのゾーンにはxGがなく、これはボールを後ろに叩くだけで何も得られないため問題ない。ボールがゴールに近づくとxGが表示され始める。xPGの2つの要素があり、これは、チームのxPGへの選手の貢献度と、選手がピッチ上にいるときに生成する平均xPG毎分である。
In general, here are the steps to calculate xPG:
1. Find all the possessions in a match.
2. For each successful action in a possession, such as a pass, dribble or shot, calculate the xG based on the action coordinates, as if a shot had occurred.
3. Assign the xG value to both the player performing the action and their team total for the match.
4. Note actual minutes played for each player, including substitutions on and off.
5. Calculate player possession xG contribution for the minutes they were on the pitch and divide their total possession xG created by their minutes played. Multiply by 96 to get xPG/96.
We’ll take a closer look at xG values for the 162 zones a little later.
一般に、xPGを計算するステップは次のとおりである。
1. 試合中のすべてのポゼッションを見つける。
2. パス、ドリブル、またはシュートなどのポゼッションの成功したアクションごとに、シュートが発生したかのように、アクション座標に基づいてxGを計算する。
3. アクションを実行している選手と試合のチーム合計にxG値を割り当てる。
4. 交代を含む、各選手の実際の出場時間を記す。
5. 出場した分の選手のxPG貢献度を計算し、合計xPGを出場分で割る。xPG毎96分を得るために96を掛ける。
162ゾーンのxG値をもう少し詳しく見ていく。
HOW DOES xPG COMPARE WITH OTHER xG-BASED METRICS?
xPGは他のxGベースの指標とどのように比較するか
It is best to understand xPG as a conceptual metric which provides more even distribution of xG across a team, including better coverage for defensive players, if not yet goalkeepers.
xPGはGKではないにしても、DFのカバー向上など、チーム全体でのxGの均等配分を提供する概念的指標として理解することが最善である。
Expected Possession Goals (xPG) is the result of numerous discussions with and labor from Cheuk Hei, and he graciously provided me with his results for my own analysis. Ever since Cheuk Hei and I wrote about MLS defenses and pressure (see WHERE THE BALL WAS WON: USING PASSING DATA AS AN INDICATOR OF DEFENSIVE PRESSURE POINTS /JUNE 6, 2018 BY JAMON MOORE and PRESSING, DEFENSIVE LINES, AND WHAT DEFENSIVE ACTIONS CORRELATE WITH GOALS /JUNE 20, 2018 BY CHEUK HEI HO), the pursuit has been on for a metric which could address the question: what is the value of a possession within a match?
xPGはCheuk Hei氏との数多くの議論と労働の結果であり、彼は自分の分析のに結果を喜んで提供した。Cheuk Hei氏以来、MLSの守備とプレッシングについて書いたが、追求は以下の質問に対処できる指標である。試合中のポゼッションの価値は何か。
I see a lot of similarities between xPG and Expected Goal Chains (xGC) and Expected Goals Buildup Chain (xBuildup GC or just xB). If you are unfamiliar with these concepts, read this post by Kevin Shank (EXPECTED GOAL CHAINS: THE LINK BETWEEN PASSING SEQUENCES AND SHOTS /OCTOBER 4, 2017 BY KEVIN SHANK), which explains xGC, and also view the current season metrics for both xG Chain and xB on this page. xB is the same as xGC, except that the shooter and owner of the key pass do not receive the xG value. In this case, xB gives xG value credit to everyone else involved in the buildup, and you can find out who is contributing to goal and shot buildup but just not receiving credit for the shot/goal or key pass/assist -- the unsung heroes, if you were. Expected Assists (xA) is a metric which gives the xG value to the owner of the key pass for any shot. These are fine-grained details which may be well known to some ASA readers, but this foundation helps us examine what xPG is and what it is not.
xPGとxGChainとxBuildup GChain(または単にxB)の間には多くの類似点がある。これらの概念に精通していない場合は、xGCについて説明しているKevin Shank氏の記事を読んでほしい。また、このページでxGChainとxBの今シーズンの指標を見られる。xBはxGCと、シュートを放った選手とキーパスの所有者がxG値を受け取らない点を除いて同じである。この場合、xBはビルドアップに関与する他のすべての人にxGの価値を与え、得点とシュートの蓄積に貢献しているがシュート/ゴールまたはキーパス/アシストのクレジットを受け取っていない人を見つけられる。xAは、任意のシュートのキーパスの所有者にxG値を与える指標である。これらはASAの読者の中にはよく知られている細かい詳細だが、この基盤はxPGが何であるか、何でないかを調べるのに役立つ。
In xPG, xG value is given to any player with a completed action within each possession. This is unlike xGC or xB, where players who are part of the possession chain are given the shot xG. In xPG, they are given xG for each successfully completed action whether a pass, dribble or shot. So xPG is most like xGC since value is given to the key pass and shot. However xGC only applies to those possessions which end in a shot and ignores every other possession. So xGC is an even distribution of xG and xPG is weighted distribution of xG. The following diagram shows where xPG and xGC compare in MLS 2018 on a per-96-minutes basis by players averages within each type of position.
xPGでは、xGの値は、各ポゼッション内でアクションが完了した選手に与えられる。これはxGCやxBとは異なり、ポゼッション連鎖に参加している選手にシュートxGが与えられる。xPGではパス、ドリブル、ショットのいずれの場合でも、成功したアクションごとにxGが与えられる。よって、xPGはキーパスとシュートに値が与えられているので、xGCに最も似ている。しかし、xGCはシュートで終了するポゼッションにのみ適用され、他のすべてのポゼッションを無視する。したがって、xGCはxGの均等分布であり、xPGはxGの加重分布である。次の図は、xPGとxGCの、MLS 2018でのそれぞれのポジションでの毎96分の平均の比較を示している。

As you can see, xGC is weighted to attacking midfielders, strikers, other forwards (usually 4-3-3 wingers), substitutes and outside midfielders. Substituted players are not assigned a position in the ASA dataset, but they are generally attacking players so this high average is not surprising.
ご覧のように、xGCはACM、FW、その他のFW(通常は4-3-3のWG)、途中出場、WGに加重される。途中出場選手はASAデータセットのポジションに割り当てられないが、一般的に攻撃的な選手のため、この高い平均値は驚くべきことではない。
When comparing xPG/96 to xGC/96, we see some similarities but also key differences: attacking midfielders and other forwards remain strong, but strikers are below average because many do not contribute consistently to the buildup phase of play. Central midfielders, defensive midfielders and outside midfielders are all above the average. Substitutes have the least impact, while defensive players remain about the same.
xPG/96とxGC/96を比較すると、いくつかの類似点があるが、重要な違いもある。AMやその他のFWは依然として強力だが、FWはビルドアップに一貫して寄与しないため平均以下である。CM、DM、WGはいずれも平均以上である。途中出場はあまりインパクトがないが、守備的な選手はほぼ同じである。
Most importantly, as explained by Cheuk Hei, xPG contribution shows a player’s value within a team or even within a particular formation and could even be used to evaluate role differences within a formation, such as a 4-4-2 diamond vs. a 4-4-2 flat -- or various central midfielder configurations in a 4-3-3. It becomes dangerous to draw comparisons at a player level, since a higher contribution does not compare across teams. You can’t say that Miguel Almirón on Atlanta United is “better” than Graham Zusi on Sporting KC or Maxi Morales on NYCFC because of Almirón’s higher contribution value. What matters in xPG is how important a particular player is in leveraging higher value situations within their own team.
最も重要なのは、Cheuk Hei氏が説明したように、xPG貢献度は、チーム内または特定のフォーメーション内での選手の価値を示し、4-4-2ダイヤモンド対4-4-2フラット、または4-3-3のさまざまなCMの構成など、フォーメーション内の役割の違いを評価するために使用することさえできる。より高い貢献度がチーム間で比較されないので、選手レベルで比較を描くことは危険になる。xPGの重要な点は、特定の選手が自分のチーム内のより高い価値のある状況をいかに重要に活用しているかである。
This means xPG can be a key metric in figuring out who benefits from a team’s formational change. xPG allows us to identify the player that contributes to his team’s buildup more in a 4-4-2 than he does in a 3-5-2, for example, or that forwards are more engaged in their team’s buildup in a 4-2-3-1 than in a 4-3-3.
これはxPGが、チームのフォーメーションの変化から利益を享受する主な指標になることを意味する。xPGを使用すると、例えば3-5-2の場合よりも4-4-2の方がチームのビルドアップに貢献する選手を特定でき、または、FWが4-3-3よりも4-2-3-1でビルドアップにもっと関与している。
EVALUATING PLAYERS IN EXPECTED POSSESSION GOALS
xPGで選手を評価する
Here are the players which contribute the most to their team’s buildup according to xPG through the first 18 games of the MLS 2018 season:
MLS 2018シーズンの最初の18試合でxPGに従ってチームの増強に最も貢献する選手は次のとおりである。

If a team has fewer, shorter, or lower value possessions this will impact how much xPG it generates in a particular game or over time. One way to check this is to contrast contribution % with xPG/min.
チームがより少ない、より短い、またはより低い価値のポゼッションの場合、これは特定の試合または時間の経過とともにどれだけのxPGが生成されるかに影響を与える。これをチェックする1つの方法は、貢献度%をxPG毎分と対照することである。

Let’s use Kyle Beckerman as an example here. He shows up on this graph twice because he has at least 400 minutes and has played both as a defensive midfielder in a 4-4-2 and on the left side of a 4-3-3 this season. He has had a 2.4% higher contribution in the 4-3-3 and has generated 0.15 xPG/min more than he has in the 4-4-2. This type of information could be very useful to Real Salt Lake’s coaching staff. If you would like to view the interactive version of this graph to find your favorite defensive player, go to tableau and hover over any symbol to see the associated player.
例としてカイル・ベッカーマンを使う。彼は少なくとも今シーズン400分、4-4-2のDMと4-3-3の左側の両方でプレーしているため、このグラフに2回表示される。彼は4-3-3で2.4%高い貢献度を持ち、4-4-2よりも0.15xPG毎分を多く生成する。この種の情報は、レアル・ソルトレイクのコーチングスタッフにとって非常に役立つ。このグラフの相互作用版を表示して好きな守備的選手を見つけたい場合は、tableauに行き、任意のシンボルの上にカーソルを置いて、関連する選手を表示してほしい。
Average contributions are a good way to see how players are fitting in a particular formation or how that new DP signed in the summer transfer window is changing the shape of the team. To see the contribution for any particular game from this season through Week 18, I came up with this box-and-whisker visualization.
平均的な貢献は、選手が特定のフォーメーションでどのようにフィットしているか、または夏の移籍ウィンドウで署名した新しいDPがチームの形を変えているかを確認する良い方法である。今シーズン18週までの特定の試合の貢献を見るために、私はこのボックスアンドウィスカー視覚化を考え出した。

The fully interactive version that lets you explore your favorite or hated MLS team can be found here: tableau
好きまたは嫌いなMLSチームを探索させる完全な相互作用版がtableauにある。
EVALUATING EXPECTED POSSESSION GOALS AS A METRIC
xPGを指標として評価する
I do want to point out some of the concerns with xPG, which I believe require critical analysis from the community. Assigning xG for every completed action is a good way to acknowledge soccer as an 11-player team sport, but with weighting on some actions over others based on their potential value. But I would say it also has its own issues. Take a look at this version of the 162 sub-zones chart with the average shot xG in MLS from 2015 to 2018 in each zone. Corners have been excluded from the analysis, but Cheuk Hei has included xG for headed balls, penalties and freekicks for reasons he may choose to elaborate on.
コミュニティからの批判的分析が必要と考えるxPGの懸案事項のいくつかを指摘する。完了したアクションごとにxGを割り当てることは、11人のチームスポーツとしてフットボールを認める良い方法だが、潜在的な価値に基づいて他よりもいくつかのアクションに重み付けをする。しかし、それも独自の問題がある。各ゾーンの2015年から2018年までのMLSの平均シュートxGを用いて、このバージョンの162のサブゾーンチャートを見る。CKは分析から除外されたが、Cheuk Hei氏は、ヘディングシュート、PK、FKにxGを加えた。

Remember the attacking direction is up the field. There are three potential issues I see with these xG values:
攻撃方向は上にある。これらのxG値には3つの潜在的な問題がある。
There are several sub-zones noted in red where there have been no successful shots (or perhaps no shots at all). That means there are a few key sub-zones around the center of the pitch where it feels there should be an xG value, but there is not. Currently any xPG actions in those sub-zones would get a xPG value of 0. In some cases, there is a value on the equivalent sub-zones on the opposite side of the pitch.
赤で記されたいくつかのサブゾーンがあり、成功したシュートがなかった(またはシュートが全くない)場合がある。つまり、ピッチ中央にxG値があるはずだと感じるがそうではない、重要なサブゾーンがあることを意味する。現在、それらのサブゾーン内の任意のxPGアクションはxPG値0を得る。場合によっては、ピッチの反対側にある同等のサブゾーンに値がある。
There are several sub-zones noted in orange where the values feel questionable, and the values likely are due to a very small volume of shots, potentially more successful shots than there reasonably should be were the volume higher. In a few cases there is a distinct difference between one sub-zone and its equivalent sub-zone on the other side of the pitch. I’m not expecting exact equivalence, because, historically speaking, there are reasons for equivalent left/right areas of the pitch to have different xG values, whether it be player footedness or other factors.
値が疑わしいオレンジ色で示されたいくつかのサブゾーンがあり、その値はシュート数が非常に少ないため、合理的にそうでなければならないものよりも、より多くの得点が得られる可能性が高い。いくつかの場合では、1つのサブゾーンとそれに相当するピッチの反対側のサブゾーンとの間に明確な違いがある。歴史的に言えば、それが選手の足跡やその他の要因であるかどうにかかわらず、ピッチの左右の領域が異なるxG値を持つ理由があるため、正確な等価性は期待していない。
I would like to see a more direct correlation with the mostly-accepted xGC and xB metrics. This would allow for analysis at a directly comparable level. For example, xPG includes possessions ending in a penalty kick, and includes successful dribbles as completed actions receiving xG. ASA’s xGC and xB use neither, and their values follow OPTA rules for defining possessions and chains (OptaPro BLOG: Introducing a possessions framework). It would be best for critical comparison if xPG did as well, in my opinion.
主に受け入れられているxGCとxBの指標とのより直接的な相関を見たいと思う。これは、直接比較可能なレベルでの分析を可能にする。例えば、xPGはPKで終わるポゼッションを含み、xGを受け取った完了したアクションとして成功したドリブルを含む。ASAのxGCとxBはどちらも使用せず、その値はポゼッション連鎖を定義するOPTAルールに従う。xPGも同様に批判的比較をするのが最善だろう。
One answer may be to run shot simulations with certain parameters to essentially generate missing xG data to determine the appropriate values in underpopulated zones. Or maybe David Bingham needs to do some of these shots in league games to generate some xG:
1つの答えは、一部のパラメータでシュートのシミュレーションを実行して欠落したxGデータを本質的に生成して、不足したゾーンの適切な値を決定することである。あるいはデイヴィッド・ビンガムがいくつかのxGを生成するためにリーグ戦でこれらのシュートのいくつかを行う必要があるかもしれない。
CONCLUSION
結論
All in all, Expected Possession Goals is a promising conceptual metric for analyzing matches and teams based on the quality of their possessions. Cheuk Hei has provided a lot of immediate uses for the data in his initial article, and I believe the possibilities are even deeper than these articles have covered. We look forward to critical analysis of the methodology and input from the community as many of us seek to provide a more holistic view of the sequential events of a soccer match than xG and its existing derivative metrics are able to give us.
全体としてxPGは、ポゼッションの質に基づいて試合とチームを分析する有望な概念的指標である。Cheuk Hei氏は、彼の最初の記事ではデータのための多くの即座の使用を提供しており、これらの記事がカバーしているよりもさらに深い可能性があると信じている。コミュニティからの方法論とインプットの批判的分析を楽しみにしており、多くは、フットボールの試合の連続イベントをxGよりも包括的に見たいと考えており、既存の派生指標が与えることができる。
ここから先は
¥ 100
Amazonギフトカード5,000円分が当たる
この記事が参加している募集
#フットボール統計学