
微生物叢解析にQiime2を使う
追記:2025/01/29
生物技研のNGSがMiseqからNextseqに変更されたことにより、
生データの取り込みが上手くいかない場合があります。
以下のQiime2手順はNanaimoさんが公開されているものを参考にしています。
Qiime2のインストール
For those who have previously installed Qiime2, or even attempted to install it, it is recommended to construct and manage a dedicated virtual environment for each release.
※ In the following, I assume the use of PICRUSt and have installed ver. 2023.2, but if not using PICRUSt, I recommend installing the latest ver.
Minicondaのアップデート
conda update condawgetのインストール
conda install wgetQiime2をcondaの仮想環境にインストール
These instructions are for users with Apple Silicon chips (M1, M2, etc), and configures the installation of QIIME 2 in Rosetta 2 emulation mode.
(For Mac OS, OS X, or Linux, refer to the following site)
wget https://data.qiime2.org/distro/core/qiime2-2023.2-py38-osx-conda.yml
CONDA_SUBDIR=osx-64 conda env create -n qiime2-2023.2 --file qiime2-2023.2-py38-osx-conda.yml
conda activate qiime2-2023.2
conda config --env --set subdir osx-64
The last used yml file is not needed, so delete it.
rm qiime2-2023.2-py38-osx-conda.ymlQiime2の起動
Now that you have a QIIME 2 environment, activate it using the environment’s name
conda activate qiime2-2023.2動作確認
qiime --helpIf no errors are reported when running this command, the installation was successful.
おまけ:PICRUSt2のインストール
Plugin to run the PICRUSt2 pipeline to get EC, KO, and MetaCyc pathway predictions based on 16S data. Either EPA-NG or SEPP can be used to place sequences into the required reference phylogeny.
Only "qiime2-2023.2" supports picrust2 analysis (2024年2月時点)
conda install q2-picrust2=2023.2 \
-c conda-forge \
-c bioconda \
-c gavinmdouglas
Once the installation is complete, enter the following command, you can verify the installation of PICRUSt2.
qiime --help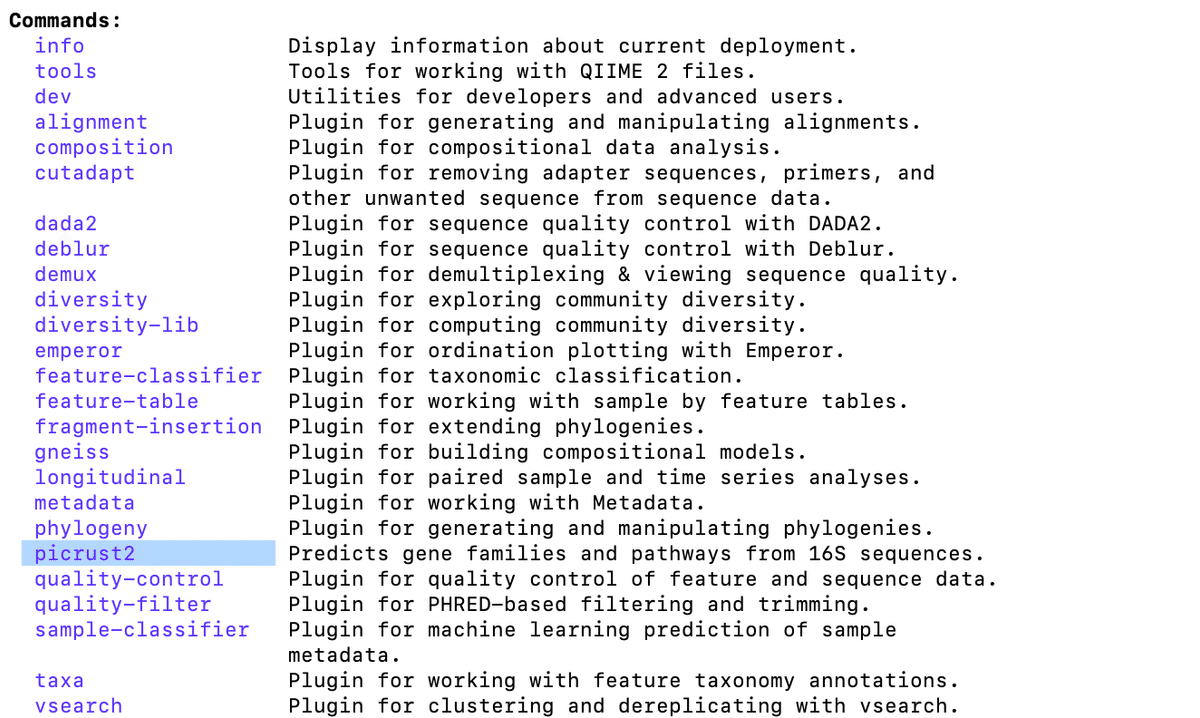
Qiime2の準備
解析用フォルダの作成
Create a file named "qiime" on the desktop.

You will need the following 4 files:
Sequenceファイル(.fastq)
manifestファイル(.csv)
sample-metadataファイル(.txt)
classifierファイル(.qza)
1. Sequenceファイル
Use the data from the analysis results delivered by "生物技研".
Extract the Sample.fastq in the Raw_fastq folder (excluding experiment.tsv and md5sum.tsv).
Create a folder named "sequence" within the "qiime" folder, and place the fastq files to be analyzed there.

2. manifestファイル
Open an Excel file and enter "sample-id", "absolute-filepath", and "direction" in separate cells in the first row.
・PWD:Print Working Directory
・_R1:forward
・_R2:reverse
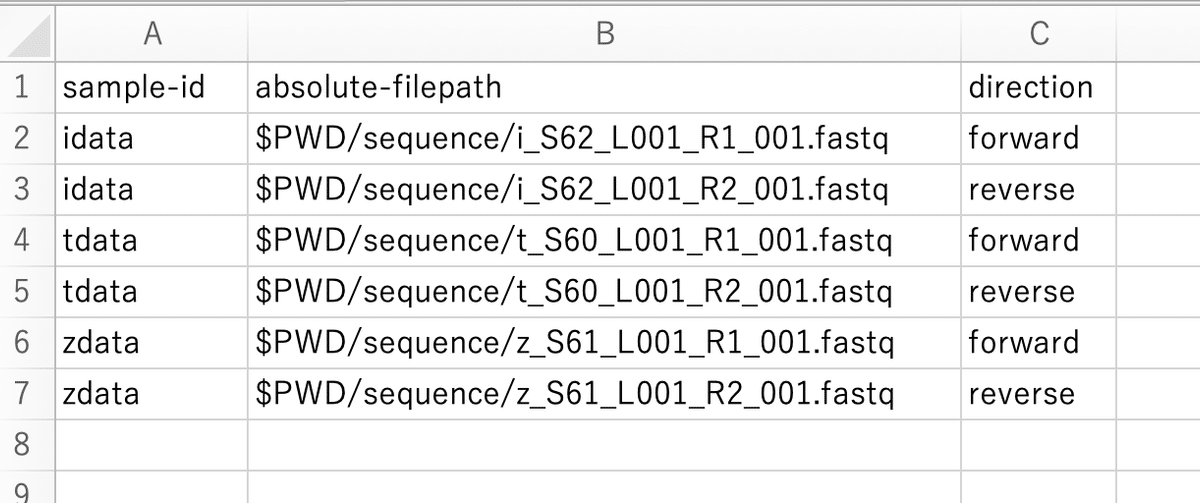
Select "Save As" and name the file "manifest". Also, choose "CSV UTF-8 (コンマ区切り)(.csv)" as the file format. Please save it in the "qiime" folder.
While it lacks the flexibility of PWD, if you are following the above process, I think it's easier to use the following code to create manifest.csv.
Activate the conda environment and use the "cd" command to change the directory to the qiime folder.
After typing "cd", you can easily do this by dragging the folder.
cd /Users/ユーザー名/Desktop/qiime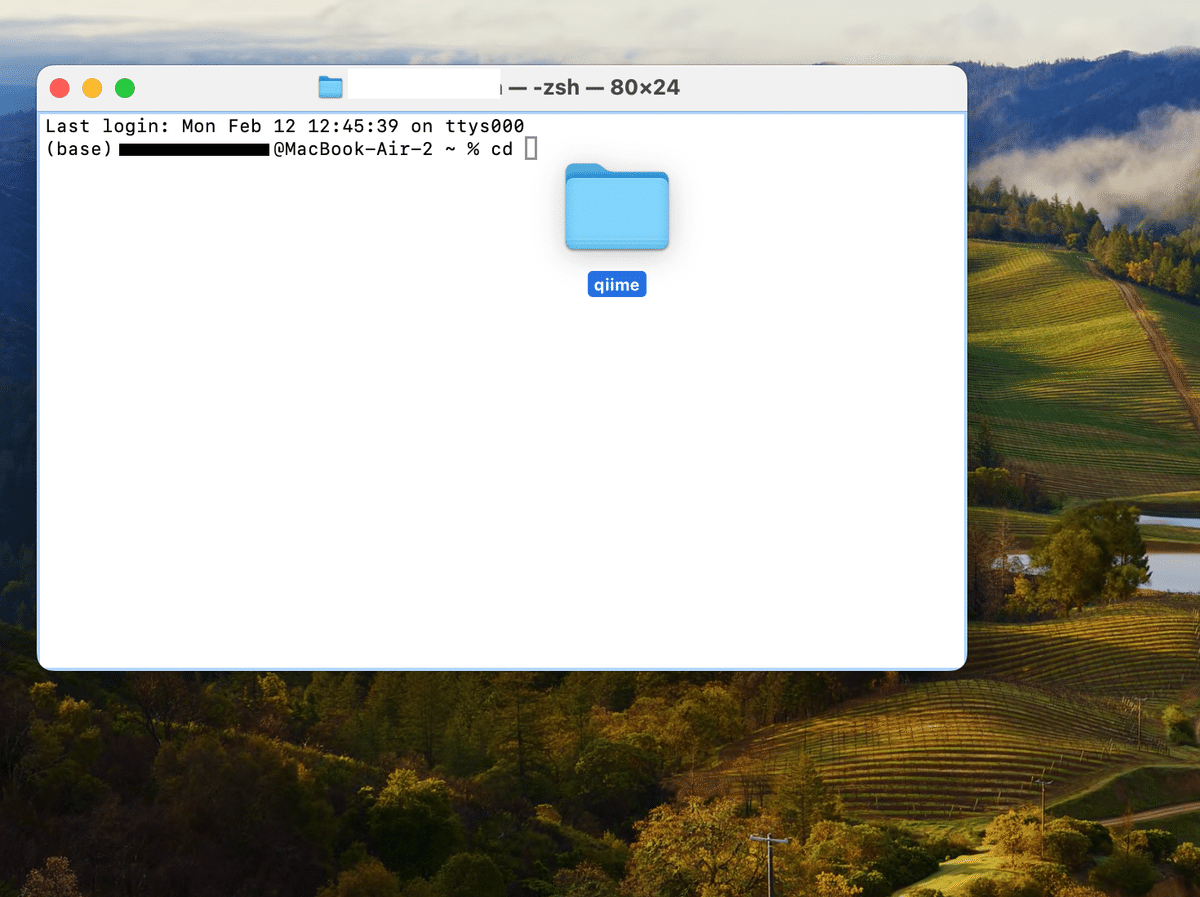
ls sequence/* | \
awk -F'/' -v P="$(pwd)" 'BEGIN { print "sample-id,absolute-filepath,direction" }
{
    split($NF,a,"_");
    if(NR%2==0){print a[1]","P"/"$0",reverse"}
    else{print a[1]","P"/"$0",forward"}
}' > manifest.csv
3. sample-metadataファイル
In the first row, enter "sample-id" at the beginning, and then enter "#q2:types" below it.
Please classify the groups as appropriate.
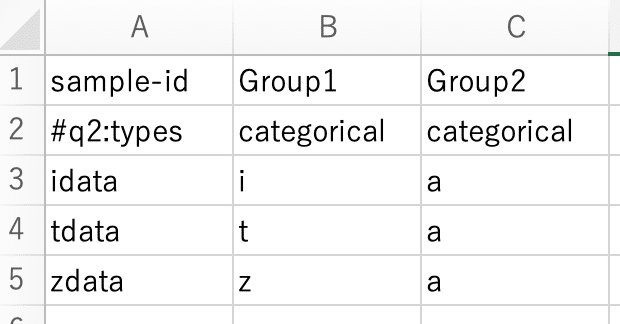
Select "Save As" and name the file "sample-metadata". Also, choose "タブ区切りテキスト(.txt)" as the file format. Please save it in the "qiime" folder.
Please add the necessary information to the file generated using the following code:
ls sequence/* | \
awk -F'/' -v P="$(pwd)" 'BEGIN { print "sample-id\tGroup1"; print "#q2:types\tcategorical" }
{
    split($NF,a,"_");
    if (!(a[1] in seen)) {
        print a[1];
        seen[a[1]] = 1;
    }
}' > sample-metadata.txt
4. classifierファイル
Here, we will create a classifier file using "Silva".
Download two files from the following site
・Silva 138 SSURef NR99 full-length sequences
・Silva 138 SSURef NR99 full-length taxonomy
"--p-f-primer", input the binding sequence for the Forward primer of the 16S rRNA sequence
"--p-r-primer", input the binding sequence for the Reverse primer.
"--p-max-length" input the size of the 1st PCR product +α(100)
Ex) 16S rRNA V5-V6 Primer
・799F:AACMGGATTAGATACCCKG
・1185mR:GAYTTGACGTCATCCM
・max-length:500(要検討)
・min-length:100
別のプライマーを使用した場合のものは改めてまとめようと思います。
qiime feature-classifier extract-reads \
--i-sequences  silva-138-99-seqs.qza  \
--p-f-primer AACMGGATTAGATACCCKG \
--p-r-primer GAYTTGACGTCATCCM \
--p-min-length 100 \
--p-max-length 500 \
--o-reads silva-138-99-ref-seqs.qza
next:
qiime feature-classifier fit-classifier-naive-bayes \
--i-reference-reads silva-138-99-ref-seqs.qza \
--i-reference-taxonomy silva-138-99-tax.qza \
--o-classifier silva-138-99-classifier.qza
If the "silva-138-99-classifier.qza" file is generated, then the process is complete.
Qiime2による微生物叢解析
生データの取り込み
qiime tools import   \
--type 'SampleData[PairedEndSequencesWithQuality]'   \
--input-path manifest.csv   \
--output-path paired-end-demux.qza   \
--input-format PairedEndFastqManifestPhred33
A file named "paired-end-demux.qza" will be generated.
(Supports only paired-end sequences.)
生データの denoising
Remove primer sequences by specifying sequences with cutadapt.
qiime cutadapt trim-paired  \
--i-demultiplexed-sequences paired-end-demux.qza  \
--p-cores 8  \
--p-front-f AACMGGATTAGATACCCKG  \
--p-front-r GAYTTGACGTCATCCM  \
--o-trimmed-sequences primer-trimmed-demux.qza  \
--verbose

qiime demux summarize  \
--i-data primer-trimmed-demux.qza  \
--o-visualization primer-trimmed-demux.qzv
A file named "primer-trimmed-demux.qzv" will be generated.
(.qzv) is a visualization file, and you can check the information on the following site:
Quality score の可視化 & DADA2
Drag and drop "primer-trimmed-demux.qzv" into Qiime2 View and open the "Interactive Quality Plot" tab. Here, you can check the Quality score.
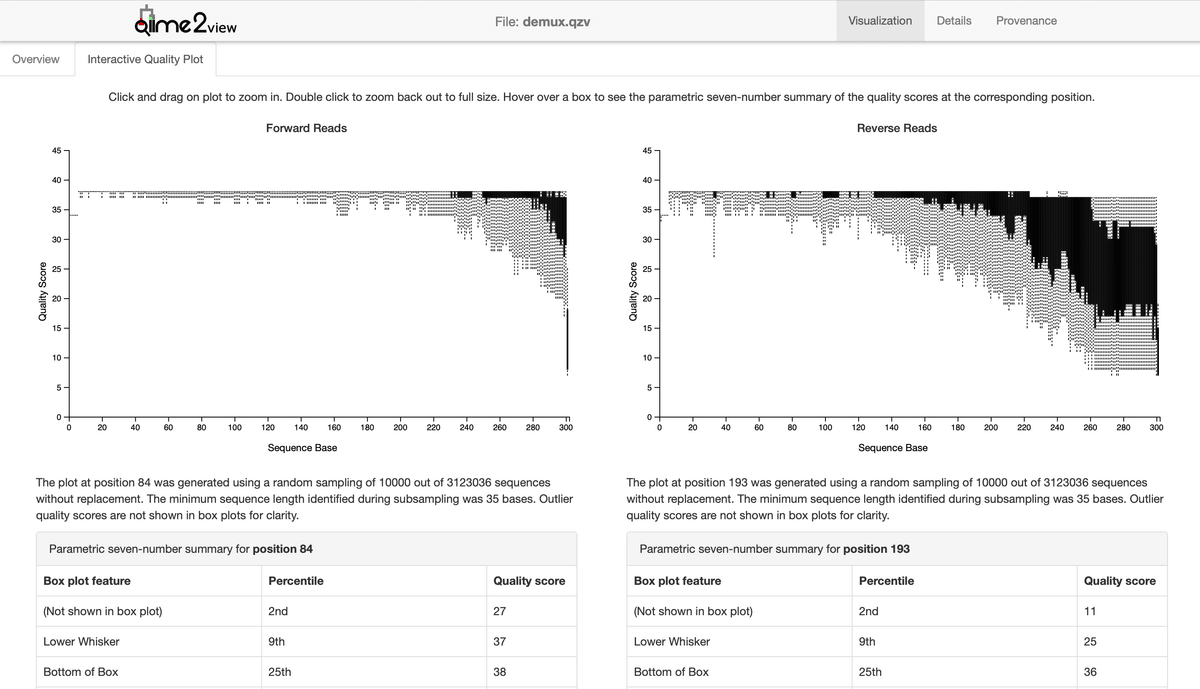
Remove sequences that Quality score at the Bottom of the Box is below 30 bp.
※ It seems that the following site refers to the Middle of the Box.
In this case, for forward sequences, the quality starts to decline from 280 bp, and for reverse sequences, the quality decreases from around 210 bp. Therefore, execute the commands as follows:
※ If not using cutadapt, specify the cut length for the leading side to be about 20~30 bp.
qiime dada2 denoise-paired \
--i-demultiplexed-seqs primer-trimmed-demux.qza  \
--p-trim-left-f 0 \
--p-trim-left-r 0 \
--p-trunc-len-f 280 \
--p-trunc-len-r 210 \
--o-representative-sequences rep-seqs-dada2.qza  \
--o-table table-dada2.qza   \
--o-denoising-stats stats-dada2.qza  \
--p-n-threads 3  \
--verbose
条件計算(調べてる途中)
・Cycle length:386 bp(primer, 799F~1185mR)
・Forward primer length:19 bp, AACMGGATTAGATACCCKG
・Reverse primer length:16 bp, GAYTTGACGTCATCCM
(280 + 210) - (386 + 19 + 16) = 69:Overlap length ≧ 20 bp → OK
・–p-trunc-len-f ≧ –p-trunc-len-r
denoising 結果の可視化
The following three files should have been generated:
1.table-dada2.qza
2.rep-seqs-dada2.qza
3.stats-dada2.qza
Visualize "stats-dada2.qza" with the following command:
qiime metadata tabulate \
--m-input-file stats-dada2.qza \
--o-visualization stats-dada2.qzv
Check the output "stats-dada2.qzv" in Qiime2 View.
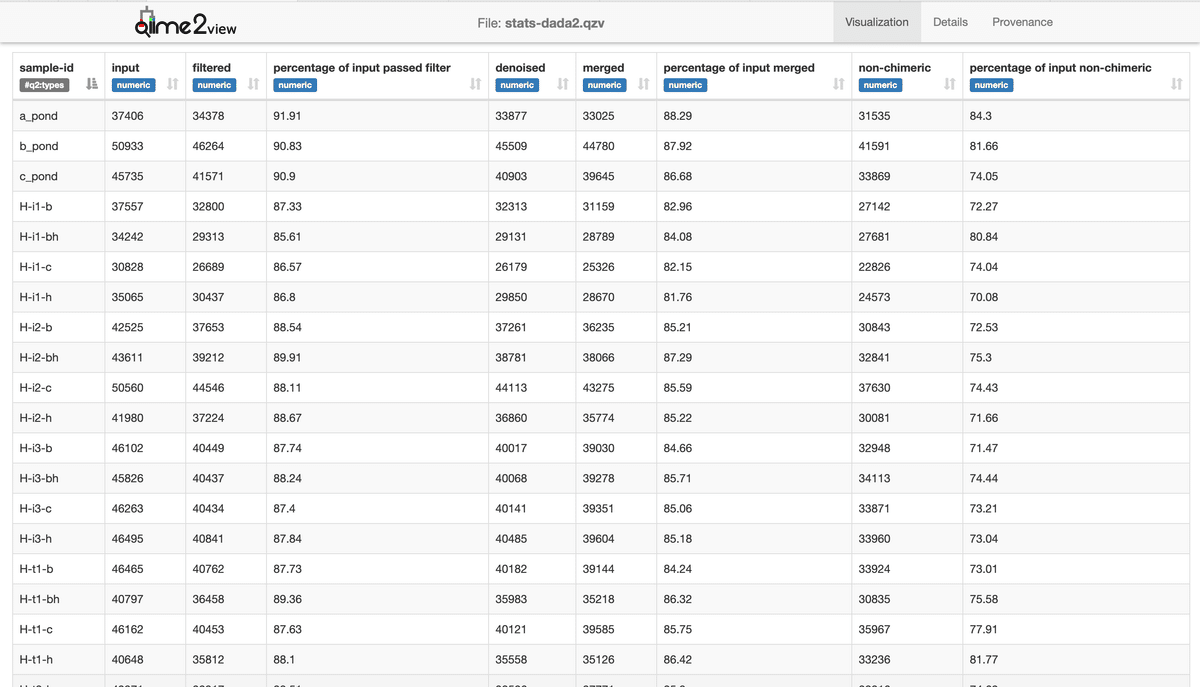
Ultimately, about 70-80% of sequences passed through DADA2.
I don't know how many should remain...
The preparations for analyses such as α/β diversity and taxa, as well as PICRUSt, have been completed.
