gglot-散布図の基本

必要なライブラリを読み込む
library(tidyverse)
library(ggplot2)
オブジェクトの用意
g<- ggplot(data = RailTrail, aes(y=hightemp, x=volume))
g
デフォルト要素
・data:~~ (データフレーム)
・mapping-aes x:(変数名)
y:(変数名)
・layer geometric:point(点で描画することを指定)
・stat:identity(そのままの値で扱うことを指定)
・position:identity(そのままの値で扱うことを指定)
色で分ける(連続変数の時) color= を入れる
g<- ggplot(RailTrail,aes(x=volume,y=hightemp,color=precip))+
  geom_point()
g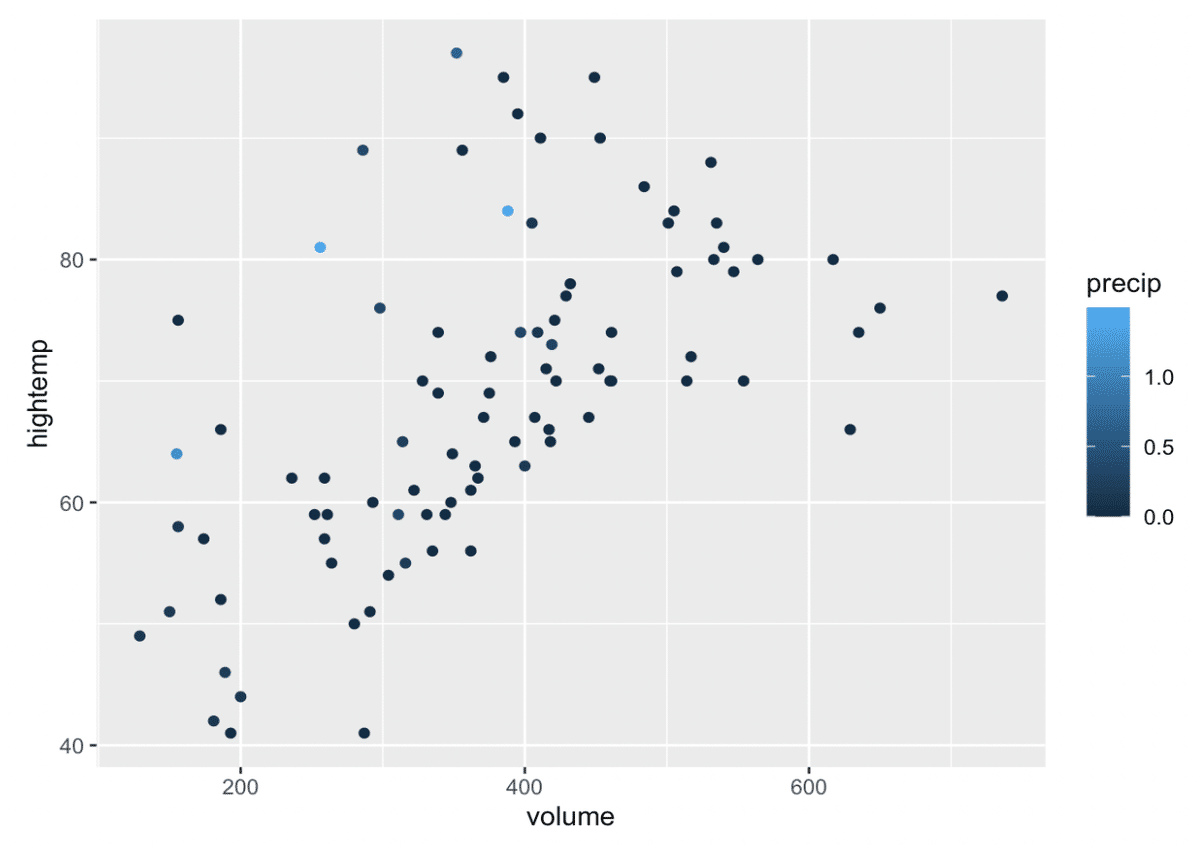
色で分ける(離散変数)離散変数になると、色分けになる!!
g<- ggplot(RailTrail,aes(x=volume,y=hightemp,color=dayType))+
  geom_point()
g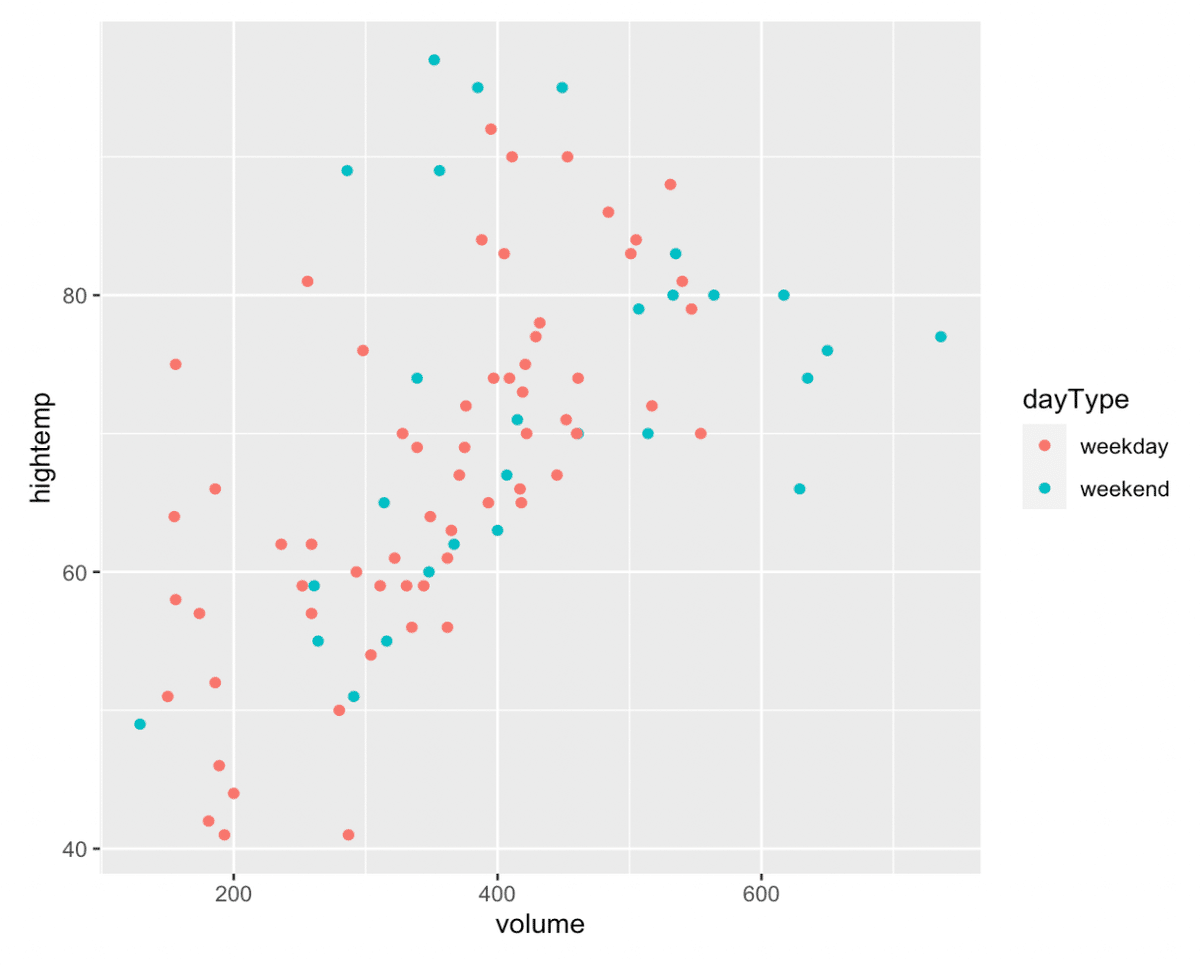
離散変数の時、形で変えることができる
g<- ggplot(RailTrail,aes(x=volume,y=hightemp,shape=dayType))+
  geom_point()
g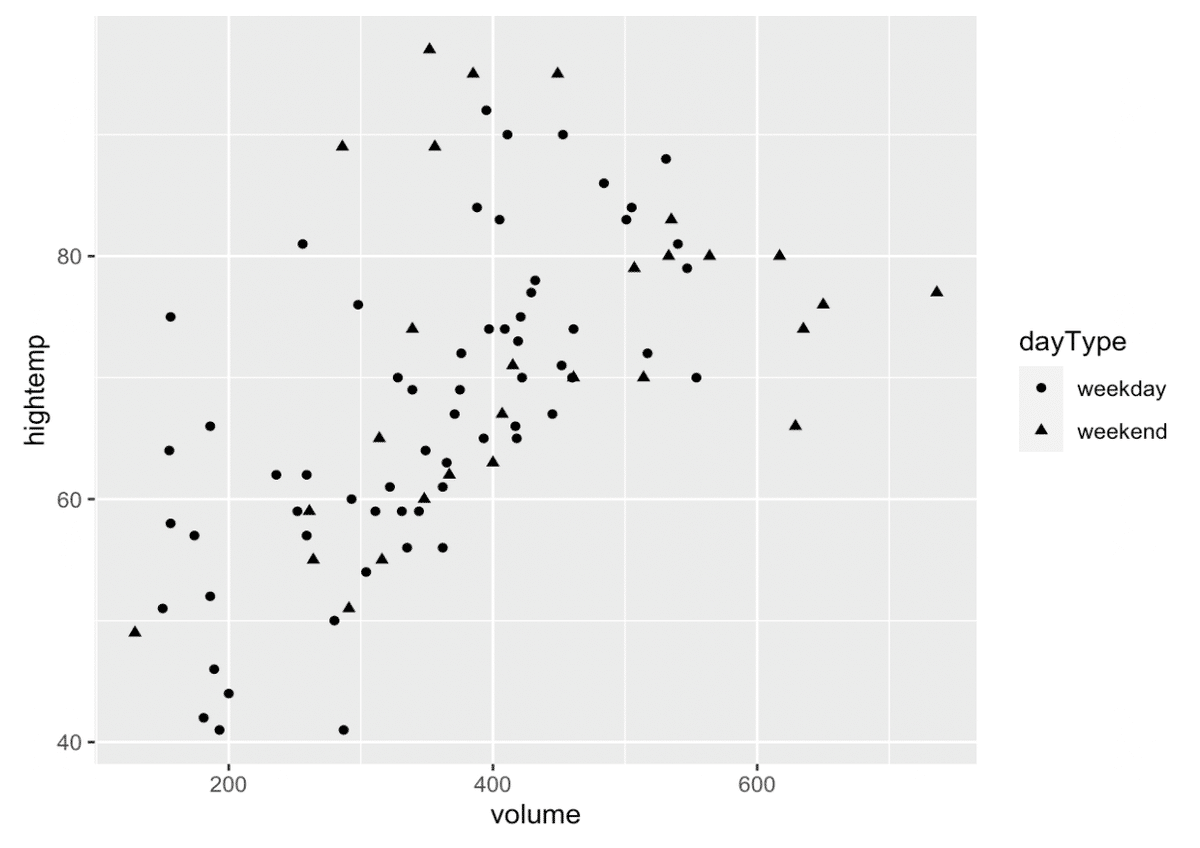
軸の数値の設定:scaleを使用する
g<- ggplot(RailTrail,aes(x=volume,y=hightemp,color=dayType))+
  geom_point()+
  scale_y_continuous(limits = c(0,100))
g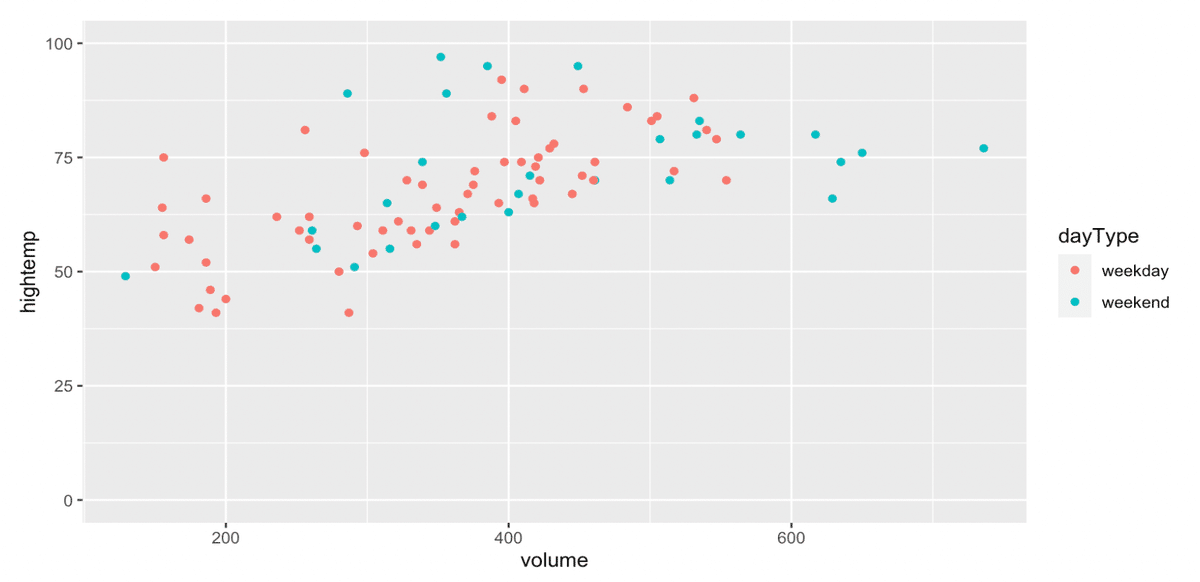
テーマを変える:themeでいける
→これ以外の設定は、チートシートを参照する!!
g+theme_bw()
g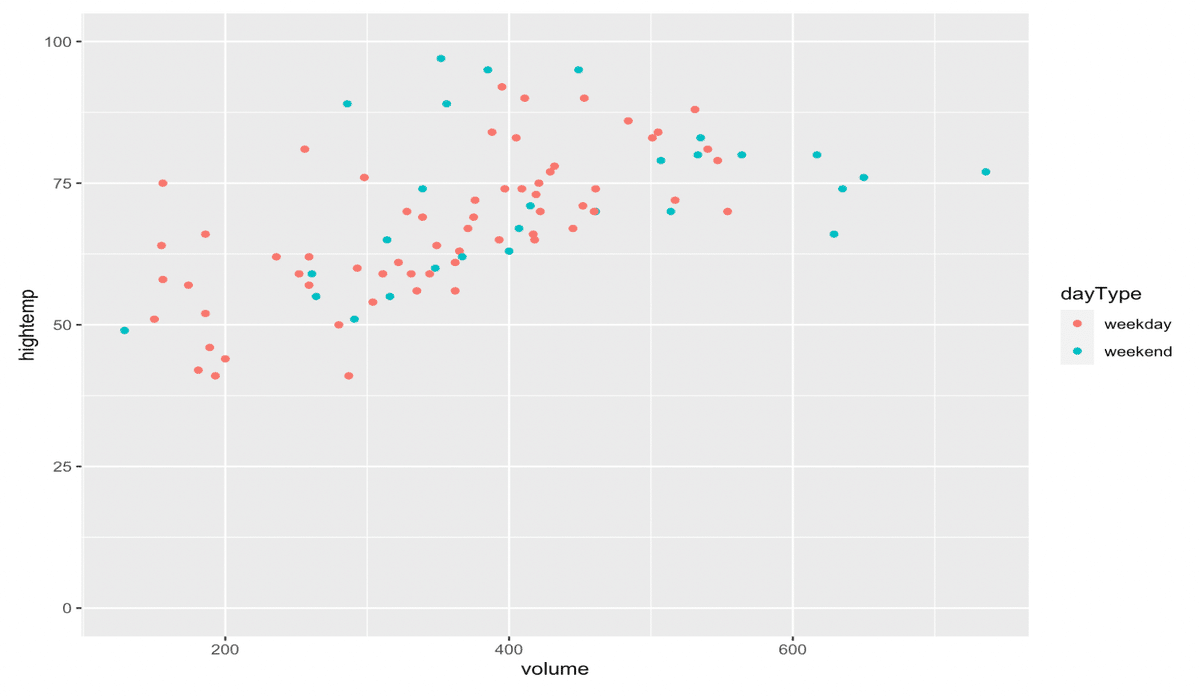
グラフタイトル/軸/ラベルを設定する
labs(,,,)
g+
  labs(title="Homework",
       subtitle="yokohama",
       x="volume",
       y="hightemp",
       color="Daytype")
g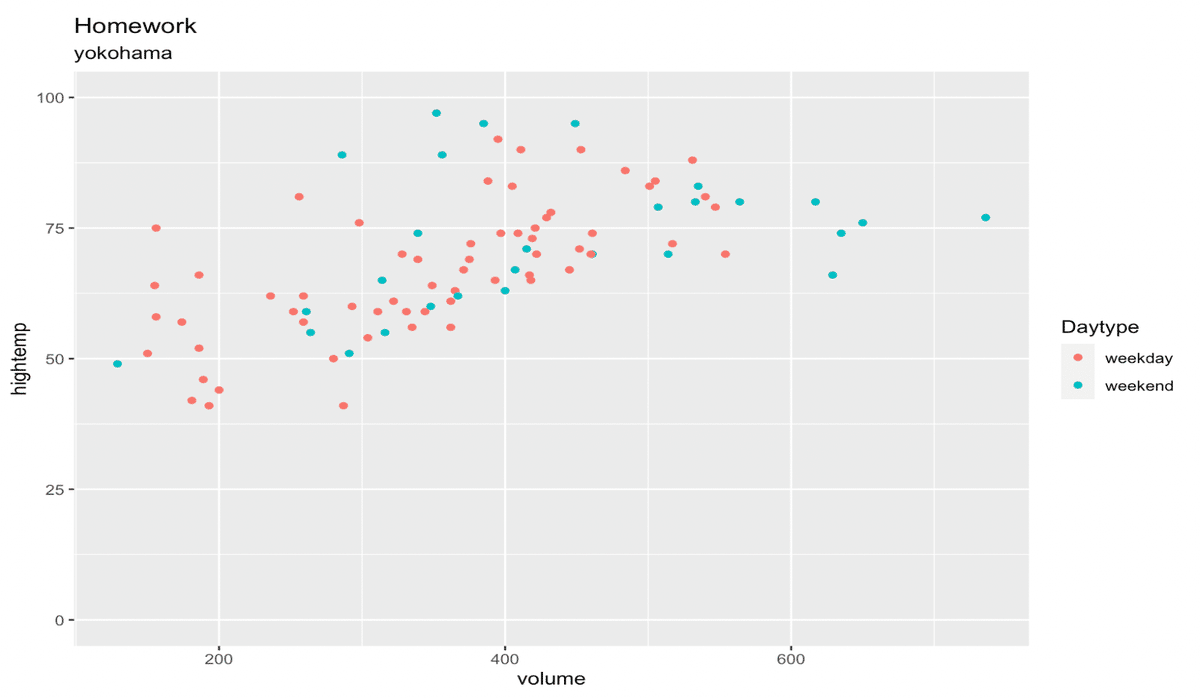
title= タイトル
subtitle=サブタイトル
x=x軸/ y=y軸
color=色
条件ごとに図を分けたい!!= facet
g+
  facet_grid(rows=vars(dayType))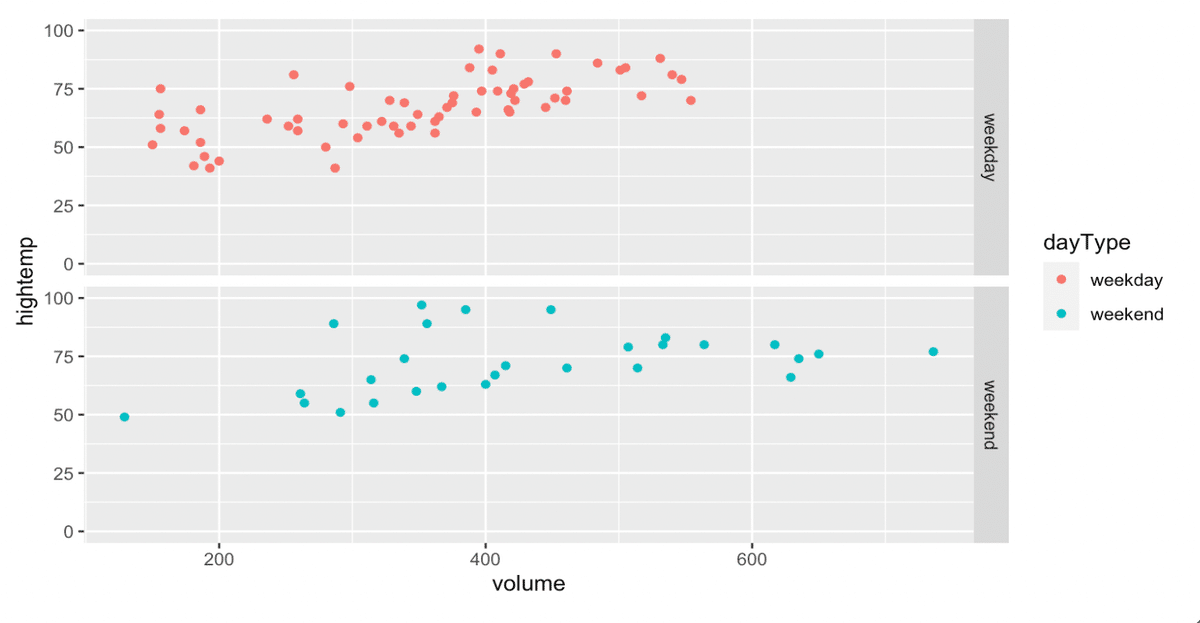
facetの切り分けを使う= facet_grid
g+
  facet_wrap(~dayType, ncol = 2)

g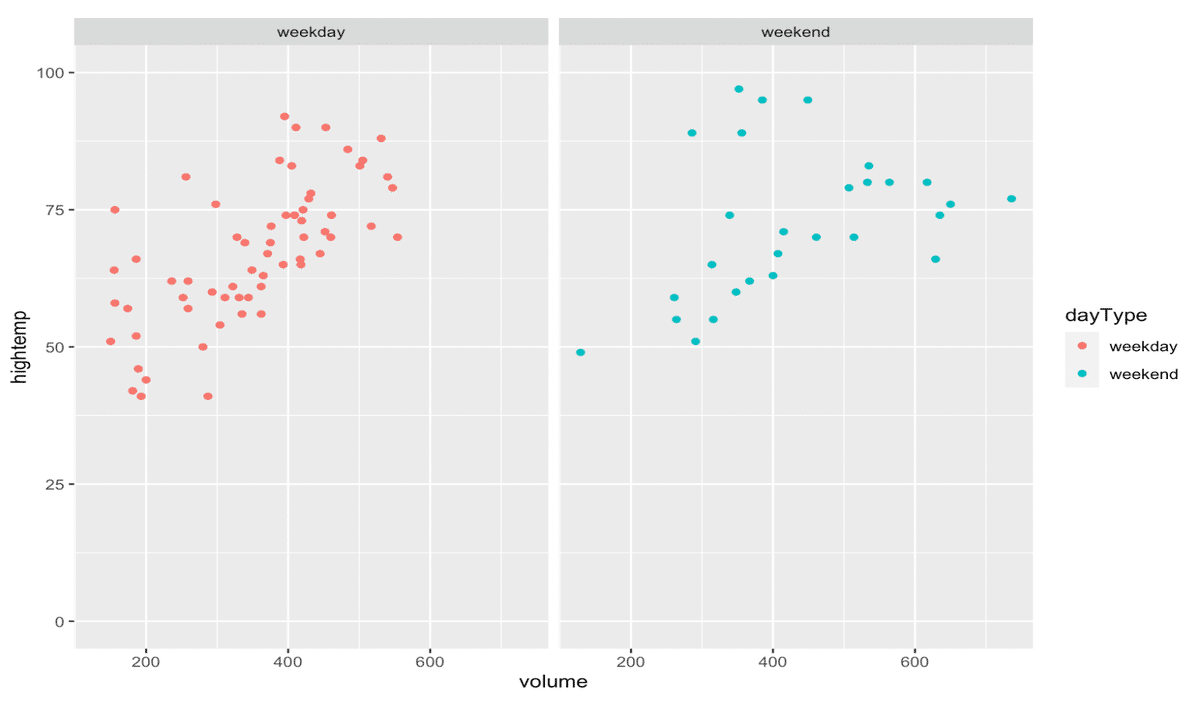
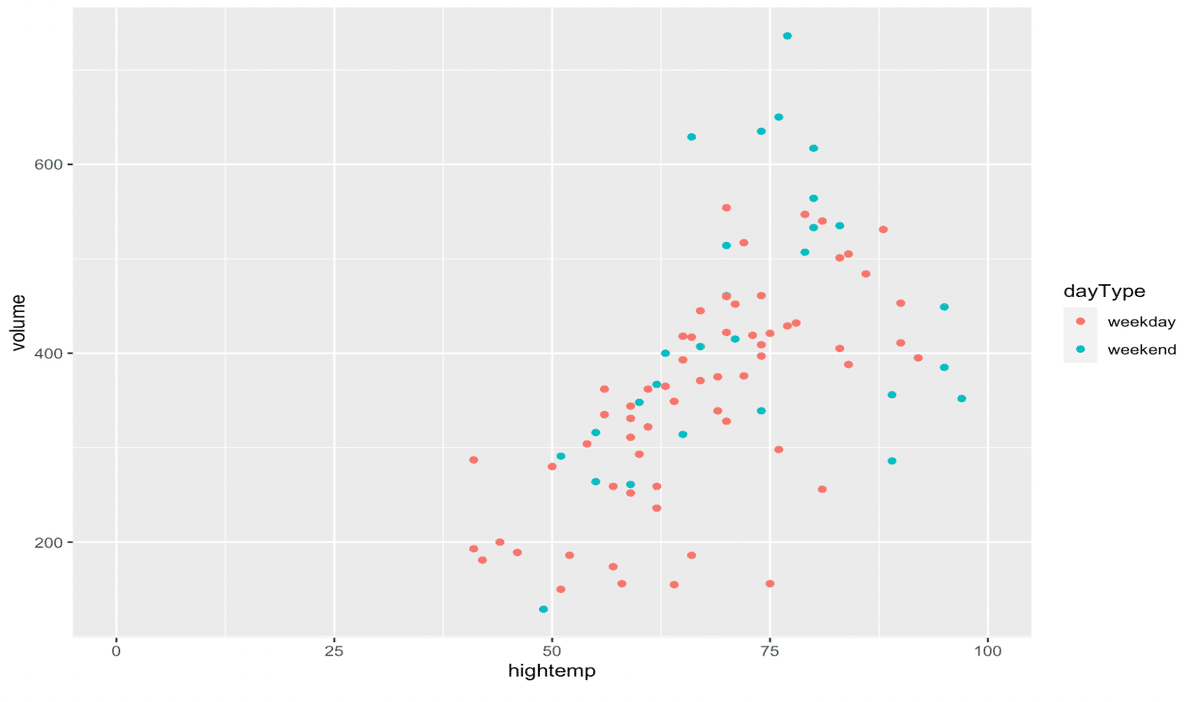
横軸を入れ替えたい coordinate
g+
  coord_flip()
g
**
mapping-aesにはxとyが必須!!
colorで色分け
shapeで分けていく
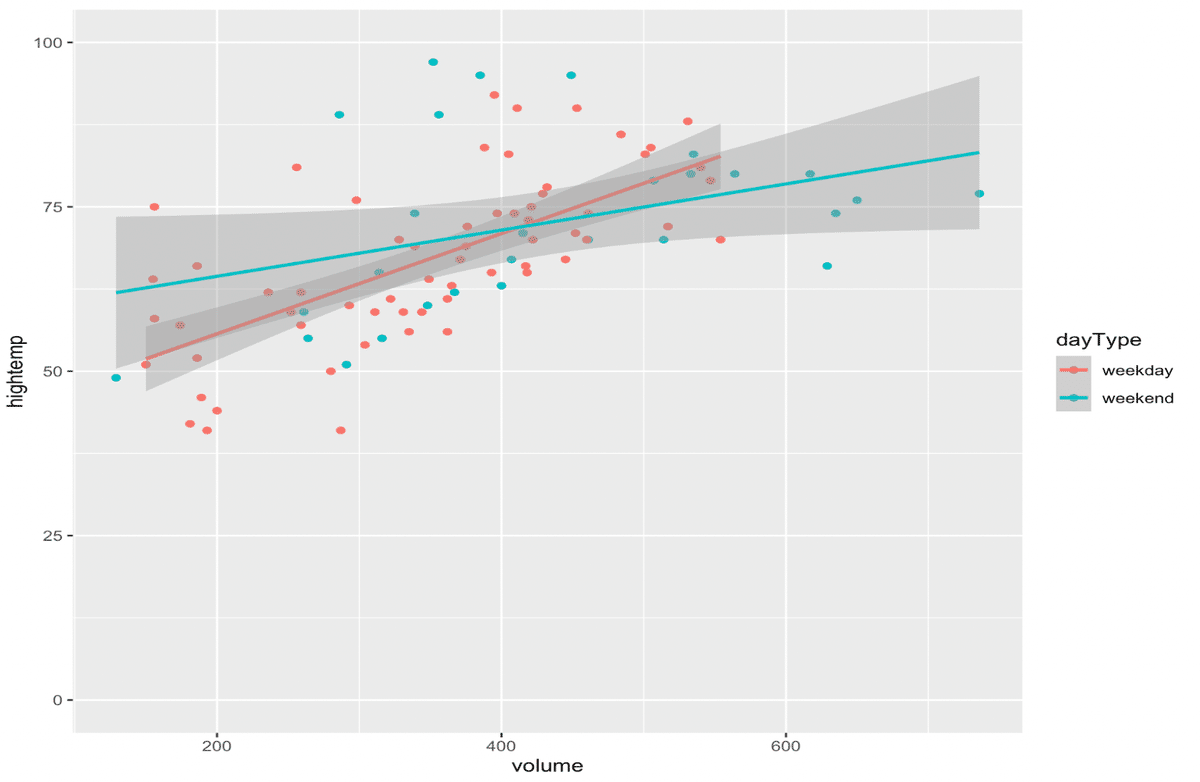
回帰直線: geom_smooth
g+
  geom_point()+
  geom_smooth(method = "lm")

g