【Python】【相場】VIX指数とSP500のリターンの関係を確認する
VIXとは、株式市場の先行きに対する投資家の心理状態を示す指数です。VIXは、S&P500の先物のオプション価格を元に算出されており、S&P500の値動きが激しくなると予測する投資家が増えるとVIXは上昇し、S&P500が安定すると予測する投資家が増えるとVIXは下落します。投資家が不安を抱いている時にVIXは上昇するため、恐怖指数とも言われています。
VIXの数値は市場が安定しているとき、10~20の範囲で動くと言われています。近いうちに大きな下げがあるのではないかという警戒感が高まってくると20%を超え、リーマンショックやコロナショックのようなパニックになると30%を超えます。
VIXのデータ取得と可視化については、過去の記事でも扱っているのでそちらも参考にしていただけると幸いです。
なお、最低限のポイントのみの説明にするため、Pythonライブラリ、モジュール等のインストール方法については割愛させて頂きます。お使いのPC環境等に合わせてインストールしてもらえればと思います。
1.SP500とVIX指数を取得
S&P500とVIX指数を取得するために、pandas-datareaderとyfinanceを使用します。stooqおよびyfinanceより取得する日付範囲と取得するコードを指定して株価情報を取得します。
株価取得開始日:start = '2018-01-01'
株価取得終了日:end = datetime.date.today()(今日の日付を取得)
各種ライブラリをインポートします。
import pandas_datareader.data as web
import yfinance as yf
import datetime
import pandas as pd

import plotly.graph_objects as go  # グラフ表示関連ライブラリ
import plotly.io as pio  # 入出力関連ライブラリ
pio.renderers.default = 'iframe'
SP500とVIX指数のティッカーコードをリストに格納します。
# 確認対象銘柄

# stooqより取得
codelists_stooq = [
    "^SPX", # S&P 500
]

# yahoofinanceより取得
codelists_yf = [
    "^VIX", # VIX index
]
現在の日時を最終日とし、2018年1月1日を開始日として、stooqとyfinanceからSP500とVIX指数とSKEW指数を取得します。そして、stooqとyfinanceから取得したデータを結合します。
# 2018/1/1から現在まで
start = '2018-01-01'
end = datetime.date.today()

# データ取得(stooq)
_df_stooq = web.DataReader(codelists_stooq, 'stooq', start, end)['Close']

# 日付を昇順に並び替える
_df_stooq.sort_index(inplace=True)

# データ取得(yahoo finance)
_df_yahoo = yf.download(codelists_yf, start, end)['Adj Close']

df = pd.DataFrame()
df = pd.merge(_df_stooq, _df_yahoo, on='Date', how='outer')

df.columns = ['S&P500', 'VIX']
df.head(20)で先頭から20行を表示します。

2.VIX指数とS&P500の100日後リターンの関係を確認する
100日後のリターンは、
((df['S&P500'].shift(-100) - df['S&P500']) / df['S&P500'])*100
で算出される。VIXの5刻み範囲の代表値をVIX_c カラムに入れる。
days = 100
df_vix_days = df.copy()

# days後のリターンの計算
df_vix_days['Return'] = ((df_vix_days['S&P500'].shift(-days) - df_vix_days['S&P500']) / df_vix_days['S&P500'])*100

# 欠損値の削除
df_vix_days.dropna(inplace = True)

# VIXの5刻み範囲の代表値をVIX_c カラムに入れる
df_vix_days['VIX_c'] = 0
df_vix_days.loc[df_vix_days['VIX'] < 5, 'VIX_c'] = 5
df_vix_days.loc[(df_vix_days['VIX'] >= 5) & (df_vix_days['VIX'] < 10), 'VIX_c'] = 10
df_vix_days.loc[(df_vix_days['VIX'] >= 10) & (df_vix_days['VIX'] < 15), 'VIX_c'] = 15
df_vix_days.loc[(df_vix_days['VIX'] >= 15) & (df_vix_days['VIX'] < 20), 'VIX_c'] = 20
df_vix_days.loc[(df_vix_days['VIX'] >= 20) & (df_vix_days['VIX'] < 25), 'VIX_c'] = 25
df_vix_days.loc[(df_vix_days['VIX'] >= 25) & (df_vix_days['VIX'] < 30), 'VIX_c'] = 30
df_vix_days.loc[(df_vix_days['VIX'] >= 30) & (df_vix_days['VIX'] < 35), 'VIX_c'] = 35
df_vix_days.loc[(df_vix_days['VIX'] >= 35) & (df_vix_days['VIX'] < 40), 'VIX_c'] = 40
df_vix_days.loc[(df_vix_days['VIX'] >= 40) & (df_vix_days['VIX'] < 45), 'VIX_c'] = 45
df_vix_days.loc[(df_vix_days['VIX'] >= 45) & (df_vix_days['VIX'] < 50), 'VIX_c'] = 50
df_vix_days.loc[(df_vix_days['VIX'] >= 50) & (df_vix_days['VIX'] < 55), 'VIX_c'] = 55
df_vix_days.loc[(df_vix_days['VIX'] >= 55) & (df_vix_days['VIX'] < 60), 'VIX_c'] = 60
df_vix_days.loc[(df_vix_days['VIX'] >= 60) & (df_vix_days['VIX'] < 65), 'VIX_c'] = 65
df_vix_days.loc[(df_vix_days['VIX'] >= 65) & (df_vix_days['VIX'] < 70), 'VIX_c'] = 70
df_vix_days.loc[(df_vix_days['VIX'] >= 70) & (df_vix_days['VIX'] < 75), 'VIX_c'] = 75
df_vix_days.loc[(df_vix_days['VIX'] >= 75) & (df_vix_days['VIX'] < 80), 'VIX_c'] = 80
df_vix_days.head(20)で先頭から20行を表示します。
df_vix_days.head(20)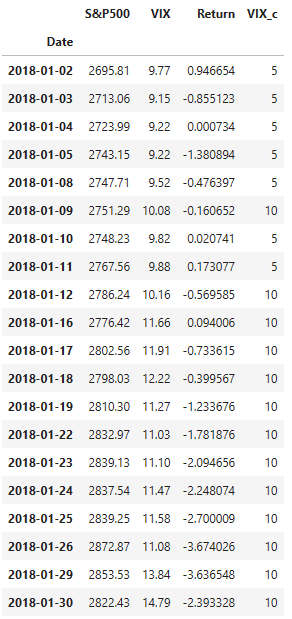
次に、plotlyを使ってグラフに表示していきます。plotlyについては、以前に描画方法と見た目に関わる設定について投稿しているので参考にしてもらえればと思います。
●plotlyでグラフを描画
2-1.散布図
# グラフの実体trace オブジェクトを生成
scatter_trace_A = go.Scatter(
x=df_vix_days['VIX'],
y=df_vix_days['Return'],
mode='markers',
marker=dict(
color='red',
size=8,
opacity=0.5
),
name='Return',
)
# レイアウトの追加
graph_layout = go.Layout(
# 幅と高さの設定
width=800, height=500,
# タイトルの設定
title=dict(
text='Relationship between VIS and S&P500 returns(USD base)', # タイトル
font=dict(family='Times New Roman', size=20, color='grey'), # フォントの指定
xref='paper', # container or paper
x=0.5,
y=0.87,
xanchor='center',
),
# x軸の設定
xaxis=dict(
# x軸のタイトルの設定
title=dict(text='VIX', font=dict(family='Times New Roman', size=20, color='grey'))
),
# y軸の設定
yaxis=dict(
# y軸のタイトルの設定
title=dict(text='Return after ' + str(days) + ' days', font=dict(family='Times New Roman', size=20, color='grey')),
range=[-30,55] # 軸の範囲の設定
),
# 凡例の設定
legend=dict(
xanchor='right',
yanchor='bottom',
x=0.95,
y=0.85,
orientation='h',
bgcolor='white',
bordercolor='grey',
borderwidth=1,
),
)
# 描画領域である figure オブジェクトの作成
fig = go.Figure(layout=graph_layout)
# add_trace()メソッドでグラフの実体を追加
fig.add_trace(scatter_trace_A)
# レイアウトの更新
fig.update_layout(plot_bgcolor='white')
# 軸の設定
# linecolorを設定して、ラインをミラーリング(mirror=True)して枠にする
fig.update_xaxes(linecolor='black', linewidth=1, mirror=True)
fig.update_yaxes(linecolor='black', linewidth=1, mirror=True)
# ticks='inside':目盛り内側, tickcolor:目盛りの色, tickwidth:目盛りの幅、ticklen:目盛りの長さ
fig.update_xaxes(ticks='inside', tickcolor='black', tickwidth=1, ticklen=5)
fig.update_yaxes(ticks='inside', tickcolor='black', tickwidth=1, ticklen=5)
# gridcolor:グリッドの色, gridwidth:グリッドの幅、griddash='dot':破線
fig.update_xaxes(gridcolor='lightgrey', gridwidth=1, griddash='dot')
fig.update_yaxes(gridcolor='lightgrey', gridwidth=1, griddash='dot')
# 軸の文字サイズ変更
fig.update_xaxes(tickfont=dict(size=15, color='grey'))
fig.update_yaxes(tickfont=dict(size=15, color='grey'))
# show()メソッドでグラフを描画
fig.show()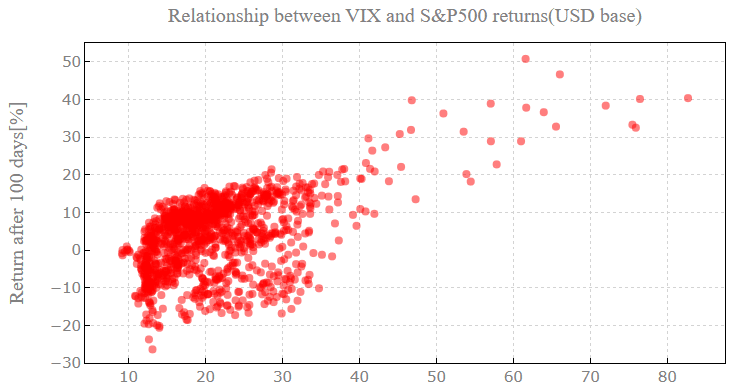
VIXの上昇とともに100日後のリターンが大きい傾向がみられます。特にVIXが40以上では、リターンがマイナスになってないことも確認できます。
2-2.VIXの範囲ごとの箱ひげ図
# グラフの実体trace オブジェクトを生成
box_trace_A = go.Box(
    x=df_vix_days['VIX_c'],
    y=df_vix_days['Return'],

    name='Return',
)


# レイアウトの追加
graph_layout = go.Layout(

    # 幅と高さの設定
    width=800, height=500,

    # タイトルの設定
    title=dict(
        text='Relationship between VIX and S&P500 returns(USD base)', # タイトル
        font=dict(family='Times New Roman', size=20, color='grey'), # フォントの指定
        xref='paper', # container or paper
        x=0.5,
        y=0.87,
        xanchor='center',
    ),


    # x軸の設定
    xaxis=dict(
        # x軸のタイトルの設定
        title=dict(text='VIX', font=dict(family='Times New Roman', size=20, color='grey'))
    ),

    # y軸の設定
    yaxis=dict(
        # y軸のタイトルの設定
        title=dict(text='Return after ' + str(days) + ' days[%]', font=dict(family='Times New Roman', size=20, color='grey')),
        range=[-30,55] # 軸の範囲の設定
    ),

    # 凡例の設定
    legend=dict(
        xanchor='right',
        yanchor='bottom',
        x=0.95,
        y=0.85,
        orientation='h',
        bgcolor='white',
        bordercolor='grey',
        borderwidth=1,
    ),

)


# 描画領域である figure オブジェクトの作成
fig = go.Figure(layout=graph_layout)


# add_trace()メソッドでグラフの実体を追加
fig.add_trace(box_trace_A)

# レイアウトの更新
fig.update_layout(plot_bgcolor='white')


# 軸の設定
# linecolorを設定して、ラインをミラーリング(mirror=True)して枠にする
fig.update_xaxes(linecolor='black', linewidth=1, mirror=True)
fig.update_yaxes(linecolor='black', linewidth=1, mirror=True)

# ticks='inside':目盛り内側, tickcolor:目盛りの色, tickwidth:目盛りの幅、ticklen:目盛りの長さ
fig.update_xaxes(ticks='inside', tickcolor='black', tickwidth=1, ticklen=5)
fig.update_yaxes(ticks='inside', tickcolor='black', tickwidth=1, ticklen=5)

# gridcolor:グリッドの色, gridwidth:グリッドの幅、griddash='dot':破線
fig.update_xaxes(gridcolor='lightgrey', gridwidth=1, griddash='dot')
fig.update_yaxes(gridcolor='lightgrey', gridwidth=1, griddash='dot')

# tick0:初期軸目盛り, dtick:軸目盛り間隔
fig.update_xaxes(tickvals=[0,5,10,15,20,25,30,35,40,45,50,55,60,65,70,75])  # tickvals:任意の設定値にする

# 軸の文字サイズ変更
fig.update_xaxes(tickfont=dict(size=15, color='grey'))
fig.update_yaxes(tickfont=dict(size=15, color='grey'))

# show()メソッドでグラフを描画
fig.show()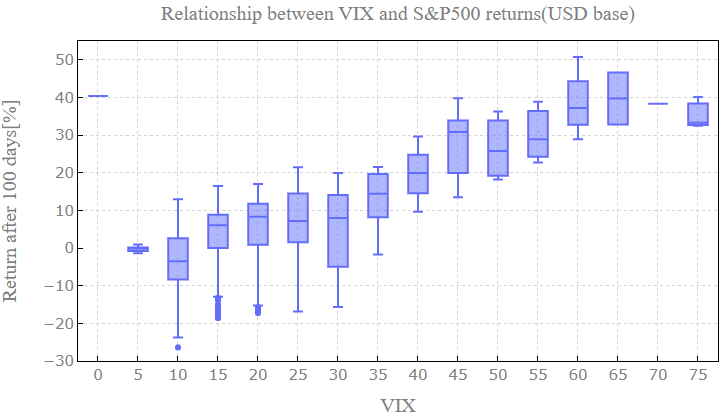
VIXが40以上では、リターンがマイナスになっておらず、安定したリターンが得られていることが確認できます。
3.VIX指数の範囲とS&P500の1ヶ月、3カ月、6カ月、12か月後の平均リターンの関係を確認する
1ヶ月、3カ月、6カ月、12か月後のリターンを求めるうえで、1ヶ月を20営業日として、20日後、60日後、120日後、250日後のリターンとして分析を行うこととします。20営業日後の株価は、
((df['S&P500'].shift(-20) - df['S&P500']) / df['S&P500'])*100
で算出されます。続いて、VIXの5刻み範囲の代表値をVIX_c カラムに入れる。
df_vix=df.copy()

# 1カ月後、3カ月後、6か月後、12か月後のリターンの計算
df_vix['return_1M'] = ((df_vix['S&P500'].shift(-20) - df_vix['S&P500']) / df_vix['S&P500'])*100
df_vix['return_3M'] = ((df_vix['S&P500'].shift(-60) - df_vix['S&P500']) / df_vix['S&P500'])*100
df_vix['return_6M'] = ((df_vix['S&P500'].shift(-120) - df_vix['S&P500']) / df_vix['S&P500'])*100
df_vix['return_12M'] = ((df_vix['S&P500'].shift(-250) - df_vix['S&P500']) / df_vix['S&P500'])*100
df_vix.head(20)で先頭から20行を表示します。
df_vix.head(20)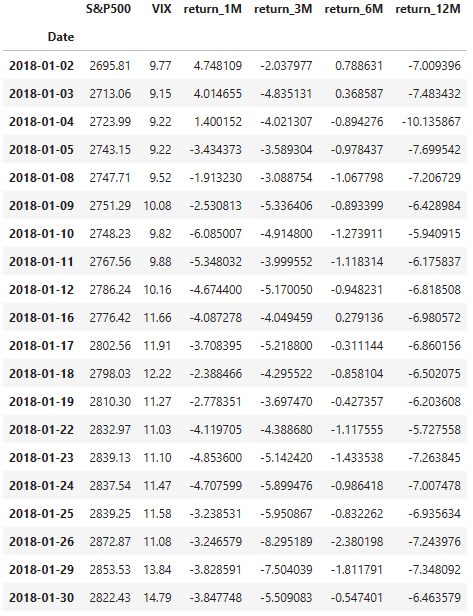
VIXの範囲に応じたリターンの平均値を算出します。
x = np.array(['1ヵ月後の平均リターン', '3ヵ月後の平均リターン', '6ヵ月後の平均リターン', '12ヵ月後の平均リターン'])

# VISの範囲に応じたリターンの平均値の算出
return_1M_A = df_vix[df_vix['VIX']<20]['return_1M'].mean()
return_1M_B = df_vix[(df_vix['VIX']>=20) & (df_vix['VIX']<40)]['return_1M'].mean()
return_1M_C = df_vix[(df_vix['VIX']>=40) & (df_vix['VIX']<60)]['return_1M'].mean()
return_1M_D = df_vix[df_vix['VIX']>60]['return_1M'].mean()

return_3M_A = df_vix[df_vix['VIX']<20]['return_3M'].mean()
return_3M_B = df_vix[(df_vix['VIX']>=20) & (df_vix['VIX']<40)]['return_3M'].mean()
return_3M_C = df_vix[(df_vix['VIX']>=40) & (df_vix['VIX']<60)]['return_3M'].mean()
return_3M_D = df_vix[df_vix['VIX']>60]['return_3M'].mean()

return_6M_A = df_vix[df_vix['VIX']<20]['return_6M'].mean()
return_6M_B = df_vix[(df_vix['VIX']>=20) & (df_vix['VIX']<40)]['return_6M'].mean()
return_6M_C = df_vix[(df_vix['VIX']>=40) & (df_vix['VIX']<60)]['return_6M'].mean()
return_6M_D = df_vix[df_vix['VIX']>60]['return_6M'].mean()

return_12M_A = df_vix[df_vix['VIX']<20]['return_12M'].mean()
return_12M_B = df_vix[(df_vix['VIX']>=20) & (df_vix['VIX']<40)]['return_12M'].mean()
return_12M_C = df_vix[(df_vix['VIX']>=40) & (df_vix['VIX']<60)]['return_12M'].mean()
return_12M_D = df_vix[df_vix['VIX']>60]['return_12M'].mean()

# 算出した平均値を配列に格納
y_A = np.array([eturn_1M_A, return_3M_A, return_6M_A, return_12M_A])
y_B = np.array([return_1M_B, return_3M_B, return_6M_B, return_12M_B])
y_C = np.array([return_1M_C, return_3M_C, return_6M_C, return_12M_C])
y_D = np.array([return_1M_D, return_3M_D, return_6M_D, return_12M_D])
●plotlyでグラフを描画
# グラフの実体trace オブジェクトを生成
bar_trace_A = go.Bar(
    x=x,
    y=y_A,

    name='VIX20未満',
)

bar_trace_B = go.Bar(
    x=x,
    y=y_B,

    name='VIX20以上40未満',
)

bar_trace_C = go.Bar(
    x=x,
    y=y_C,

    name='VIX40以上60未満',
)

bar_trace_D = go.Bar(
    x=x,
    y=y_D,

    name='VIX60以上',
)


# レイアウトの追加
graph_layout = go.Layout(

    # 幅と高さの設定
    width=800, height=500,


    # x軸の設定
    xaxis=dict(
        # x軸のタイトルの設定
    ),

    # y軸の設定
    yaxis=dict(
        # y軸のタイトルの設定
        title=dict(text='平均リターン', font=dict(family='Times New Roman', size=20, color='grey')),
        range=[0,70] # 軸の範囲の設定
    ),

    # 凡例の設定
    legend=dict(
        xanchor='left',
        yanchor='top',
        x=0.01,
        y=0.98,
        orientation='v',
        bgcolor='white',
        bordercolor='grey',
        borderwidth=1,
    ),

)


# 描画領域である figure オブジェクトの作成
fig = go.Figure(layout=graph_layout)


# add_trace()メソッドでグラフの実体を追加
fig.add_trace(bar_trace_A)
fig.add_trace(bar_trace_B)
fig.add_trace(bar_trace_C)
fig.add_trace(bar_trace_D)


# レイアウトの更新
fig.update_layout(plot_bgcolor='white')


# 軸の設定
# linecolorを設定して、ラインをミラーリング(mirror=True)して枠にする
fig.update_xaxes(linecolor='black', linewidth=1, mirror=True)
fig.update_yaxes(linecolor='black', linewidth=1, mirror=True)

# ticks='inside':目盛り内側, tickcolor:目盛りの色, tickwidth:目盛りの幅、ticklen:目盛りの長さ
fig.update_xaxes(ticks='inside', tickcolor='black', tickwidth=1, ticklen=5)
fig.update_yaxes(ticks='inside', tickcolor='black', tickwidth=1, ticklen=5)

# gridcolor:グリッドの色, gridwidth:グリッドの幅、griddash='dot':破線
fig.update_xaxes(gridcolor='lightgrey', gridwidth=1, griddash='dot')
fig.update_yaxes(gridcolor='lightgrey', gridwidth=1, griddash='dot')

# 軸の文字サイズ変更
fig.update_xaxes(tickfont=dict(size=15, color='grey'))
fig.update_yaxes(tickfont=dict(size=15, color='grey'))

# show()メソッドでグラフを描画
fig.show()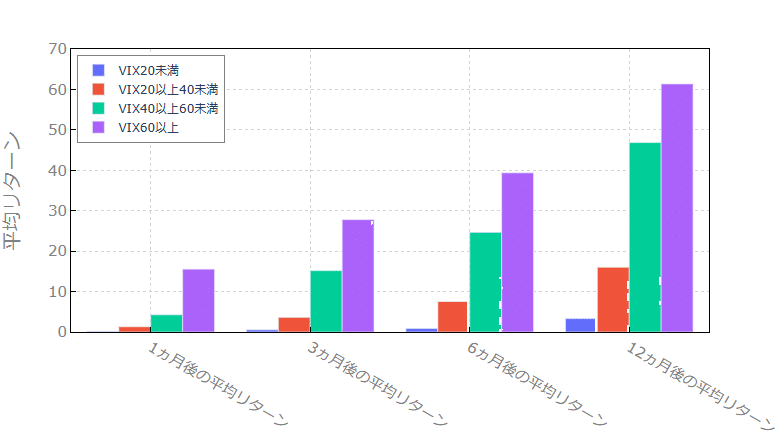
先程はVIXの上昇とともに100日後のリターンが大きい傾向がみられたが、1ヶ月、3カ月、6カ月、12か月後のいづれにおいても同様の傾向が確認できた。そして、1ヶ月、3カ月、6カ月、12か月とそのあとの期間が長いほどリターンが大きくなっていることがわかる。このあたりは、S&P500がデータの取得区間において右肩上がりの傾向で株価があがっていることに起因しているように思えます。
今回は、VIX指数とS&P500のリターンの関係を確認してみたが、今後はVIXを活用した投資パターンを作成して投資シミュレーションを行っていきたいと思います。
