
【Python】【相場】VIX指数およびSKEW指数を取得して可視化し、SP500との関係を確認する
SP500の株価とVIX 指数、SKEW指数の推移をグラフに描画し、それらとSP500との関係を確認したいと思います。
VIXは、CBOE Volatility Index(CBOEボラティリティ指数)を表します。これは、オプション市場のボラティリティを測定する指数であり、市場の恐怖心や不安のレベルを示すことで知られています。
SKEWは、CBOE SKEW Index(CBOEスキュー指数)を表します。これは、市場参加者の長期的なリスクに関する見通しを提供する指数です。高いスキュー値は、大きな下落のリスクが増加していることを示唆します。
なお、最低限のポイントのみの説明にするため、Pythonライブラリ、モジュール等のインストール方法については割愛させて頂きます。お使いのPC環境等に合わせてインストールしてもらえればと思います。
1.SP500とVIX指数とSKEW指数を取得して推移を確認する
SP500とVIX指数とSKEW指数を取得するために、pandas-datareaderとyfinanceを使用します。stooqおよびyfinanceより取得する日付範囲と取得するコードを指定して株価情報を取得します。
株価取得開始日:start = '2018-01-01'
株価取得終了日:end = datetime.date.today()(今日の日付を取得)
各種ライブラリをインポートします。
import pandas_datareader.data as web
import yfinance as yf
import datetime
import pandas as pd

import matplotlib.pyplot as plt
from matplotlib import gridspec
import japanize_matplotlib
%matplotlib inline
SP500とVIX指数とSKEW指数のティッカーコードをリストに格納します。
# 確認対象銘柄

# stooqより取得
codelists_stooq = [
    "^SPX", # S&P 500
]

# yahoofinanceより取得
codelists_yf = [
    "^VIX", # VIX index
    "^SKEW", # SKEW index
]
現在の日時を最終日とし、2018年1月1日を開始日として、stooqとyfinanceからSP500とVIX指数とSKEW指数を取得します。そして、stooqとyfinanceから取得したデータを結合します。
# 2018/1/1から現在まで
start = '2018-01-01'
end = datetime.date.today()

# データ取得(stooq)
_df_stooq = web.DataReader(codelists_stooq, 'stooq', start, end)['Close']

# 日付を昇順に並び替える
_df_stooq.sort_index(inplace=True)

# データ取得(yahoo finance)
_df_yahoo = yf.download(codelists_yf, start, end)['Adj Close']

df = pd.DataFrame()
df = pd.merge(_df_stooq, _df_yahoo, on='Date', how='outer')

df.columns = ['S&P500', 'SKEW', 'VIX']
データを描画します。
plt.figure(figsize=(10,8))

# 余白を設定
plt.subplots_adjust(wspace=0.4, hspace=0.6)

# グラフの描画
plt.subplot(3,1,1)
plt.plot(df['S&P500'], label='SP500')
plt.title('SP500')
plt.legend()
plt.grid(True)

plt.subplot(3,1,2)
plt.plot(df['VIX'], label='VIX')
plt.title('VIX')
plt.legend()
plt.grid(True)

plt.subplot(3,1,3)
plt.plot(df['SKEW'], label='SKEW')
plt.title('SKEW')
plt.legend()
plt.grid(True)

plt.show()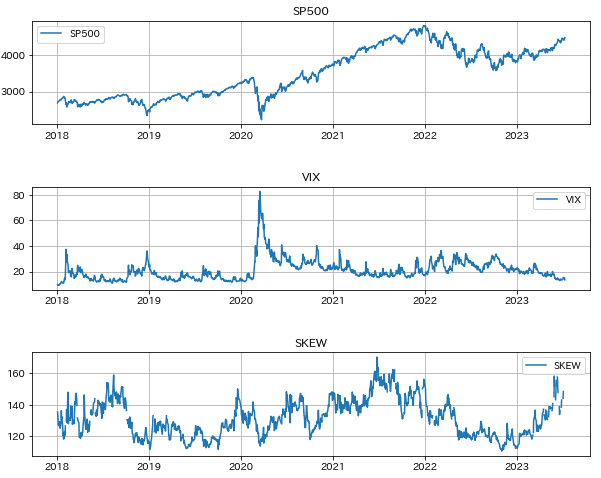
次に、plotlyを使ってグラフに表示していきます。plotlyについては、以前に描画方法と見た目に関わる設定について投稿しているので参考にしてもらえればと思います。
●plotlyでグラフを描画
https://note.com/scilabcafe/n/n33ab918f9cda
1-1.SP500とVIXの関係
import plotly.graph_objects as go  # グラフ表示関連ライブラリ
import plotly.io as pio  # 入出力関連ライブラリ
pio.renderers.default = 'iframe'

# subplot
from plotly.subplots import make_subplots


# グラフの実体trace オブジェクトを生成
sp500_trace = go.Scatter(
    x=df.index,
    y=df['S&P500'],
    mode='lines',
    line=dict(color='blue', width=5),
    name='S&P500'
)


# グラフの実体trace オブジェクトを生成
skew_trace = go.Scatter(
    x=df.index,
    y=df['SKEW'],
    mode='lines',
    line=dict(color='red', width=5),
    name='SKEW'
)

# グラフの実体となる trace オブジェクトを生成
vix_trace = go.Scatter(
    x=df.index,
    y=df['VIX'],
    mode='lines',
    line=dict(color='red', width=5),
    name='VIX'
)

# 2つ目の軸を表示する設定
fig = make_subplots(specs=[[{"secondary_y": True}]])


# 描画領域である figure オブジェクトの作成
fig.add_trace(sp500_trace, secondary_y=False)  # 第1軸に設定(secondary_y=False)
fig.add_trace(vix_trace, secondary_y=True)  # 第2軸に設定(secondary_y=True)


# レイアウトの更新
fig.update_layout(

    # 凡例
    showlegend=True,

    # 幅と高さの設定
    width=900,height=600,

    # タイトルの設定
    title=dict(
        text='SP500とVIXの関係', # タイトル
        font=dict(family='Times New Roman', size=20, color='grey'), # フォントの指定
        xref='paper', # container or paper
        x=0.45,
        y=0.9,
        xanchor='center',
    ),

    plot_bgcolor='white', # 背景色を白に設定

    # 凡例の設定
    legend=dict(
        xanchor='right',
        yanchor='bottom',
        x=0.5,
        y=0.85,
        orientation='v',
        bgcolor='white',
        bordercolor='grey',
        borderwidth=1,
    ),

),

# 軸の設定
fig.update_yaxes(title='SP500', secondary_y=False)
fig.update_yaxes(title='VIX index', secondary_y=True)


# linecolorを設定して、ラインをミラーリング(mirror=True)して枠にする
fig.update_xaxes(linecolor='black', linewidth=1, mirror=True)
fig.update_yaxes(linecolor='black', linewidth=1, mirror=True)

fig.update_xaxes(linecolor='black', linewidth=1, mirror=True)
fig.update_yaxes(linecolor='black', linewidth=1, mirror=True)


# ticks='inside':目盛り内側, tickcolor:目盛りの色, tickwidth:目盛りの幅、ticklen:目盛りの長さ
fig.update_xaxes(ticks='inside', tickcolor='black', tickwidth=1, ticklen=5)
fig.update_yaxes(ticks='inside', tickcolor='black', tickwidth=1, ticklen=5)

fig.update_xaxes(ticks='inside', tickcolor='black', tickwidth=1, ticklen=5)
fig.update_yaxes(ticks='inside', tickcolor='black', tickwidth=1, ticklen=5)


# gridcolor:グリッドの色, gridwidth:グリッドの幅、griddash='dot':破線
fig.update_xaxes(gridcolor='lightgrey', gridwidth=1, griddash='dot')
fig.update_yaxes(gridcolor='lightgrey', gridwidth=1, griddash='dot')

fig.update_xaxes(gridcolor='lightgrey', gridwidth=1, griddash='dot')
fig.update_yaxes(gridcolor='lightgrey', gridwidth=1, griddash='dot')


# tick0:初期軸目盛り, dtick:軸目盛り間隔
fig.update_xaxes(dtick='M12')  # 12カ月ごと

# 軸の文字サイズ変更
fig.update_xaxes(tickfont=dict(size=14, color='grey'))
fig.update_yaxes(tickfont=dict(size=18, color='grey'))

# show()メソッドでグラフを描画
fig.show()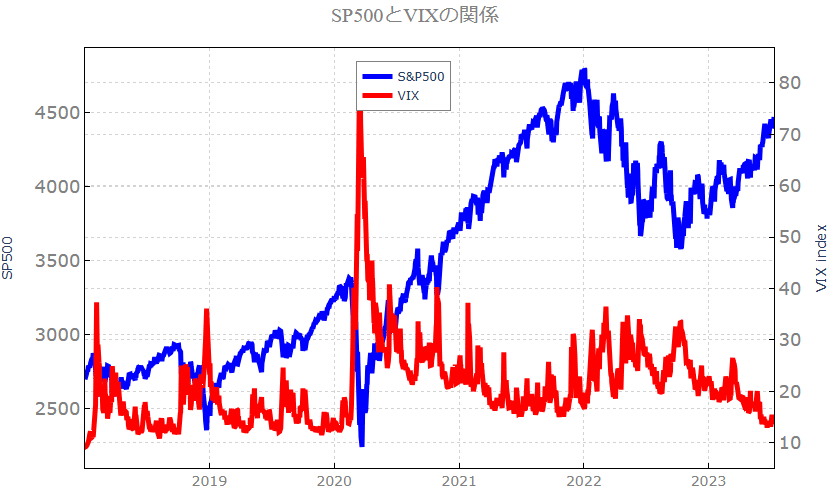
VIXが急上昇したときにSP500が暴落している傾向がみられVIXとSP500は逆相関の関係があるように思われます。
1-2.SP500とSKEWの関係
# 2つ目の軸を表示する設定
fig = make_subplots(specs=[[{"secondary_y": True}]])


# 描画領域である figure オブジェクトの作成
fig.add_trace(sp500_trace, secondary_y=False)  # 第1軸に設定(secondary_y=False)
fig.add_trace(skew_trace, secondary_y=True)  # 第2軸に設定(secondary_y=True)


# レイアウトの更新
fig.update_layout(

    # 凡例
    showlegend=True,

    # 幅と高さの設定
    width=900,height=600,

    # タイトルの設定
    title=dict(
        text='SP500とSKEWの関係', # タイトル
        font=dict(family='Times New Roman', size=20, color='grey'), # フォントの指定
        xref='paper', # container or paper
        x=0.45,
        y=0.9,
        xanchor='center',
    ),

    plot_bgcolor='white', # 背景色を白に設定

    # 凡例の設定
    legend=dict(
        xanchor='right',
        yanchor='bottom',
        x=0.5,
        y=0.85,
        orientation='v',
        bgcolor='white',
        bordercolor='grey',
        borderwidth=1,
    ),

),


# 軸の設定
fig.update_yaxes(title='SP500', secondary_y=False)
fig.update_yaxes(title='SKEW index', secondary_y=True)


# linecolorを設定して、ラインをミラーリング(mirror=True)して枠にする
fig.update_xaxes(linecolor='black', linewidth=1, mirror=True)
fig.update_yaxes(linecolor='black', linewidth=1, mirror=True)

fig.update_xaxes(linecolor='black', linewidth=1, mirror=True)
fig.update_yaxes(linecolor='black', linewidth=1, mirror=True)


# ticks='inside':目盛り内側, tickcolor:目盛りの色, tickwidth:目盛りの幅、ticklen:目盛りの長さ
fig.update_xaxes(ticks='inside', tickcolor='black', tickwidth=1, ticklen=5)
fig.update_yaxes(ticks='inside', tickcolor='black', tickwidth=1, ticklen=5)

fig.update_xaxes(ticks='inside', tickcolor='black', tickwidth=1, ticklen=5)
fig.update_yaxes(ticks='inside', tickcolor='black', tickwidth=1, ticklen=5)


# gridcolor:グリッドの色, gridwidth:グリッドの幅、griddash='dot':破線
fig.update_xaxes(gridcolor='lightgrey', gridwidth=1, griddash='dot')
fig.update_yaxes(gridcolor='lightgrey', gridwidth=1, griddash='dot')

fig.update_xaxes(gridcolor='lightgrey', gridwidth=1, griddash='dot')
fig.update_yaxes(gridcolor='lightgrey', gridwidth=1, griddash='dot')


# tick0:初期軸目盛り, dtick:軸目盛り間隔
fig.update_xaxes(dtick='M12')  # 12カ月ごと

# 軸の文字サイズ変更
fig.update_xaxes(tickfont=dict(size=14, color='grey'))
fig.update_yaxes(tickfont=dict(size=18, color='grey'))

# show()メソッドでグラフを描画
fig.show()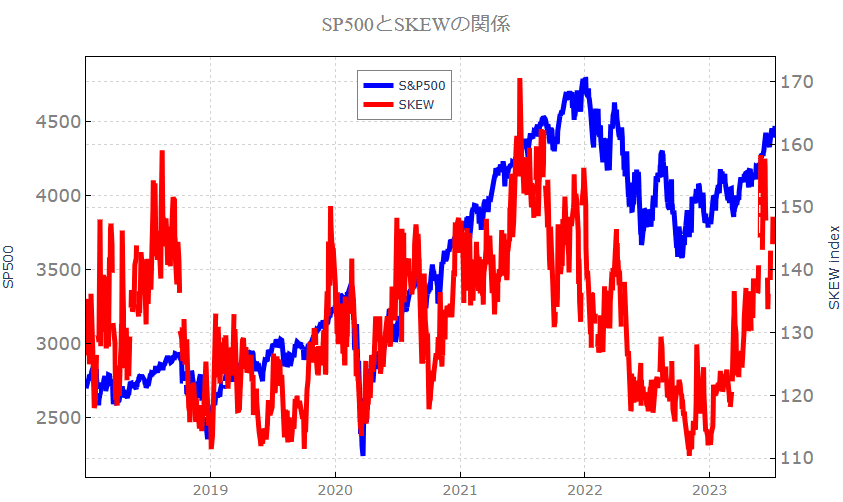
SKEW指数とSP500には、ある程度の相関があるように思われます。相関の強さは後ほど相関係数で確認したいと思います。
2.VIX指数の分布を描画し、最新のVIX指数をインジケータ表示で確認する
2-1.VIX指数の分布
# グラフィック系ライブラリ
import plotly.graph_objects as go  # グラフ表示関連ライブラリ
import plotly.io as pio  # 入出力関連ライブラリ
pio.renderers.default = 'iframe'


# グラフの実体となる trace オブジェクトを生成
hist_trace = go.Histogram(
    x=df['VIX'],
    histnorm='probability',
    nbinsx=40)


# レイアウトオブジェクトを生成
graph_layout = go.Layout(

    # 幅と高さの設定
    width=800, height=500,

    # タイトルの設定
    title=dict(
        text='VIX distribution', # タイトル
        font=dict(family='Times New Roman', size=20, color='grey'), # フォントの指定
        xref='paper', # container or paper
        x=0.5,
        y=0.87,
        xanchor='center',
    ),

    # y軸の設定
    yaxis=dict(
        # y軸のタイトルの設定
        title=dict(text='probability', font=dict(family='Times New Roman', size=20, color='grey')),
    ),

)


# 描画領域である figure オブジェクトの作成
fig = go.Figure(layout=graph_layout)


# add_trace()メソッドでグラフの実体を追加
fig.add_trace(hist_trace)


# レイアウトの更新
fig.update_layout(
    plot_bgcolor='white', # 背景色を白に設定
)


# 軸の設定
# linecolorを設定して、ラインをミラーリング(mirror=True)して枠にする
fig.update_xaxes(linecolor='black', linewidth=1, mirror=True)
fig.update_yaxes(linecolor='black', linewidth=1, mirror=True)


# ticks='inside':目盛り内側, tickcolor:目盛りの色, tickwidth:目盛りの幅、ticklen:目盛りの長さ
fig.update_xaxes(ticks='inside', tickcolor='black', tickwidth=1, ticklen=5)
fig.update_yaxes(ticks='inside', tickcolor='black', tickwidth=1, ticklen=5)


# gridcolor:グリッドの色, gridwidth:グリッドの幅、griddash='dot':破線
fig.update_xaxes(gridcolor='lightgrey', gridwidth=1, griddash='dot')
fig.update_yaxes(gridcolor='lightgrey', gridwidth=1, griddash='dot')


# 軸の文字サイズ変更
fig.update_xaxes(tickfont=dict(size=15, color='grey'))
fig.update_yaxes(tickfont=dict(size=15, color='grey'))


# show()メソッドでグラフを描画
fig.show()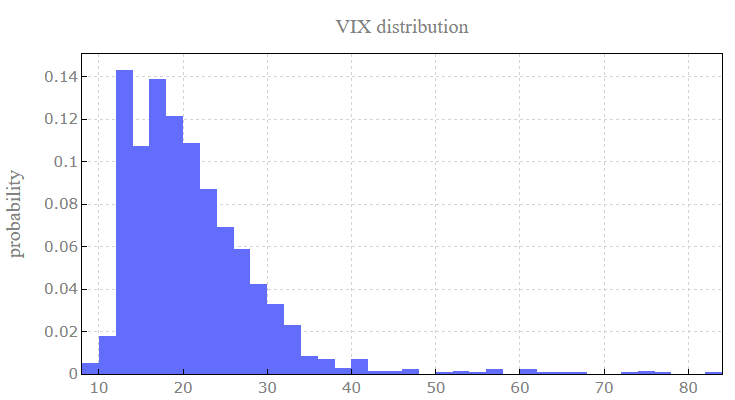
2-2.最新のVIX指数をインジケータ表示
30を超えると悲観論が拡大している時期です。現時点ではVIXは13.5で楽観レベルにあると言えそうです。
# データの前処理
latest_value = df['VIX'][-1]  # 最新のVIX指数の値

# ゲージチャートの描画
fig = go.Figure(go.Indicator(
    mode="gauge+number",
    value=latest_value,
    domain={'x': [0, 1], 'y': [0, 1]},
    gauge={'axis': {'range': [0, 100]},
           'steps': [{'range': [0, 20], 'color': 'green'},
                     {'range': [20, 30], 'color': 'yellow'},
                     {'range': [30, 60], 'color': 'orange'},
                     {'range': [60, 100], 'color': 'red'}],
           'threshold': {'line': {'color': 'black', 'width': 4}, 'thickness': 0.75, 'value': latest_value}}))

fig.update_layout(title='VIX Volatility Index', title_x=0.5)


# ゲージチャートを表示
fig.show()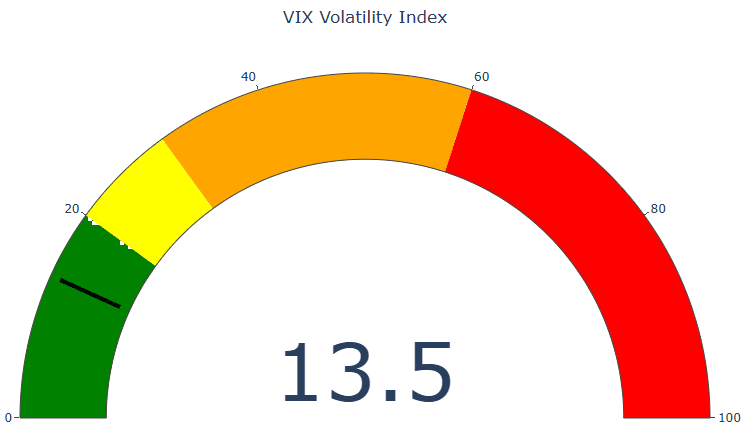
3.VIX指数、SKEW指数、S&P500間の相関を確認する
VIX指数、SKEW指数、S&P500間の相関を確認するには、dfに対してcorrメソッドを適用することで可能になります。
df.corr() # 相関関係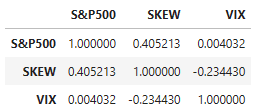
次に、相関係数の関係をヒートマップで可視化します。
import seaborn as sns
cor = df.corr()
sns.heatmap(cor, cmap= sns.color_palette('coolwarm', 10), annot=True,fmt='.2f', vmin = -1, vmax = 1)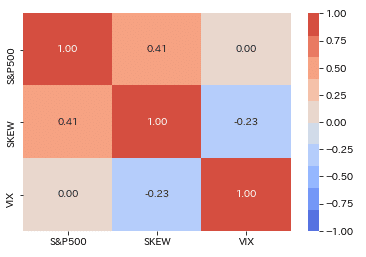
SKEW指数とSP500には、グラフからも確認できたように弱い相関はありそうです。VIX指数とSP500には、グラフからはVIXが急上昇したときにSP500が暴落している傾向がみられVIXとSP500は逆相関の関係があるように思われましたが、相関係数からはほぼ無相関に近そうです。VIX急上昇の際には暴落に注意が必要かもしれません。
今回は、VIXおよびSKEW指数を取得して値の推移をグラフにすると共に、VIXの直近の値を直感的に確認するためインジケーター表示で可視化しました。また、VIX、SKEW指数とS&P500間の相関係数を算出し、ヒートマップで可視化を行いました。今後は、リターンとの関係などもっと詳細な分析を行っていきたいと思います。
