
新NISA SP500,FANG+,インド株のシミュレーション
サブテーマ:インド株の指数の違いも調べました。
1 初めに
安定したリターンを望む場合、SP500一択では、米国次第で、想定するリターンがまったく得られない可能性があります。そこで、SP500の代わりにインド株を組み入れ、モンテカルロシミュレーションではシミュレーションできない、安定したリターンが見込めるポートフォリオを検討します。
最適な効率は、過去の記事の通り、シャープレシオを最大にする場合です。それだと確かに良いのですが、FANG+の割合が大きくなりすぎ、インドもどうなるかは不透明なところがありますので、今回は2つのパターンで報告します。
なお、この組み合わせ前については、単独でYoutubeの動画にしてます。こちらもよろしければ参照ください。
今回のまとめ:
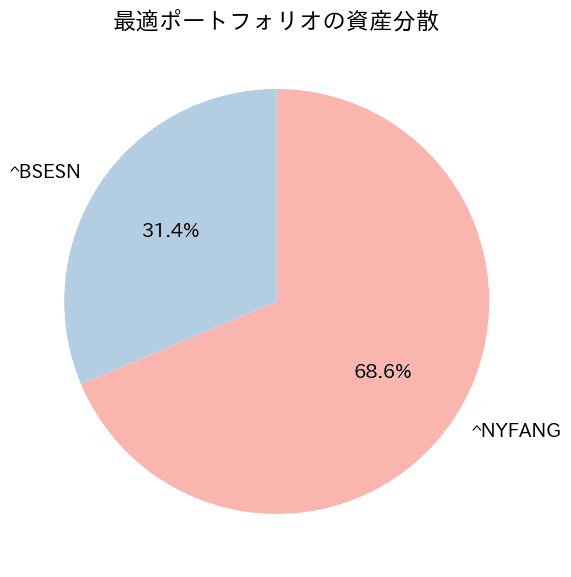
最適ポートフォリオ:FANG+68%、インド31%
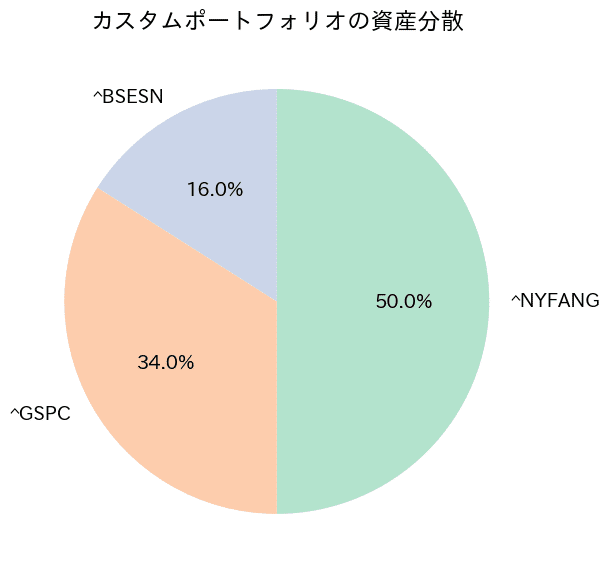
カスタムポートフォリオ:FANG:50%、SP500:34%、インド16%
*インド指数^BSESN、FANG+^NYFANG、SP500 ^GSPC
このチャンネルでは直近よりアウトプットを重視して、本文はPYTHONコードに触れず結果をご報告します。コード全文は最下部に公開しておきます。再現性を確保するため、GoogleColabを使って実行した結果としています。PYTHONを使ってみたい方勉強してみたい方はまずはコピペでぜひ触ってみてください。
あとユーチューブも始めてみました。動画は不慣れですが、このチャンネルでのマスコットキャラクターを使って、これまでの記事をより分かりやすく紹介します。まだまだ動画数は少ないですが、いずれこの記事の内容も動画にしたいと思ってます。ぜひ見ていただき、率直なご意見を頂けるとありがたい限りです。

2 豆知識
1)インド株の指数Nifty50とBSE SENSEXの違い
1️⃣ 概要
Nifty50:NSE(ナショナル証券取引所)のインデックス。50銘柄で構成され、インドの多様なセクターを代表。
BSE SENSEX:BSE(ボンベイ証券取引所)のインデックス。30銘柄で構成され、インドの主要大企業を中心に採用。
2️⃣ セクターの違い
Nifty50:ITや新興分野の割合が高く、金融(38%)、IT(16%)、消費財(12%)が中心。
BSE SENSEX:金融(40%)、消費財(15%)、IT(15%)の割合が高く、伝統的な大企業の比率が大きい。
3️⃣ 銘柄の違い
Nifty50:より多くのセクターをカバーし、TCS、Infosys、HDFC Bank、Relianceなど多様な企業が含まれる。
BSE SENSEX:TCS、Reliance、HDFC Bank、HULなど、特に大手企業が中心。
4️⃣ 投資戦略の違い
Nifty50:セクターの分散効果が高く、長期分散投資向き。
BSE SENSEX:大企業に集中しているため、安定志向の投資家向き。
5️⃣ どちらを選ぶべきか?
成長分野に投資したいなら → Nifty50
大企業の安定的な成長を追いたいなら → BSE SENSEX
まとめ
Nifty50は多様なセクターと分散投資に強みがあり、BSE SENSEXはインドの主要大企業の成長を把握するのに最適な指数です。投資戦略に応じて、どちらを選ぶかが決まります。
3 実践
1)実行内容
まず、インド株を、Nifty50とSENSEX指数の実績を確認しました。
その後、インド株を大型安定のBSE SENSEXとして、FANG+、SP500とのリターンやリスク、シャープレシオ、最大ドローダウンを調査します。
データは各指数の値をYahoofinaceUSから取得して加工しています。
また最適なポートフォリオは、シャープレシオが最大となる組み合わせを出力させています。
2)インド株の指数の比較
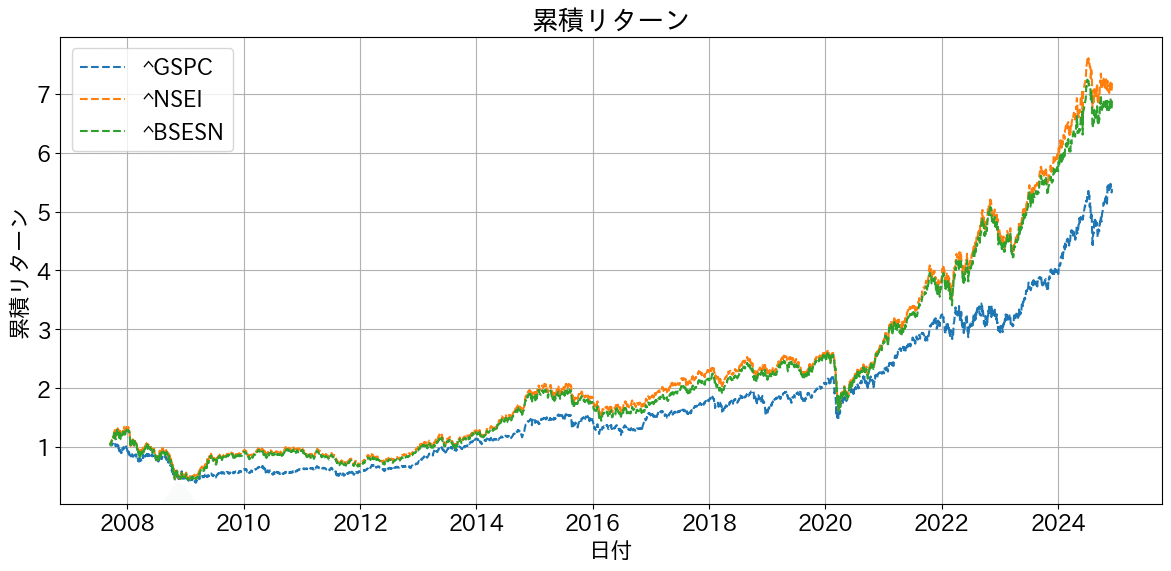
Nifty50(^NESI) と BSE SENSEX(^BSESN)、 比較として、SP500(^GSPC)の実際のリターンの指数の比較結果がこちらです。どちらも同じ様なリターンですが、直近はNifty50がよさそうです。
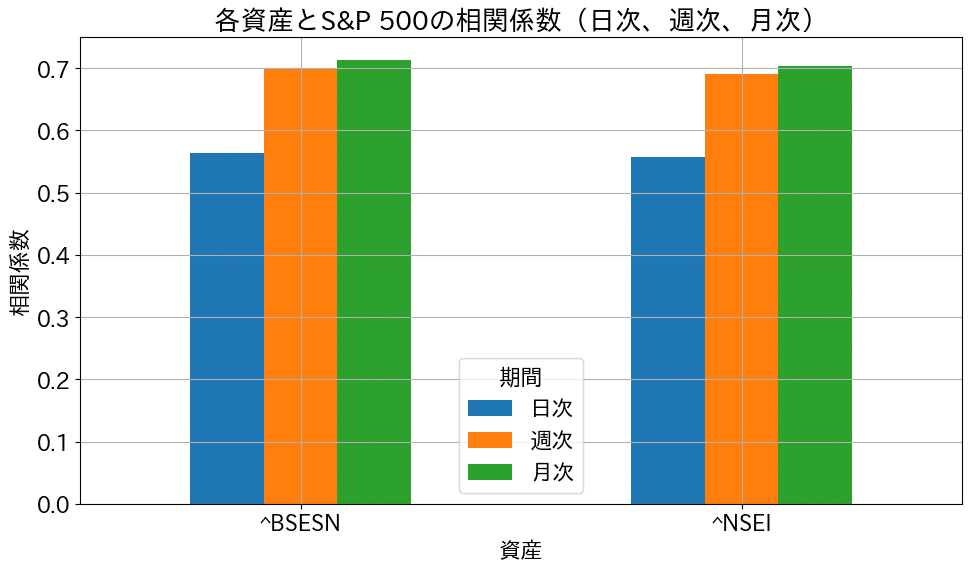
またSP500との相関係数を、日次、週次、月次で出力した結果がこちらです。その結果、日次では0.55程度ですが、週次・月次はどちらも0.7程度と株式の中では相関がやや低い傾向でした。
2)結果
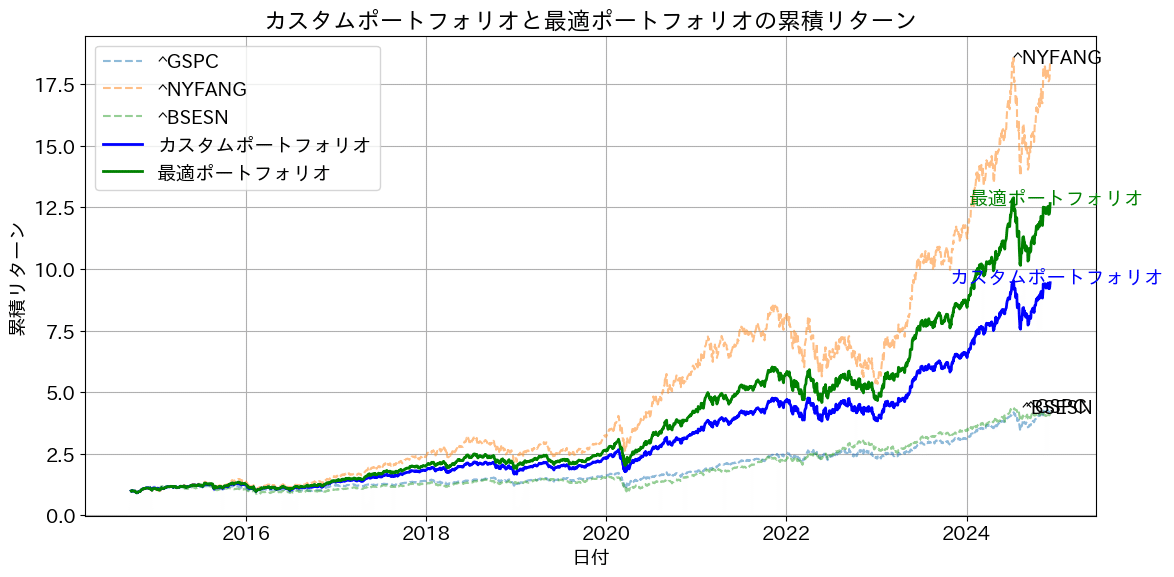
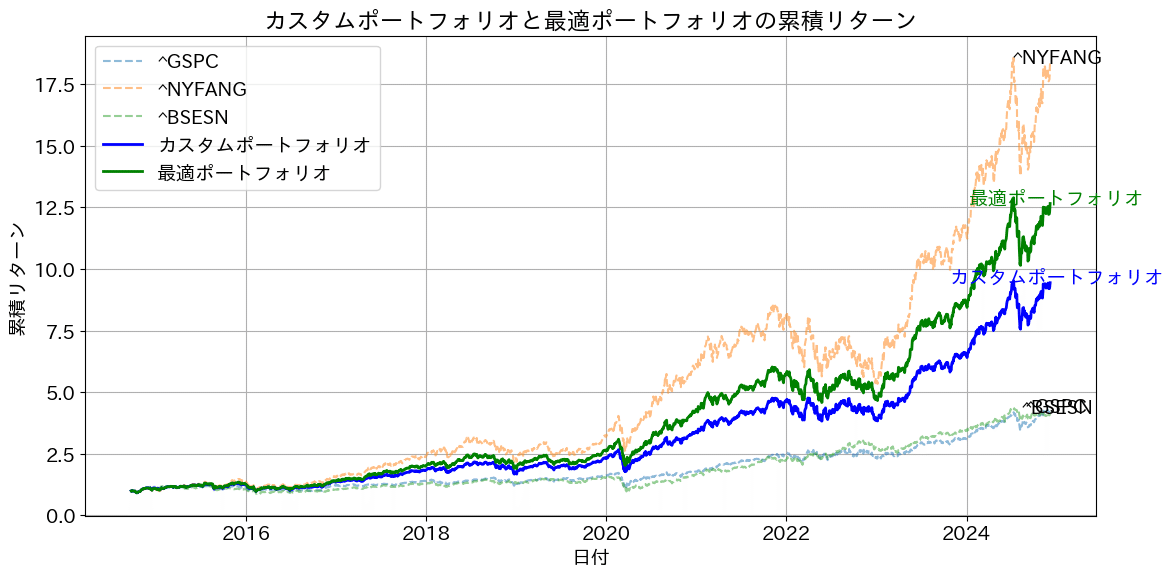
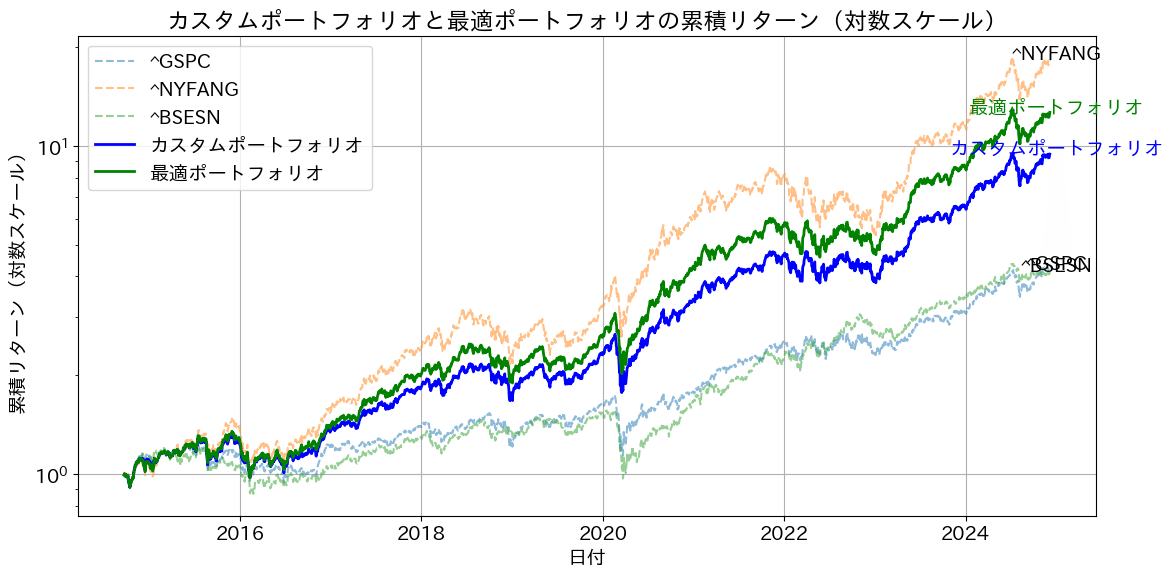
次に、FANG+、SP500、インド株での出力結果は下記のとおりです。まず、インド株BSESNは、SP500と同程度です。FANG+のリターンがすさまじく、シャープレシオに優れるため、最適な組み合わせを算出すると、SP500は無視されてしまいます。
そのため、カスタムポートフォリオとして、FANG+50%、SP500 36%、インド株16%(3:2:1)の場合のグラフも併せて出力させています。
その結果、SP500、インド株を使用して安定して成長できる組み合わせになっていると考えてますが、皆様にはどう見えるでしょうか?
次に、これらから、リスクとリターンをプロットします。インド株とSP500が重なって出力されています。左がSP500に対し、リターンもリスクもやや大きいのがインド株です。
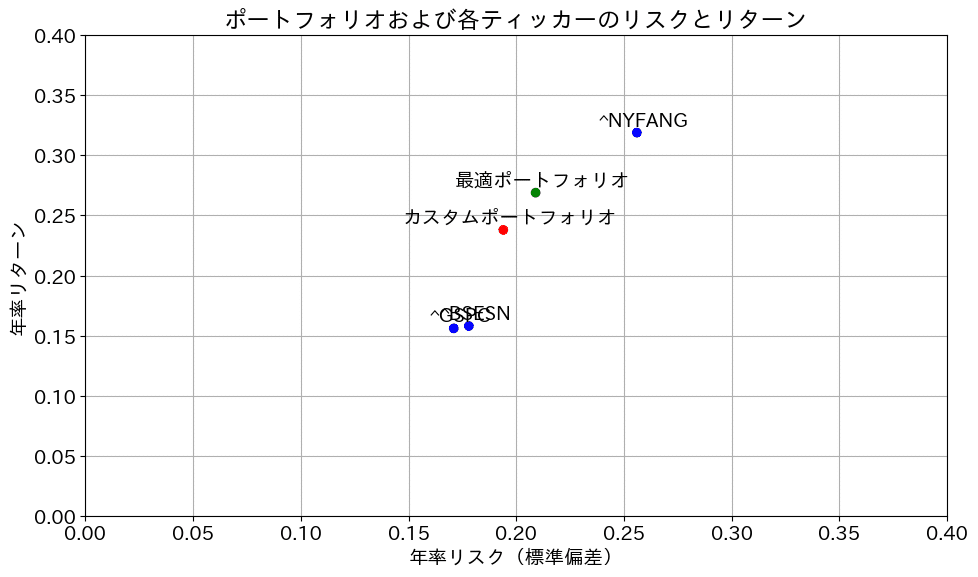
次に、シャープレシオ、最大ドローダウン含めて計算させた結果が下記です。過去実績からはFANG+を混ぜたパターンは優秀で、今後も期待できるのではないでしょうか?

3)考察
今回、インド株と米国株の指数の比較を行っていますが、リスク、リターンでは同等な値です。ただし、今後それぞれ保有していた場合のリターンは当然ながら全く異なることが想定されます。投資においてはリスクを低下させるための分散が基本と言われています。その中で、今回の対象となる米国もインドもどちらも、少なくとも日本よりははるかに成長していくように思えますので、このような分散は、最終的なリターンが安定する可能性があると考えます。
4 最後に
今回は、インド株を題材に、リターンとリスク、相関係数を調査してみました。PYTHONでは、この方法でご自身の興味のある題材で自分でシミュレーションしてみることもできます。
今後もPYTHON×マネーリテラシー向上に役立つ情報を発信していきますので、引き続き応援よろしくお願いします!!
記事の感想、要望があれば下記X(旧Twitterまで)
*今後の記事に活用させていただきます!!
Youtube
以下、過去記事、AI時系列予測等のご紹介
他サイトですがココならで、A I(LSTM)を使った株価予測の販売もやってます。こちらではFREDから、失業率や2年10年金利、銅価格等結果も取得しLSTMモデルで予測するコードとなってますので興味があれば見てみてください。またその他2件も米国株投資とは直接関係はありませんがプログラム入門におすすめです。
チャンネル紹介:Kota@Python&米国株投資チャンネル
過去の掲載記事:興味PYがあればぜひ読んでください。
グラフ化集計の基礎:S &P500と金や米国債を比較してます。
移動平均を使った時系列予測
以下実行コード全文:コピペで実行してみてください。
import yfinance as yf
import pandas as pd
import numpy as np
import matplotlib.pyplot as plt
import japanize_matplotlib  # 日本語表示に対応
from scipy.optimize import minimize  # 最適化のために追加

# フォントサイズの設定
plt.rcParams.update({'font.size': 14})

# 対象のティッカーシンボル
#tickers = ['SPY', 'EDV', 'GLD', 'BTC-USD', 'JPY=X']
tickers = ['^GSPC', '^NYFANG', '^BSESN', 'JPY=X']

# データの取得
data = yf.download(tickers, start="2004-01-01", end=pd.Timestamp.now().strftime('%Y-%m-%d'))['Adj Close']

# JPY=Xのデータを前詰めで空洞埋め
data['JPY=X'] = data['JPY=X'].fillna(method='ffill')

# データをドルから円に換算(JPY=X以外のティッカー)
for ticker in tickers[:-1]:  # 'JPY=X'は最後のティッカーなので除外
    data[ticker] = data[ticker] * data['JPY=X']

# 'JPY=X'の列を削除
data.drop(columns=['JPY=X'], inplace=True)

# 欠损値の削除
data = data.dropna()

# 日次リターンの計算
daily_returns = data.pct_change()

# 月次リターンの計算
monthly_data = data.resample('M').last()
monthly_returns = monthly_data.pct_change().dropna()

# 年率リターンと共分散行列の計算
mean_returns = monthly_returns.mean() * 12
cov_matrix = monthly_returns.cov() * 12

# カスタムポートフォリオの定義
custom_weights = {'^GSPC': 0.34, '^NYFANG': 0.50, '^BSESN': 0.16}

# カスタムポートフォリオのリターンとリスクの計算
custom_return = sum(mean_returns[ticker] * weight for ticker, weight in custom_weights.items())
custom_volatility = np.sqrt(
    sum(custom_weights[ticker1] * custom_weights[ticker2] * cov_matrix.loc[ticker1, ticker2]
        for ticker1 in custom_weights for ticker2 in custom_weights)
)
custom_sharpe_ratio = custom_return / custom_volatility

# カスタムポートフォリオの累積リターンを計算
custom_daily_returns = daily_returns[list(custom_weights.keys())].dot(pd.Series(custom_weights))
custom_cumulative_return = (1 + custom_daily_returns).cumprod()

# 最適ポートフォリオの計算を追加
def portfolio_annualized_performance(weights, mean_returns, cov_matrix):
    returns = np.dot(weights, mean_returns)
    std = np.sqrt(np.dot(weights.T, np.dot(cov_matrix, weights)))
    return returns, std

def negative_sharpe_ratio(weights, mean_returns, cov_matrix):
    p_ret, p_std = portfolio_annualized_performance(weights, mean_returns, cov_matrix)
    return -p_ret / p_std

def max_sharpe_ratio(mean_returns, cov_matrix):
    num_assets = len(mean_returns)
    args = (mean_returns, cov_matrix)
    constraints = ({'type': 'eq', 'fun': lambda x: np.sum(x) - 1})
    bounds = tuple((0, 1) for asset in range(num_assets))  # ショートを許可しない場合
    result = minimize(negative_sharpe_ratio, num_assets * [1. / num_assets, ], args=args,
                      method='SLSQP', bounds=bounds, constraints=constraints)
    return result

# 最適ポートフォリオの計算
optimal_portfolio = max_sharpe_ratio(mean_returns, cov_matrix)
optimal_weights = optimal_portfolio.x

# 最適ポートフォリオのリターンとリスクの計算
optimal_return, optimal_volatility = portfolio_annualized_performance(optimal_weights, mean_returns, cov_matrix)
optimal_sharpe_ratio = optimal_return / optimal_volatility

# 最適ポートフォリオの累積リターンを計算
optimal_daily_returns = daily_returns[mean_returns.index].dot(optimal_weights)
optimal_cumulative_return = (1 + optimal_daily_returns).cumprod()

# 各ティッカーの累積リターンを計算
cumulative_returns = (1 + daily_returns).cumprod()

# グラフの描画
plt.figure(figsize=(12, 6))

# 各ティッカーの累積リターンをプロット
tickers = [ticker for ticker in tickers if ticker != 'JPY=X']
for ticker in tickers:
    plt.plot(cumulative_returns[ticker], label=ticker, linestyle='--', alpha=0.5)

# カスタムポートフォリオの累積リターンをプロット
plt.plot(custom_cumulative_return, label='カスタムポートフォリオ', color='blue', linewidth=2)

# 最適ポートフォリオの累積リターンをプロット
plt.plot(optimal_cumulative_return, label='最適ポートフォリオ', color='green', linewidth=2)

# 各ティッカーのラベルを累積リターンの最後に追加
for ticker in tickers:
    plt.annotate(ticker, (cumulative_returns.index[-1], cumulative_returns[ticker].iloc[-1]),
                 textcoords="offset points", xytext=(5, 0), ha='center')

plt.annotate('カスタムポートフォリオ', (custom_cumulative_return.index[-1], custom_cumulative_return.iloc[-1]),
             textcoords="offset points", xytext=(5, 0), ha='center', color='blue')

plt.annotate('最適ポートフォリオ', (optimal_cumulative_return.index[-1], optimal_cumulative_return.iloc[-1]),
             textcoords="offset points", xytext=(5, 0), ha='center', color='green')

# グラフの設定
plt.title('カスタムポートフォリオと最適ポートフォリオの累積リターン')
plt.xlabel('日付')
plt.ylabel('累積リターン')
plt.legend()
plt.grid(True)
plt.tight_layout()
plt.show()

# 対数スケールの累積リターンのグラフを追加
plt.figure(figsize=(12, 6))

# 各ティッカーの累積リターンをプロット(対数スケール)
for ticker in tickers:
    plt.plot(cumulative_returns[ticker], label=ticker, linestyle='--', alpha=0.5)

# カスタムポートフォリオの累積リターンをプロット(対数スケール)
plt.plot(custom_cumulative_return, label='カスタムポートフォリオ', color='blue', linewidth=2)

# 最適ポートフォリオの累積リターンをプロット(対数スケール)
plt.plot(optimal_cumulative_return, label='最適ポートフォリオ', color='green', linewidth=2)

# 各ティッカーのラベルを累積リターンの最後に追加(対数スケール)
for ticker in tickers:
    plt.annotate(ticker, (cumulative_returns.index[-1], cumulative_returns[ticker].iloc[-1]),
                 textcoords="offset points", xytext=(5, 0), ha='center')

plt.annotate('カスタムポートフォリオ', (custom_cumulative_return.index[-1], custom_cumulative_return.iloc[-1]),
             textcoords="offset points", xytext=(5, 0), ha='center', color='blue')

plt.annotate('最適ポートフォリオ', (optimal_cumulative_return.index[-1], optimal_cumulative_return.iloc[-1]),
             textcoords="offset points", xytext=(5, 0), ha='center', color='green')

# グラフの設定(対数スケール)
plt.title('カスタムポートフォリオと最適ポートフォリオの累積リターン(対数スケール)')
plt.xlabel('日付')
plt.ylabel('累積リターン(対数スケール)')
plt.yscale('log')
plt.legend()
plt.grid(True)
plt.tight_layout()
plt.show()

# 累積リターンの範囲を限定したグラフの追加
plt.figure(figsize=(12, 6))

# 各ティッカーの累積リターンをプロット(範囲限定)
for ticker in tickers:
    plt.plot(cumulative_returns[ticker], label=ticker, linestyle='--', alpha=0.5)

# カスタムポートフォリオの累積リターンをプロット(範囲限定)
plt.plot(custom_cumulative_return, label='カスタムポートフォリオ', color='blue', linewidth=2)

# 最適ポートフォリオの累積リターンをプロット(範囲限定)
plt.plot(optimal_cumulative_return, label='最適ポートフォリオ', color='green', linewidth=2)

# 各ティッカーのラベルを累積リターンの最後に追加(範囲限定)
for ticker in tickers:
    plt.annotate(ticker, (cumulative_returns.index[-1], cumulative_returns[ticker].iloc[-1]),
                 textcoords="offset points", xytext=(5, 0), ha='center')

plt.annotate('カスタムポートフォリオ', (custom_cumulative_return.index[-1], custom_cumulative_return.iloc[-1]),
             textcoords="offset points", xytext=(5, 0), ha='center', color='blue')

plt.annotate('最適ポートフォリオ', (optimal_cumulative_return.index[-1], optimal_cumulative_return.iloc[-1]),
             textcoords="offset points", xytext=(5, 0), ha='center', color='green')

# グラフの設定(範囲限定)
plt.title('カスタムポートフォリオと最適ポートフォリオの累積リターン(限定範囲)')
plt.xlabel('日付')
plt.ylabel('累積リターン')
plt.ylim(0.8, 10)  # 軸の範囲を限定
plt.legend()
plt.grid(True)
plt.tight_layout()
plt.show()

# 最大ドローダウンの計算
def calculate_max_drawdown(returns):
    cumulative = (1 + returns).cumprod()
    drawdown = (cumulative / cumulative.cummax()) - 1
    return drawdown.min()

# パフォーマンス指標の作成
performance_data = {
    'ティッカー': tickers,
    '年率リターン': [mean_returns.loc[ticker] for ticker in tickers],
    '年率リスク': [cov_matrix.loc[ticker, ticker] ** 0.5 for ticker in tickers],
    'シャープレシオ': [mean_returns.loc[ticker] / (cov_matrix.loc[ticker, ticker] ** 0.5) for ticker in tickers],
    '最大ドローダウン': [calculate_max_drawdown(daily_returns[ticker]) for ticker in tickers]
}
portfolio_performance = pd.DataFrame(performance_data)

# カスタムポートフォリオのパフォーマンス指標を追加
custom_data = pd.DataFrame({
    'ティッカー': ['カスタムポートフォリオ'],
    '年率リターン': [custom_return],
    '年率リスク': [custom_volatility],
    'シャープレシオ': [custom_sharpe_ratio],
    '最大ドローダウン': [calculate_max_drawdown(custom_daily_returns)]
})
portfolio_performance = pd.concat([portfolio_performance, custom_data], ignore_index=True)

# 最適ポートフォリオのパフォーマンス指標を追加
optimal_data = pd.DataFrame({
    'ティッカー': ['最適ポートフォリオ'],
    '年率リターン': [optimal_return],
    '年率リスク': [optimal_volatility],
    'シャープレシオ': [optimal_sharpe_ratio],
    '最大ドローダウン': [calculate_max_drawdown(optimal_daily_returns)]
})
portfolio_performance = pd.concat([portfolio_performance, optimal_data], ignore_index=True)

# 小数点以3桁に丸める
portfolio_performance = portfolio_performance.round(3)

# パフォーマンス指標の表示
print(portfolio_performance)

# リスクリターン散布図の描画
plt.figure(figsize=(10, 6))
colors = portfolio_performance['ティッカー'].apply(lambda x: 'r' if x == 'カスタムポートフォリオ' else ('g' if x == '最適ポートフォリオ' else 'b'))
plt.scatter(portfolio_performance['年率リスク'], portfolio_performance['年率リターン'], c=colors, marker='o')

for i, txt in enumerate(portfolio_performance['ティッカー']):
    plt.annotate(txt, (portfolio_performance['年率リスク'][i], portfolio_performance['年率リターン'][i]),
                 textcoords="offset points", xytext=(5, 5), ha='center')
# X軸とY軸のレンジを指定
plt.xlim(0, 0.4)
plt.ylim(0, 0.4)

plt.xlabel('年率リスク(標準偏差)')
plt.ylabel('年率リターン')
plt.title('ポートフォリオおよび各ティッカーのリスクとリターン')
plt.grid(True)
plt.tight_layout()
plt.show()

# SPYとの相関係数の算出とグラフ化
correlation_with_spy = daily_returns.corr()['^GSPC'].drop('^GSPC')

plt.figure(figsize=(10, 6))
correlation_with_spy.plot(kind='bar', color='skyblue')
plt.xlabel('資産')
plt.ylabel('相関係数')
plt.title('各資産とSPYの日次リターン相関係数')
plt.grid(True)
plt.tight_layout()
plt.show()

# 最適ポートフォリオのウェイトを表示
optimal_weights_df = pd.DataFrame({
    'ティッカー': mean_returns.index,
    'ウェイト': optimal_weights * 100  # パーセント表示
})
optimal_weights_df = optimal_weights_df.round(1)
optimal_weights_df = optimal_weights_df[optimal_weights_df['ウェイト'] >= 0.1]

print("\n最適ポートフォリオのウェイト:")
print(optimal_weights_df)

# 最適ポートフォリオのウェイトをパイプチャート化(割合の大きな順に並べ、右回りに変更)
plt.figure(figsize=(10, 6))
# ウェイトとティッカーをソート
sorted_indices = np.argsort(optimal_weights)[::-1]  # 降順にソート
sorted_weights = [optimal_weights[i] for i in sorted_indices if optimal_weights[i] * 100 >= 0.1]
sorted_labels = [mean_returns.index[i] for i in sorted_indices if optimal_weights[i] * 100 >= 0.1]
colors = plt.get_cmap('Pastel1').colors
plt.pie(sorted_weights, labels=sorted_labels, autopct='%1.1f%%', startangle=90, counterclock=False, colors=colors)
plt.title('最適ポートフォリオの資産分散')
plt.tight_layout()
plt.show()

# カスタムポートフォリオのウェイトをパイプチャート化
plt.figure(figsize=(10, 6))
# ウェイトとティッカーをソート
custom_data = sorted(zip(custom_weights.values(), custom_weights.keys()), reverse=True)  # 降順にソート
sorted_custom_sizes, sorted_custom_labels = zip(*custom_data)
plt.pie(sorted_custom_sizes, labels=sorted_custom_labels, autopct='%1.1f%%', startangle=90, counterclock=False, colors=plt.get_cmap('Pastel2').colors)
plt.title('カスタムポートフォリオの資産分散')
plt.tight_layout()
plt.show()

optimal_weights_df
portfolio_performance
