TeX & TikZ

TeX & TikZ 覚書
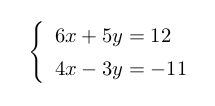
1 連立方程式の括弧
$\left\{%
\begin{array}{l}
{
6x + 5y = 12\\6x + 5y = 12
4x - 3y = -114x − 3y = −11
\end{array}
\right
出力結果
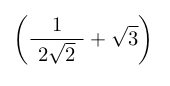
2 伸びる括弧
$\left(
\Frac*{1}{2\sqrt{2}} + \sqrt{3}
\right)$\\
 $\left( \right)$
% $$で囲む
% \Frac は、分数を見やすくするための自作 command(macro のところで詳しく説明します)です。
% ここは、\frac をお使いください。
出力結果
3 数式の中の伸びる括弧
\Frac{(\sqrt{27} - \sqrt{18})(\sqrt{48} - \sqrt{32})}{\sqrt{96}} - $\left(\Frac*{\sqrt{3}- \sqrt{2}}{\sqrt{2}}\right) ^2$
を計算をせよ。
出力結果

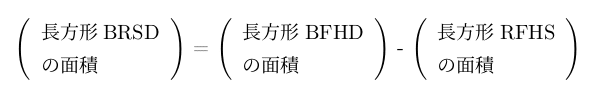
4 伸びる括弧複数行
伸びる括弧の中に array 環境を作っています。
また、伸びる括弧は $ $ で囲まれているので、半角英が斜体になるので、\rm でフォントを指定しています。
$\left(%
\begin{array}{l}
長方形 \rm{BRSD}\\
の面積
\end{array}
\right)$
=
$\left(%
\begin{array}{l}
長方形 \rm{BFHD}\\
の面積
\end{array}
\right)$ - $\left(%
\begin{array}{l}
長方形 \rm{RFHS}\\
の面積
\end{array}
\right)$\\
出力結果
5 座標平面
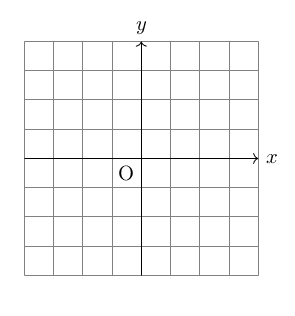
5-1 座標平面(格子あり)
\begin{tikzpicture}
\draw[step=.5,very thin, gray] (-2,-2) grid (2,2);
\draw[->] (-2,0) -- (2, 0)node[right]{$x$};
\draw[->] (0,-2) -- (0,2)node[above]{$y$};
\draw(0,0)coordinate(O)node[below left]{O};
\end{tikzpicture}
出力結果
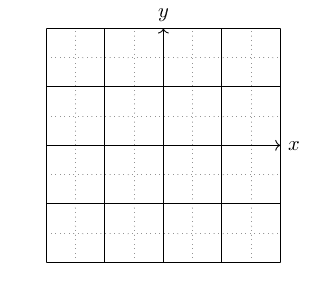
5-2 [foreach] の繰り返し変数を使った格子
\begin{tikzpicture}%[scale=.1]
% 縦実線\\
\foreach \x in{-2,-1,1,2}{
\draw[very thin](\x,-2)--(\x,2);
}
% 縦点線
\foreach \x in{-1.5,-.5,.5,1.5}{
\draw[dotted,very thin] (\x,-2)--(\x,2);
}
% 横実線
\foreach \y in{-2,-1,1,2}{
\draw[very thin](-2,\y)--(2,\y);
}
% 横点線
\foreach \y in{-1.5,-.5,.5,,1.5}{
\draw[dotted,very thin] (-2,\y)--(2,\y);
}
\draw[->] (-2,0) -- (2, 0)node[right]{$x$};
\draw[->] (0,-2)-- (0,2)node[above]{$y$};
\end{tikzpicture}
% 詳しくは,「foreach」の節で述べますが,
\foreach \x in{-2,-1,1,2} %変数 \x を in{ }の範囲で順に変化させます。
{
\draw[very thin](\x,2)--(\x,2);
}
% {  } 内の命令に各変数 \x を代入して実行させます。
% 結果は同じになりますが、
% 4 回の 「foreach」をまとめて 2 変数で書くこともできます。
\foreach \a/\b in{-2/-1.5,-1/-.5,1/.5,2/1.5}{
\draw[very thin](\a,-2)--(\a,2);
\draw[dotted,very thin] (\b,-2)--(\b,2);
}
\foreach \a/\b in{-2/-1.5,-1/-.5,1/.5,2/1.5}{
\draw[very thin])(-2,\a--(2,\a);
\draw[dotted,very thin] (-2,\b)--(2,\b);
}
出力結果
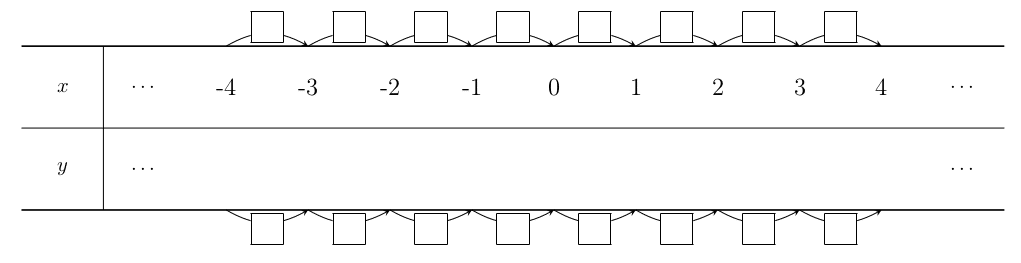
6 対応表
関数 y = □ x
\begin{tikzpicture}[scale=1.4]
%対応表の横線を引いています。
\draw[thick](-6,1.5)--(6,1.5)
(-6,-.5)--(6,-.5);
\draw(-6,.5)--(6,.5)
(-5,1.5)--(-5,-.5);
\draw(-5.5,1)node{$x$}
(-5.5,0)node{$y$};
%x、y の値を記入しています。
\foreach \a in{-4,-3,...,4}{
\draw(\a+.5,1)node{\large{\a}};
}

% 数値の変化を見るための □ と曲がった矢印をかいています。

\draw(-4.5,1)node{$\cdots$}
(-4.5,0)node{$\cdots$}
(5.5,1)node{$\cdots$}
(5.5,0)node{$\cdots$};
\foreach \a in{-3.5,...,3.5}{
\draw(\a,1.5)coordinate(P)
(\a+1,1.5)coordinate(Q);
\draw[->,>=stealth,bend left,distance=12pt](P)
to node [yshift=3pt,fill=white,inner sep=0pt] {\fbox{ }} (Q);
\draw(\a,-.5)coordinate(P)
(\a+1,-.5)coordinate(Q);
\draw[->,>=stealth,bend right,distance=12pt](P)
to node [yshift=-3pt,fill=white,inner sep=0pt] {\fbox{ }} (Q);
}
出力結果
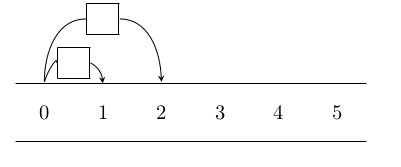
6.1 変化の様子を見るための □ と曲がった矢印について
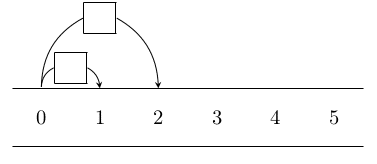
6.1.1 bend command の利用
\begin{tikzpicture}
\draw(0,0)--(6,0)
(0,1)--(6,1);
\foreach \x in{0,...,5}{
\draw(\x+.5,.5)node{\x};
}
\node [inner sep=0pt] (P) at (.5,1) {};
\node [inner sep=0pt](Q) at (1,1.35) {\fbox{ }};
\draw (node cs:name=P) to [bend left] (node cs:name=Q,anchor=west);
\node [inner sep=0pt](PP) at (1.5,1) {};
\draw [->,>=stealth] (node cs:name=Q,anchor=east) to [bend left] (node cs:name=PP);
\node [inner sep=0pt](PPP) at (2.5,1) {};
\node [inner sep=0pt](QQ) at (1.5,2.2) {\fbox{ }};
\draw (node cs:name=P) to [bend left] (node cs:name=QQ,anchor=west);
\draw [->,>=stealth] (node cs:name=QQ,anchor=east) to [bend left] (node cs:name=PPP);
\end{tikzpicture}
出力結果
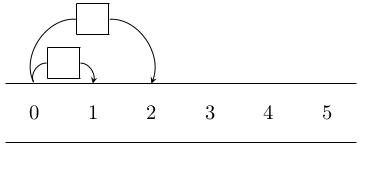
6.1.2 command out in の利用
\begin{tikzpicture}
\draw(0,0)--(6,0)
(0,1)--(6,1);
\foreach \x in{0,...,5}{
\draw(\x+.5,.5)node{\x};
}
\node [inner sep=0pt] (P) at (.5,1) {};
\node [inner sep=0pt](Q) at (1,1.35) {\fbox{ }};
\draw (node cs:name=P) to [out=80, in=80] (node cs:name=Q,anchor=west);
\node [inner sep=0pt](PP) at (1.5,1) {};
\draw [->,>=stealth] (node cs:name=Q,anchor=east) to [bend left] (node cs:name=PP);
\node [inner sep=0pt](PPP) at (2.5,1) {};
\node [inner sep=0pt](QQ) at (1.5,2.1) {\fbox{ }};
\draw (node cs:name=P) to [out=90, in=180] (node cs:name=QQ,anchor=west);
\draw [->,>=stealth] (node cs:name=QQ,anchor=east) to [out=0, in=90] (node cs:name=PPP);
\end{tikzpicture}
出力結果
6.1.3 bent で対象を結ぶ線分との間隔を指定
\begin{tikzpicture}
	\draw(0,0)--(6,0)
	(0,1)--(6,1);
	\foreach \x in{0,...,5}{
		\draw(\x+.5,.5)node{\x};
	}
	\node [inner sep=0pt] (P) at (.5,1) {};
	\node [inner sep=0pt](Q) at (1,1.35) {\fbox{ }};
	\draw (node cs:name=P) to [bend left=60] (node cs:name=Q,anchor=west);
	\node [inner sep=0pt](PP) at (1.5,1) {};
	\draw [->,>=stealth] (node cs:name=Q,anchor=east) to [bend left=60] (node cs:name=PP);

	\node [inner sep=0pt](PPP) at (2.5,1) {};
	\node [inner sep=0pt](QQ) at (1.5,2.1) {\fbox{ }};

	\draw (node cs:name=P) to [bend left=60] (node cs:name=QQ,anchor=west);
	\draw [->,>=stealth] (node cs:name=QQ,anchor=east) to [bend left=60] (node cs:name=PPP);
\end{tikzpicture}
出力結果
6.1.4 カレンダーから数の切り取り
※ 対応表ではありませんが、bent command の利用
\begin{tikzpicture}[scale=.8]
\draw(0,0)coordinate(A)
(1,0)coordinate(B)
(2,0)coordinate(C)
(3,0)coordinate(D)
(0,1)coordinate(E)
(1,1)coordinate(F)
(2,1)coordinate(G)
(3,1)coordinate(H)
(1,2)coordinate(I)
(2,2)coordinate(J);
\draw(.5,.5)coordinate(K)
(.5,1.5)coordinate(L)
(1.5,1.5)coordinate(M)
(2.5,1.5)coordinate(N);
\draw(A)--(D)--(H)--(E)--(A)(B)--(I)(C)--(J)--(I);
\node[inner sep=8pt,name=K] at (.5,.5) {7};
\node [name=L,inner sep=8pt,] at (1.5,.5) {8};
\node [name=M,inner sep=8pt,] at (2.5,.5) {9};
\node [name=N,inner sep=8pt,] at (1.5,1.5) {1};
\draw[->,>=stealth](N.west) to[bend right=40,edge node={node[left]{{\scriptsize +6}}}] (K.north
\draw[->,>=stealth](N.east) to[bend left=40,edge node={node[right]{{\scriptsize +8}}}] (M.north
\node [name=O,inner sep=4pt,] at (1.5,1.5) {};
\node [name=P,inner sep=4pt,] at (1.5,.5) {};
\draw[->,>=stealth](O.west) to[bend right=40,edge node={node[yshift=1.5pt,right]{{\scriptsize +
\end{tikzpicture}
出力結果

\begin{tikzpicture}[scale=.8]
\draw(0,0)coordinate(A)
(1,0)coordinate(B)
(2,0)coordinate(C)
(3,0)coordinate(D)
(0,1)coordinate(E)
(1,1)coordinate(F)
(2,1)coordinate(G)
(3,1)coordinate(H)
(1,2)coordinate(I)
(2,2)coordinate(J);
\draw(.5,.5)coordinate(K)
(.5,1.5)coordinate(L)
(1.5,1.5)coordinate(M)
(2.5,1.5)coordinate(N);
\draw(A)--(D)--(H)--(E)--(A)(B)--(I)(C)--(J)--(I);
\node[inner sep=8pt,name=K] at (.5,.5) {{\scriptsize $n+6$}};
\node [name=L,inner sep=8pt,] at (1.5,.5) {{\scriptsize $n+7$}};
\node [name=M,inner sep=8pt,] at (2.5,.5) {{\scriptsize $n+8$}};
\node [name=N,inner sep=8pt,] at (1.5,1.5) {$n$};
\draw[->,>=stealth](N.west) to[bend right=40,edge node={node[left]{{\scriptsize +6}}}] (K.north
\draw[->,>=stealth](N.east) to[bend left=40,edge node={node[right]{{\scriptsize +8}}}] (M.north
\node [name=O,inner sep=4pt,] at (1.5,1.5) {};
\node [name=P,inner sep=4pt,] at (1.5,.5) {};
\draw[->,>=stealth](O.west) to[bend right=40,edge node={node[yshift=1.5pt,right]{{\scriptsize +
\end{tikzpicture}
出力結果

6.1.5 ペジェ曲線の利用
\begin{tikzpicture}
\draw(0,0)--(6,0)
(0,1)--(6,1);
\foreach \x in{0,...,5}{
\draw(\x+.5,.5)node{\x};
}
\node [inner sep=0pt] (P) at (1.5,1) {};
\node [inner sep=0pt] (Q) at (2.5,1) {};
\draw [->,>=stealth](node cs:name=P) .. controls (1.5,1.4) and (2.5,2) .. node[fill=white, midw
}} (node cs:name=Q,anchor=west);
\node [inner sep=0pt] (QQ) at (3.5,1) {};
\draw [->,>=stealth](node cs:name=P) .. controls (1.5,2.8) and (3.5,3) .. node[fill=white, midw
}} (node cs:name=QQ,anchor=west);
\end{tikzpicture}
出力結果

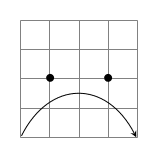
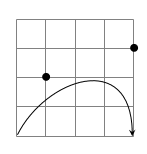
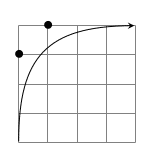
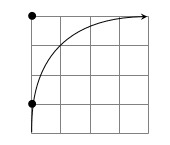
6.1.6 ペジェ曲線の参考例
\begin{tikzpicture}
\draw[step=0.5,very thin, gray] (0,0) grid (2,2);
\node [inner sep=0pt] (P) at (0,0) {};
\node [inner sep=0pt] (Q) at (2,0) {};
\draw [->,>=stealth] (P) .. controls (1,1)
.. (node cs:name=Q,anchor=west);
\draw(1,1)node{$\bullet$};
\end{tikzpicture}
出力結果
• は、始点からの方向点 (1,2)

\begin{tikzpicture}
\draw[step=0.5,very thin, gray] (0,0) grid (2,2);
\node [inner sep=0pt] (P) at (0,0) {};
\node [inner sep=0pt] (Q) at (2,0) {};
\draw [->,>=stealth] (P) .. controls (.5,1) and (1.5,1)
.. (node cs:name=Q,anchor=west);
\draw(1,1)node{$\bullet$};
\draw(1.5,1)node{$\bullet$};
\end{tikzpicture}
出力結果
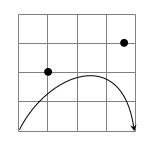
\begin{tikzpicture}
\draw[step=0.5,very thin, gray] (0,0) grid (2,2);
\node [inner sep=0pt] (P) at (0,0) {};
\node [inner sep=0pt] (Q) at (2,0) {};
\draw [->,>=stealth] (P) .. controls (.5,1) and (1.5,1.5)
\draw(.5,1)node{$\bullet$};
\draw(1.5,1.5)node{$\bullet$};
\end{tikzpicture}
出力結果

\begin{tikzpicture}
\draw[step=0.5,very thin, gray] (0,0) grid (2,2);
\node [inner sep=0pt] (P) at (0,0) {};
\node [inner sep=0pt] (Q) at (2,0) {};
\draw [->,>=stealth] (P) .. controls (.5,1) and (1.8,1.5)
.. (node cs:name=Q,anchor=west);
\draw(.5,1)node{$\bullet$};
\draw(1.8,1.5)node{$\bullet$};
\end{tikzpicture}
出力結果
\begin{tikzpicture}
\draw[step=0.5,very thin, gray] (0,0) grid (2,2);
\node [inner sep=0pt] (P) at (0,0) {};
\node [inner sep=0pt] (Q) at (2,0) {};
\draw [->,>=stealth] (P) .. controls (.5,1) and (2,1.5)
.. (node cs:name=Q,anchor=west);
\draw(.5,1)node{$\bullet$};
\draw(2,2)node{$\bullet$};
\end{tikzpicture}
出力結果
※ ここで、実際に対応表に適用できるように、
アンカーポイントを変更してみると
\begin{tikzpicture}
\draw[step=0.5,very thin, gray] (0,0) grid (2,2);
\node [inner sep=0pt] (P) at (0,0) {};
\node [inner sep=0pt] (Q) at (2,2) {};
\draw [->,>=stealth] (P) .. controls (0,1.5) and (.5,2) .. (node cs:name=Q,anchor=west);
\draw(0,1.5)node{$\bullet$};
\draw(.5,2)node{$\bullet$};;
\end{tikzpicture}
出力結果
\begin{tikzpicture}
\draw[step=0.5,very thin, gray] (0,0) grid (2,2);
\node [inner sep=0pt] (P) at (0,0) {};
\node [inner sep=0pt] (Q) at (2,2) {};
\draw [->,>=stealth] (P) .. controls (0,.5) and (.5,2) .. (node cs:name=Q,anchor=west);
\draw(0,.5)node{$\bullet$};
\draw(.5,2)node{$\bullet$};;
\end{tikzpicture}
出力結果
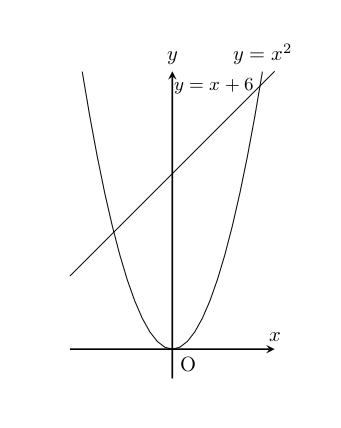
7 グラフ
7.1 一次関数、2乗に比例する関数
\begin{tikzpicture}[scale=.5]
%x 軸
\draw[->,>=stealth,thick] (-3.5,0)--(3.5,0)node[above]{$x$};
%y 軸
\draw[->,>=stealth,thick] (0,-1)--(0,9.5)node[above]{$y$};
\draw (0,0)node[below right]{O}; % 原点
\draw[domain=-3.5:3.5] plot(\x,\x+6)node[below left]{{\small $y = x + 6$}};
\draw[domain=-3.08:3.08] plot(\x,\x*\x)node[above]{$y=x^2$};
\end{tikzpicture}
出力結果
7.2 三角関数のグラフ
7.2.1 三角関数 sin θ のグラフ
\begin{tikzpicture}
\draw[->,>=stealth,thick](-2,0)--(7.8,0)node[above]{$\theta$}; %x 軸
\draw[->,>=stealth,thick] (0,-1.5)--(0,1.5)node[above]{$y$}; %y 軸
\draw[dotted](-2,1)--(7.8,1) (-2,-1)--(7.8,-1)(0,1)node[above left]{1}
(0,-1)node[below left]{-1};
\draw[dotted](-pi/2,-1)--(-pi/2,0)node[above]{{\tiny -\Frac{\pi}{2}}};
\draw[dotted](pi/2,1)--(pi/2,0)node[below]{{\tiny \Frac{\pi}{2}}};
\draw[dotted](3*pi/2,-1)--(3*pi/2,0)node[above]{{\tiny \Frac{3\pi}{2}}};
\draw(pi,0)node[above]{{\tiny $\pi$}};
\draw(2*pi,0)node[above]{{\tiny $2\pi$}};
\draw (0,0)node[below right]{O}; % 原点
\draw[smooth,domain=-2:7.5]plot(\x,{sin(\x r)})node[above]{$y=\sin{\theta}$};
\end{tikzpicture}
出力結果

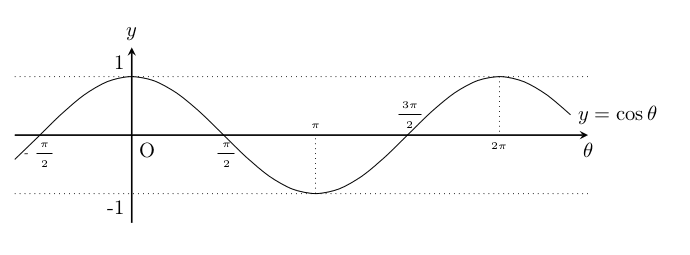
7.2.2 三角関数 cos θ のグラフ
\begin{tikzpicture}
\draw[->,>=stealth,thick](-2,0)--(7.8,0)node[below]{$\theta$}; %x 軸
\draw[->,>=stealth,thick] (0,-1.5)--(0,1.5)node[above]{$y$}; %y 軸
\draw[dotted](-2,1)--(7.8,1) (-2,-1)--(7.8,-1) (0,1)node[above left]{1}
(0,-1)node[below left]{-1};
\draw(-pi/2,0)node[below]{{\tiny -\Frac{\pi}{2}}};
\draw(pi/2,0)node[below]{{\tiny \Frac{\pi}{2}}};
\draw(3*pi/2,0)node[above]{{\tiny \Frac{3\pi}{2}}};
\draw[dotted](pi,-1)--(pi,0)node[above]{{\tiny $\pi$}};
\draw[dotted](2*pi,1)--(2*pi,0)node[below]{{\tiny $2\pi$}};
\draw (0,0)node[below right]{O}; % 原点
\draw[smooth,domain=-2:7.5]plot(\x,{cos(\x r)})node[right]{$y=\cos{\theta}$};
\end{tikzpicture}
出力結果
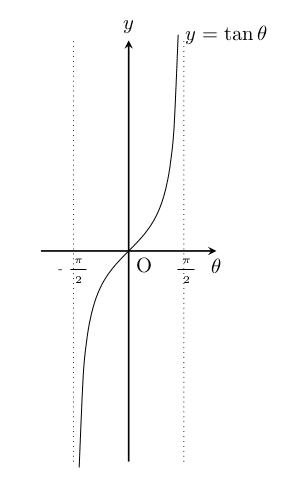
7.2.3 三角関数 tan θ のグラフ
\begin{tikzpicture}[scale=.6]
\draw[->,>=stealth,thick](-2.5,0)--(2.5,0)node[below]{$\theta$}; %x 軸
\draw[->,>=stealth,thick] (0,-6)--(0,6)node[above]{$y$}; %y 軸
\draw[dotted](-pi/2,-6)--(-pi/2,6) (pi/2,-6)--(pi/2,6);
\draw(-pi/2,0)node[below]{{\tiny -\Frac{\pi}{2}}};
\draw(pi/2,0)node[below]{{\tiny \Frac{\pi}{2}}};
\draw (0,0)node[below right]{O}; % 原点
\draw[smooth,domain=-1.41:1.41]plot(\x,{tan(\x r)})node[right]{$y=\tan{\theta}$};
\end{tikzpicture}
※ y の変域の関係で, 漸近線の位置が離れているように見えます。
※ グラフ全体を縮小または拡大する場合は, begin{tikzpicture}[scale=.5] などとします。
※ x と y それぞれで縮小率・拡大率の指定もできます。 begin{tikzpicture[xscale=.5,yscale=1.2]