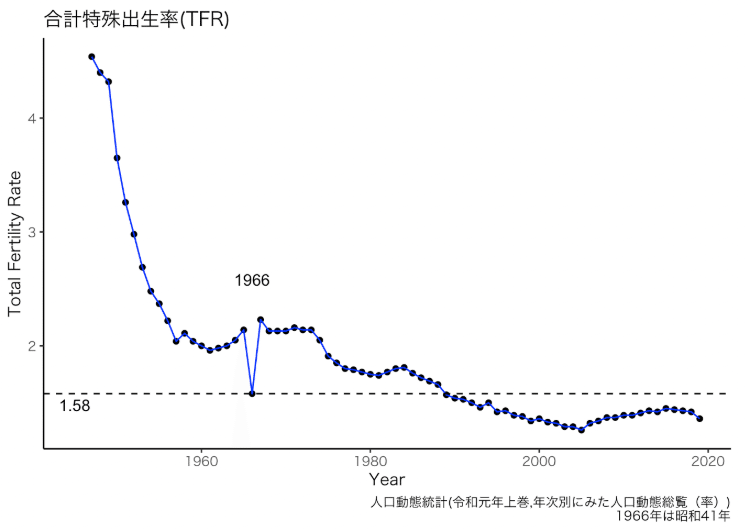
合計特殊出生率
合計特殊出生率のグラフをRのggplot2で作成する。


## 2.2.1 合計特殊出生率
```{r,message=FALSE,warning=FALSE}
library(readr)
library(dplyr)

mb010000 <- read_csv("mb010000.csv")
birth <- mb010000
head(birth,3)
tail(birth,3)
df <- birth

df$fertility_rate <- as.numeric(df$fertility_rate)

df <- df %>%
 filter(year >= 1947)

head(df,3)
tail(df,3)

# 変更前のdfを保存
df0 <- df
```

`{r, results="asis"}`として以下を実行。結果出力で\#\#が表示されない。

```{r, results="asis",message=FALSE}
library(stargazer)
stargazer(as.data.frame(df[,c(5,7)]),
type="html")
```


```{r,warning=FALSE}
library(tidyr)

df <- data.frame(year=df$year,fertility_rate=df$fertility_rate)
```


```{r,include=FALSE}
par(family="HiraKakuPro-W3")
plot(df, type = "l", xlab = "Year", ylab = "Total Fertility Rate",main="合計特殊出生率(TFR)")
text(x=1966,y=2.5,"1966年\n昭和41年",cex=0.7)
```


```{r,include=FALSE}
library(ggplot2)
ggplot(df,aes(x=year, y=fertility_rate)) +
 geom_point()+
 geom_line(col="blue") +
 geom_hline(yintercept = 1.58,linetype="dashed",size=0.5)+
labs(x="Year",y="Total Fertility Rate",title="合計特殊出生率(TFR)",caption = "人口動態統計(平成30年上巻,出生,第4.1表)\n1966年は昭和41年")+
annotate("text",x=1966,y=2.58,label="1966")+
annotate("text",x=1945,y=1.48,label="1.58")+
theme_classic(base_family="HiraKakuProN-W3")
```この記事が気に入ったらサポートをしてみませんか?
