ファイナンス機械学習:冗長特徴量を含んだ重要度 PCA,MDI重要度

特徴量を直交化し、固有値の高い順に並べるPCAを適用し、重要度をMDIとMDAで調べる。
スニペット8.7のテストデータを作成するコードを利用し、情報を持つ特徴量、情報を持つ特徴量の線形結合からなる冗長な特徴量、ノイズを持つ特徴量のデータセット$${({\bf X,y})}$$を作成する。
特徴量の直交化により、冗長な情報量は削減され、代替効果の影響は少なくなるはずであり、固有値の大きさ順に並べた特徴量は、理論的に重要度が高いと判断されると期待される。
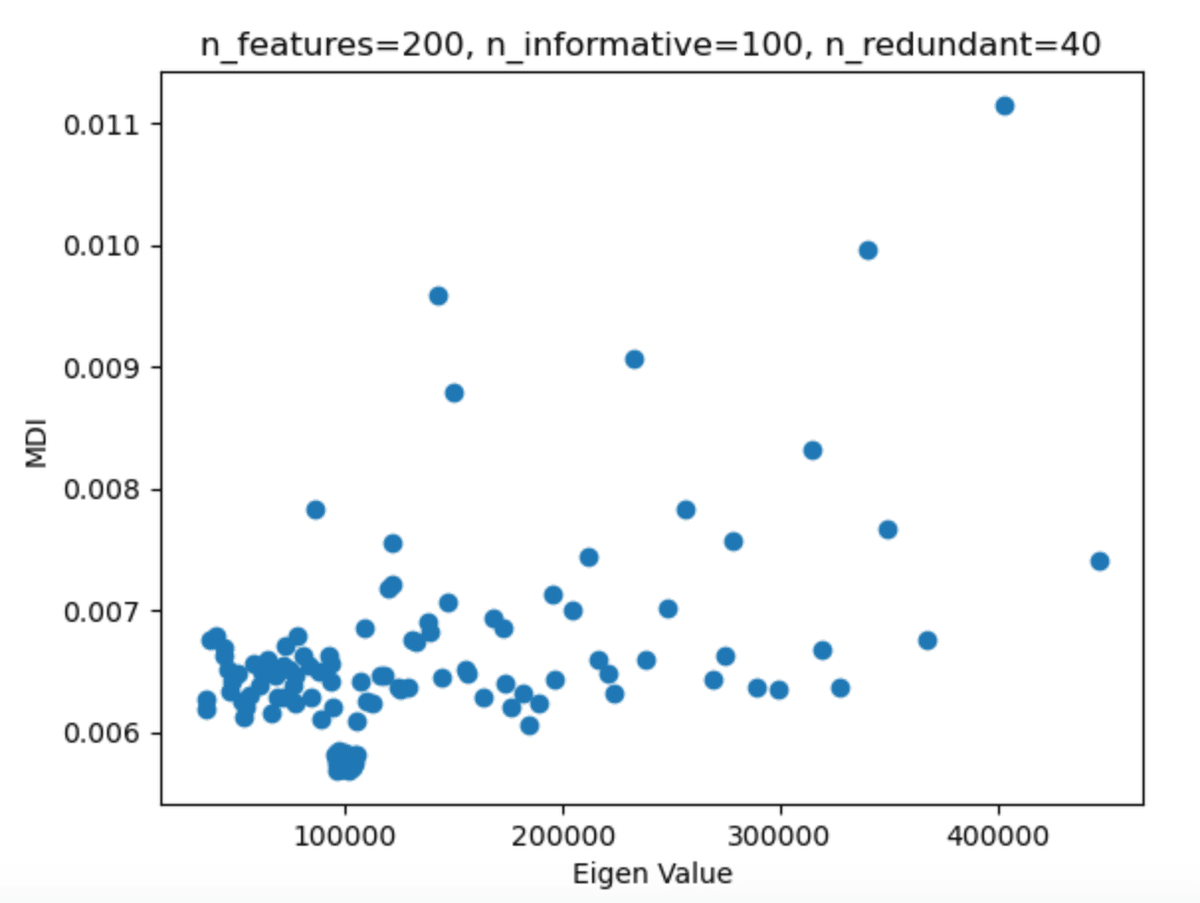
全特徴量を200、情報を持つ特徴量を100、冗長を40とし、決定木を用いてMDI重要度推定を行った。
サンプル数は100,000、決定木の数は1000、PCAの閾値は0.995とした。
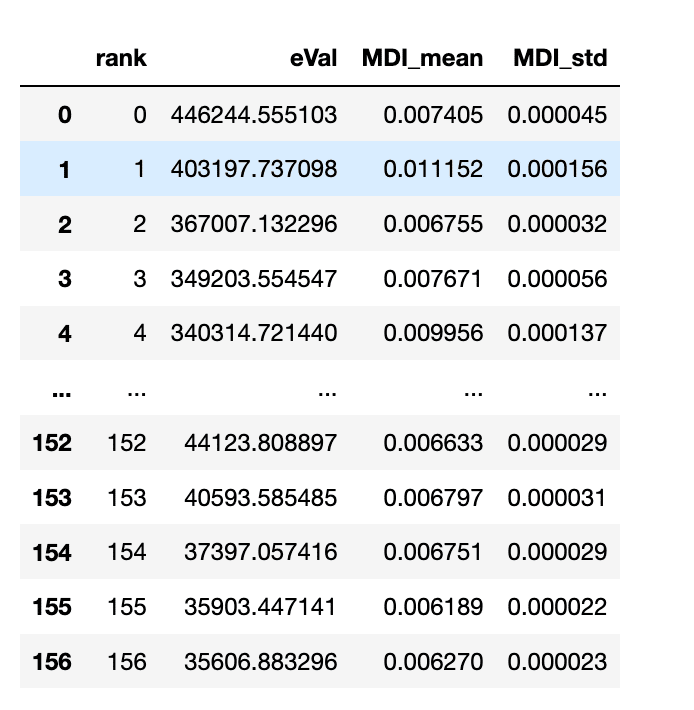
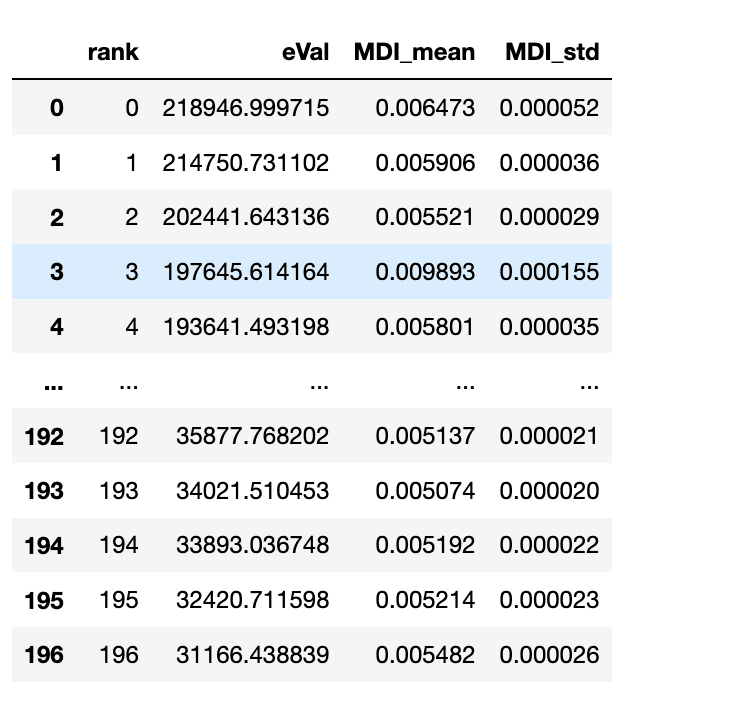
直交化により、冗長性を持つ特徴量が取り除かれ、全特徴量が156となっている。
これを固有値・重要度で散布させたのが以下の図となる。
また、固有値の値をPCA変換された特徴量が持つ情報量/分散説明率として、累積和をグラフ化する。
tot=sum(FI['eVal'])
var_exp=[(i/tot)for i in FI['eVal']]
cum_var_exp=np.cumsum(var_exp)
plt.bar(range(0,157),var_exp,alpha=0.5,align='center',label=('eVal'))
plt.step(range(0,157),cum_var_exp,where='mid',label=('cumlative'))
plt.ylim([0,1.0])
plt.axhline(y=0.8, color='r', linestyle='-')
plt.xlabel('Eigen value rank: Principal component index')
plt.ylabel('Explained varianve ratio')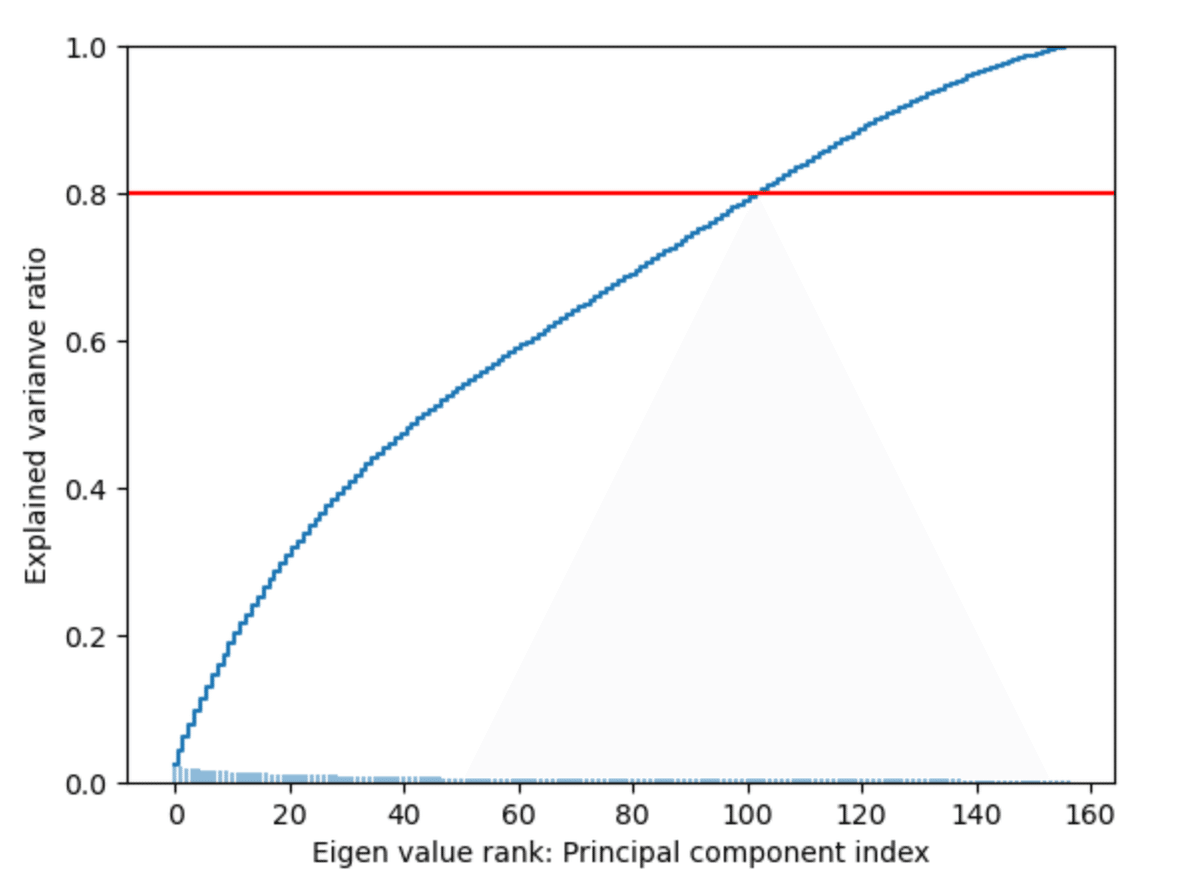
この図から、全説明率の80%が有益な情報量を持つ特徴量の数100とほぼ一致していることが示されている。
この上位100の固有値とMDI重要度との順位相関係数を、加重ケンドールタウ、スペアマン、ケンドールタウを使い計算した。
from scipy.stats import weightedtau,spearmanr,kendalltau
print('weighted:',weightedtau(FI['MDI_mean'][:100],FI['eVal'][:100])[0])
print('spearman:',spearmanr(FI['MDI_mean'][:100],FI['eVal'][:100])[0])
print('kendalltau:',kendalltau(FI['MDI_mean'][:100],FI['eVal'][:100])[0])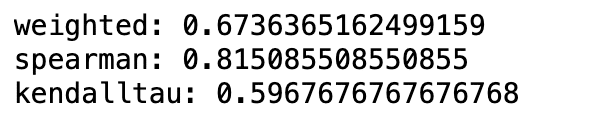
対角化による代替効果の減少を見るために、同じ実験を冗長特徴量なしで行った結果が以下である。
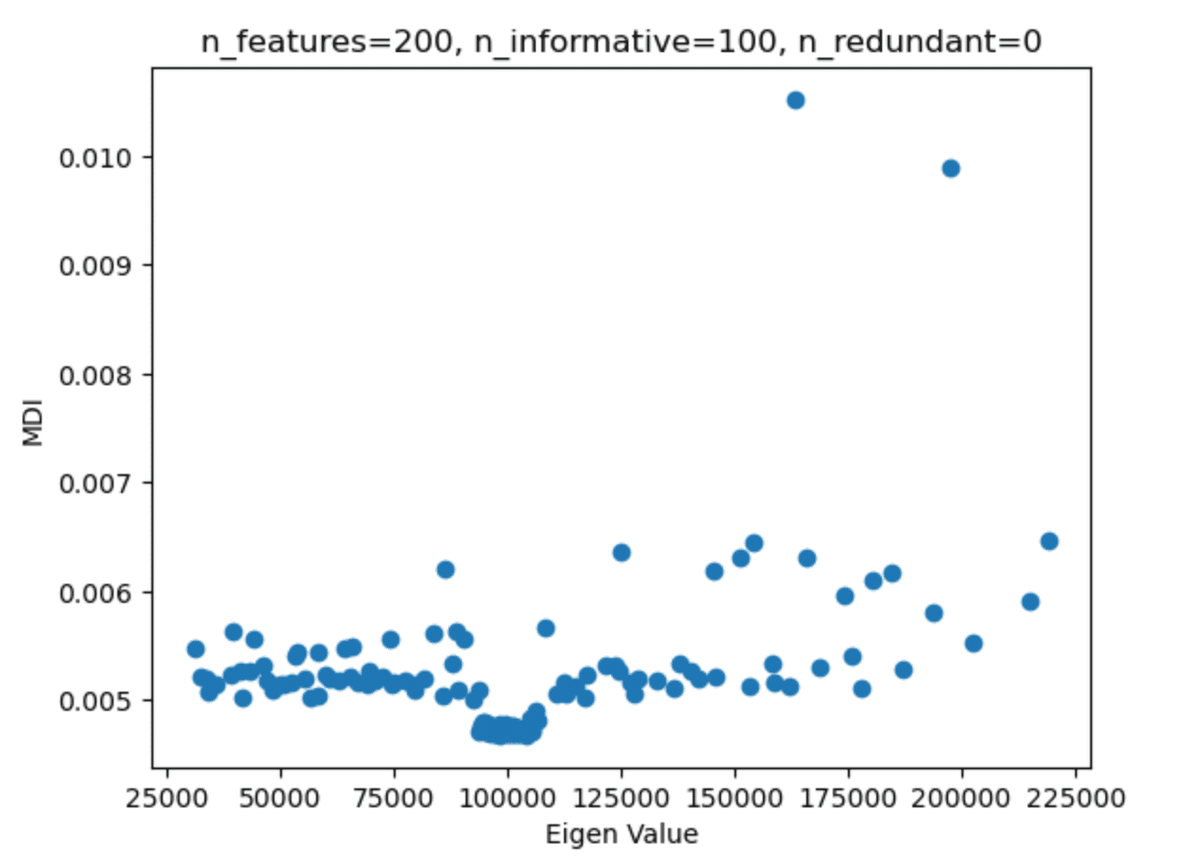
固有値とMDI重要度の散布図は以下のようになる。
分散説明率の累積和をグラフ化してみると、有益な情報を持つ特徴量の数100では、60%にしかならない。
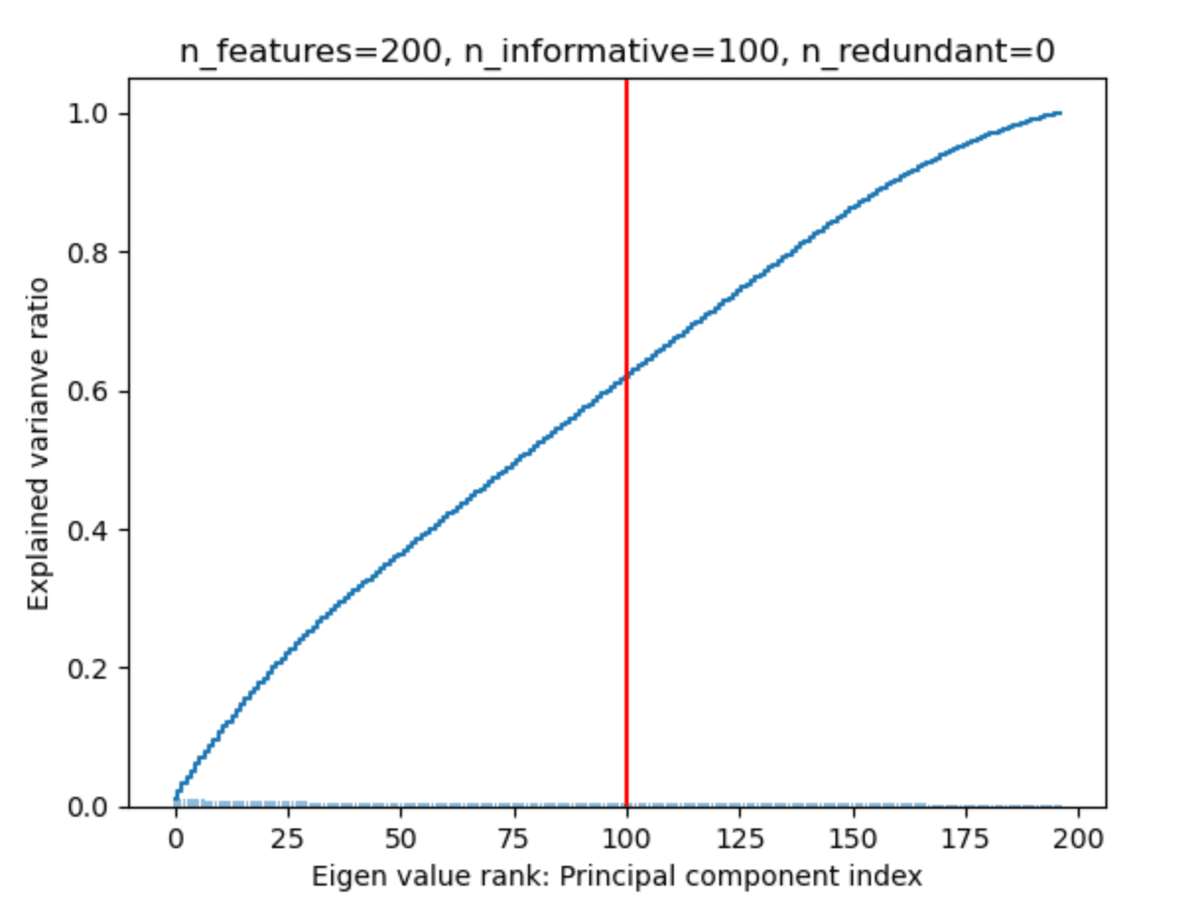
累積説明率がほぼ80%になる上位130の特徴量と、MDI重要度の順位相関係数を計算してみる。
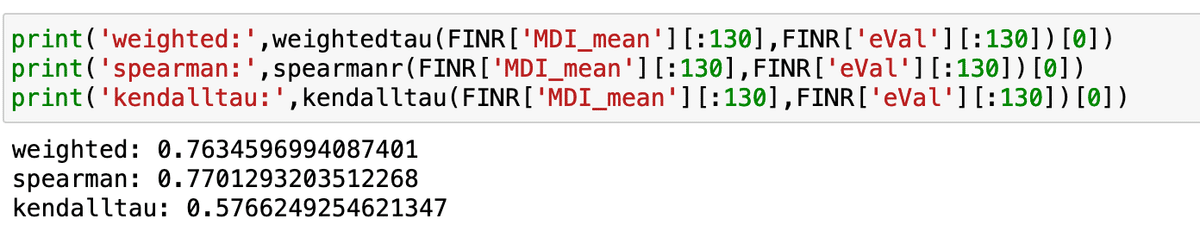
このことから、PCAによる対角化は代替効果を減少させるが、完全になくせるわけではなく、冗長特徴量を含めた特徴量でPCA変換することで、より説明量の高い特徴量が生成される可能性も否定できない。