ファイナンス機械学習:機械学習によるアロケーション HRP 数値例
$${10000 \times 10}$$の観測データから、HRPとIVP、CLAを使ってポートフォリオを構築する。
def generateData(nObs, size0, size1, sigma1):

    #1) generating some uncorrelated data
    np.random.seed(seed=12345)
    random.seed(12345)
    x = np.random.normal(0, 1, size=(nObs, size0))    # each row is a variable
    #2) creating correlation between the variables
    cols = [random.randint(0, size0 - 1) for i in range(size1)]
    y = x[:, cols] + np.random.normal(0, sigma1, size=(nObs, len(cols)))
    x = np.append(x, y, axis=1)
    x = pd.DataFrame(x, columns=range(1, x.shape[1] + 1))
    return x, cols
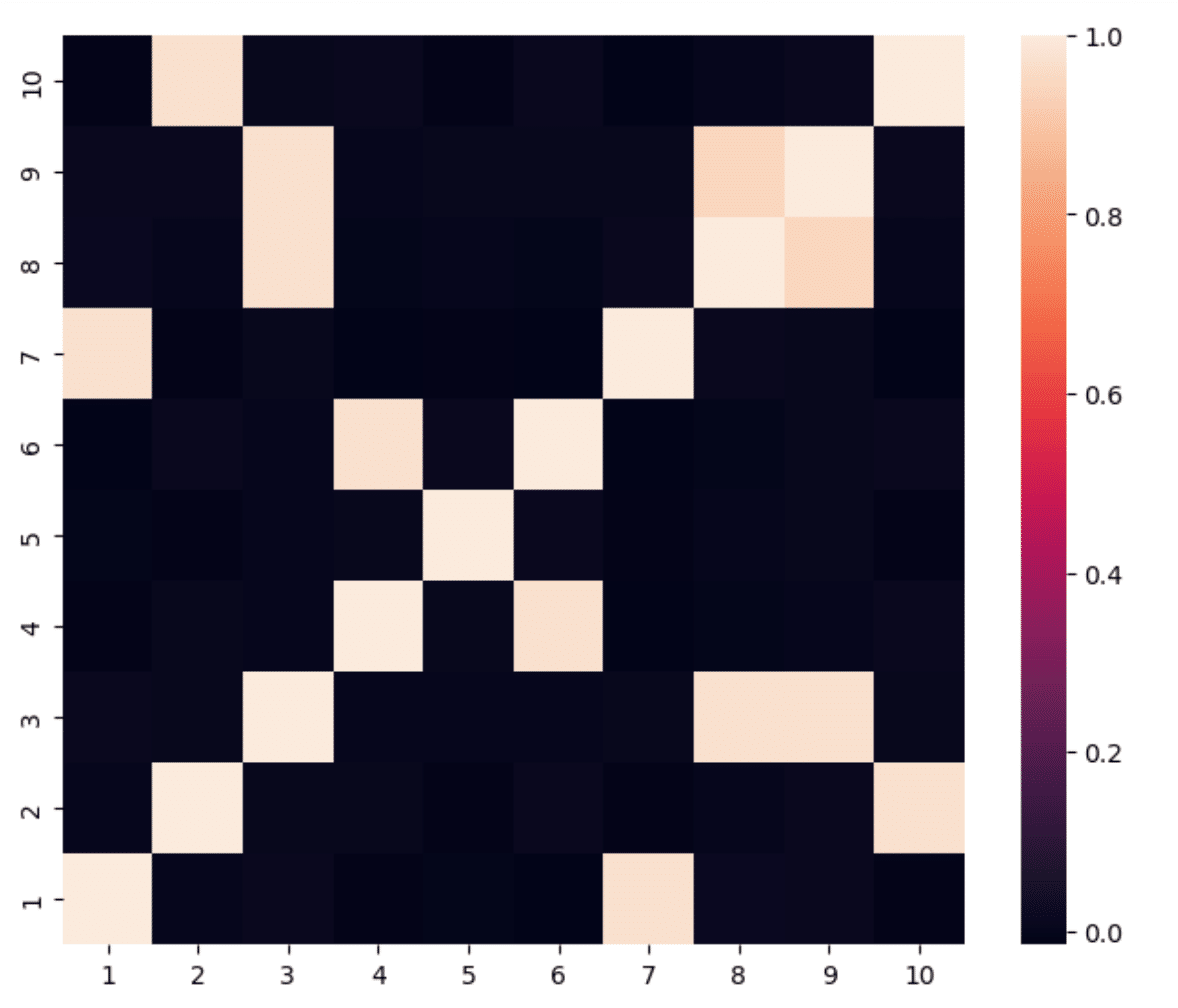
10資産のうち後半の5資産は、前半の5資産と相関しているとし、共分散行列のカラーマップは以下の様になる。

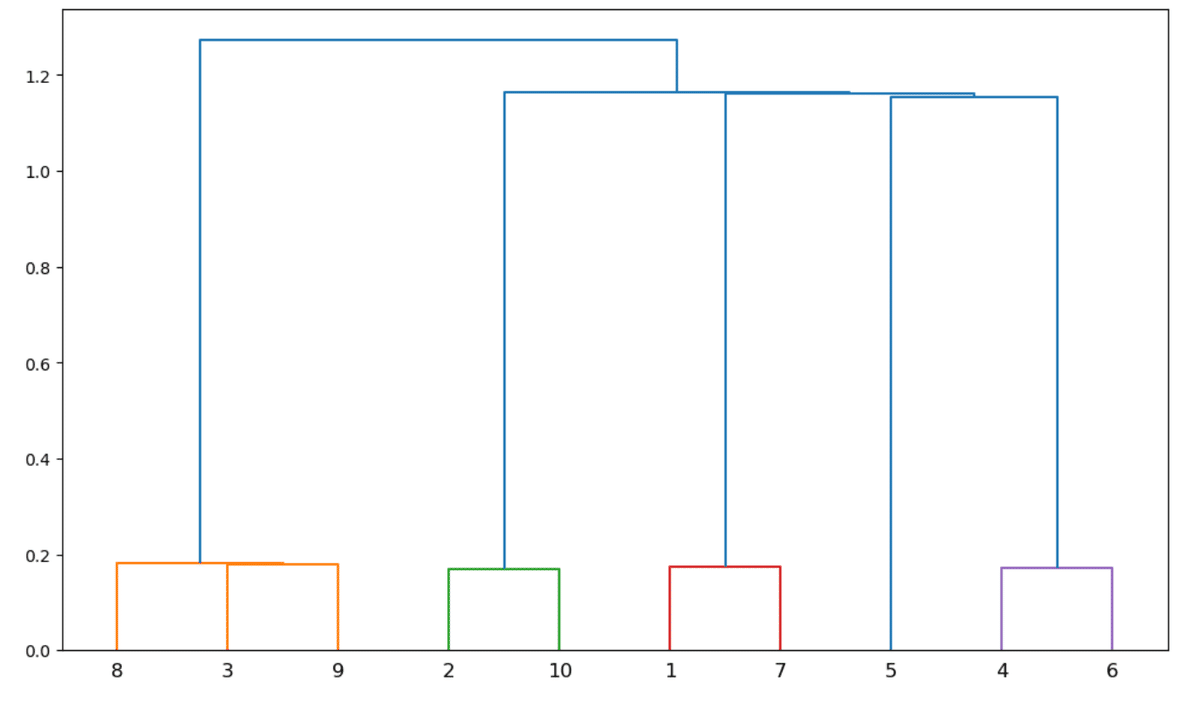
これをクラスタリングしていく過程は、デンドログラムで明らかになる。

相関のカラーマップからも分かるように、相関のない資産5はクラスタリングで類似性を認められていない。
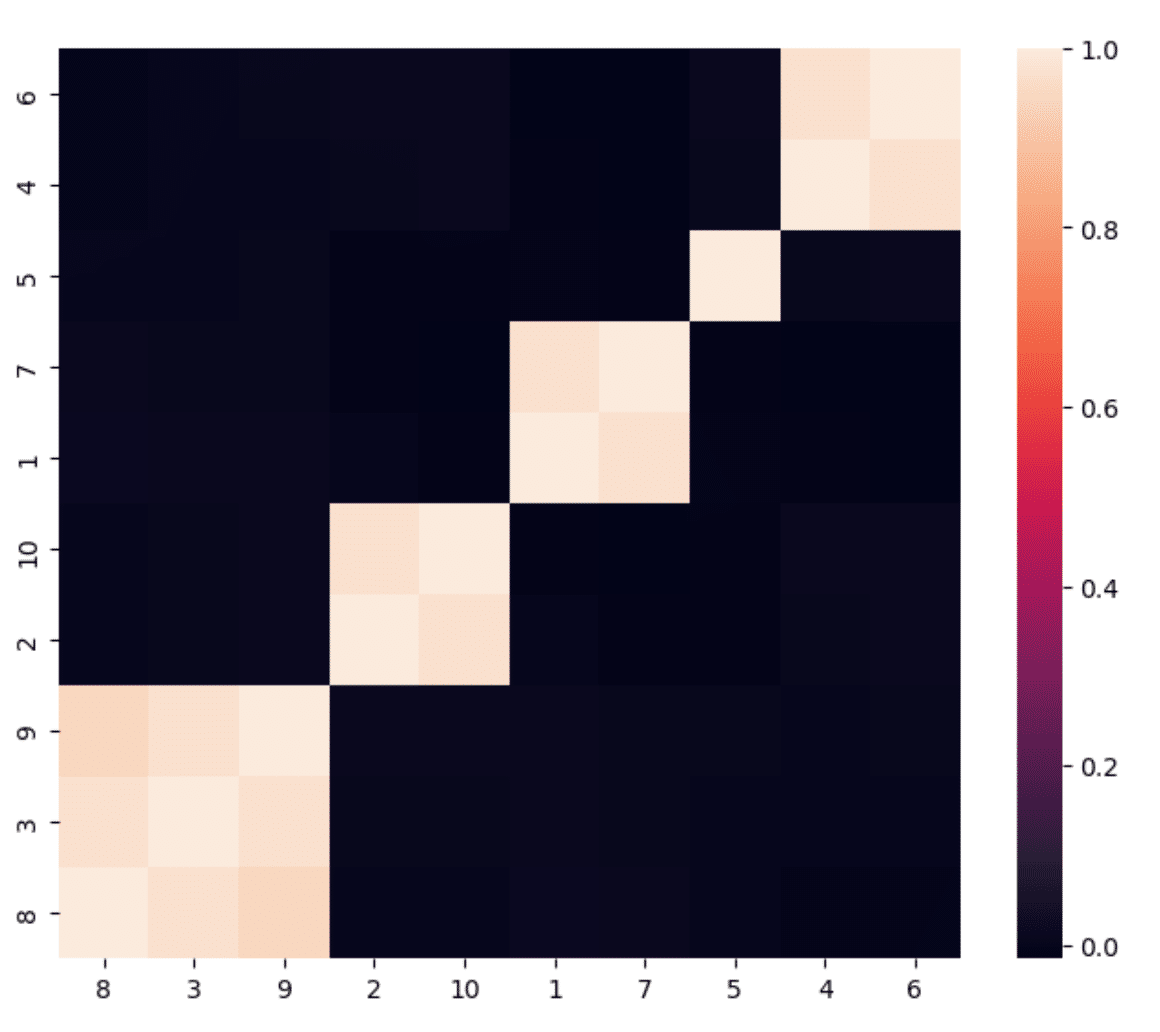
クラスタリングされた共分散行列は以下の様になる。

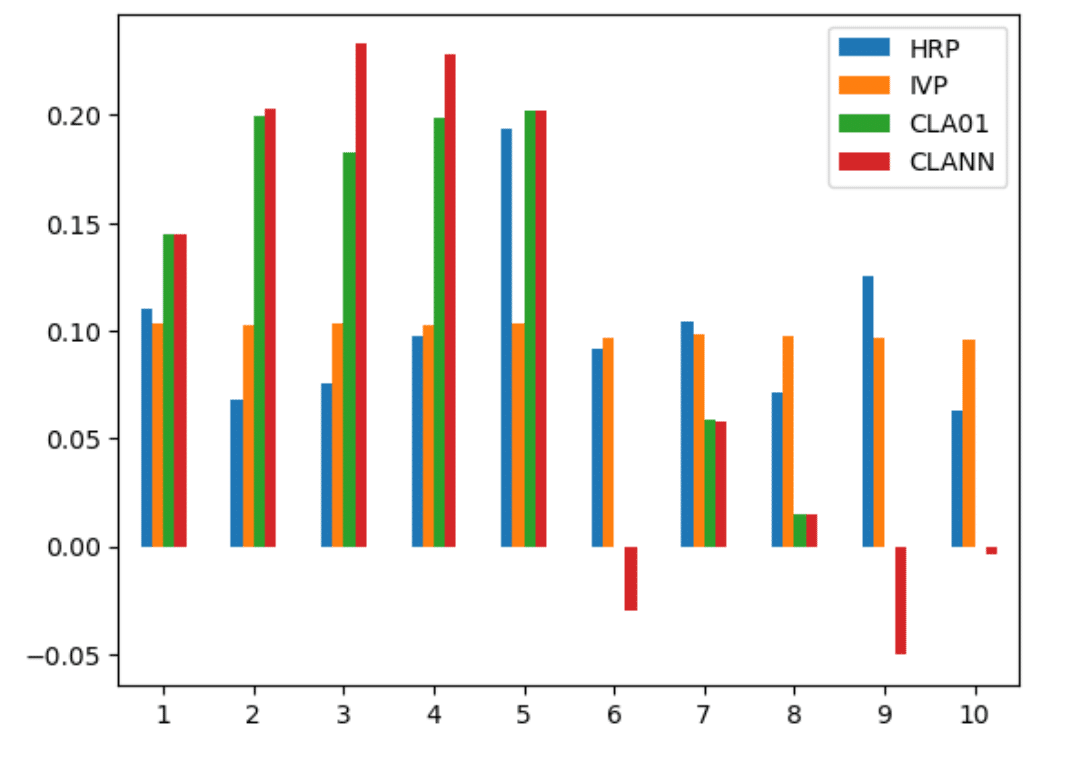
このリストを使い、準対角化と再帰的二分を行い得られるHRPによるポートフォリオの重みを、分散の逆数で重みを与えるIVPと、重みに$${0 \le \omega_i < 1, i=1,\cdots,10}$$の制限をつけたCLA(CLA01)と、重みの制限をはずし空売りを許したCLA(CLANN)でのポートフォリオの重みを比較したのが下の図である。

CLAによる重みの集中が見られる一方で、HRPは各クラスタに集中することなく重みを分散している。
この数値例は以下のコードで実装されている。
import numpy as np
import scipy as sc
import pandas as pd
import random
from scipy.cluster.hierarchy import dendrogram, linkage
from scipy.spatial.distance import pdist, squareform
import matplotlib
import matplotlib.pyplot as plt
import seaborn as sns

def getIvp(cov):
    ivp = 1.0 / np.diag(cov)
    ivp /= ivp.sum()
    return ivp

def getClusterVar(cov, cItems):
    cov_ = cov.loc[cItems, cItems]    # matrix slice
    w_ = getIvp(cov_).reshape(-1, 1)
    cVar = np.dot(np.dot(w_.T, cov_), w_)[0, 0]
    return cVar

def getQuasiDiag(link):
    link = link.astype(int)
    sortIx = pd.Series([link[-1, 0], link[-1, 1]])
    numItems = link[-1, 3]    # number of original items
    while sortIx.max() >= numItems:
        sortIx.index = range(0, sortIx.shape[0] * 2, 2)    # make space
        df0 = sortIx[sortIx >= numItems]    # find clusters
        i = df0.index
        j = df0.values - numItems
        sortIx[i] = link[j, 0]    # item 1
        df0 = pd.Series(link[j, 1], index=i+1)
        sortIx = sortIx._append(df0)    # item 2
        sortIx = sortIx.sort_index()    # re-sort
        sortIx.index = range(sortIx.shape[0])    # re-index
    lst =  sortIx.tolist()
    return lst

def getRecBipart(cov, sortIx):
    w = pd.Series([1.0] * len(sortIx), index=sortIx)
    cItems = [sortIx]    # initialize all items in one cluster
    while len(cItems) > 0:
        cItems = [i[j: k] for i in cItems
                  for j, k in ((0, int(len(i) / 2)), (int(len(i) / 2), len(i))) if len(i) > 1]    # bi-section
        for i in range(0, len(cItems), 2):    # parse in pairs
            cItems0 = cItems[i]    # cluster 1
            cItems1 = cItems[i+1]    # cluster 2
            cVar0 = getClusterVar(cov, cItems0)
            cVar1 = getClusterVar(cov, cItems1)
            alpha = 1 - cVar0 / (cVar0 + cVar1)
            w[cItems0] *= np.float64(alpha)    # weight 1
            w[cItems1] *= np.float64(1 - alpha)    # weight 2
    return w

def correlDist(corr):
    dist = ((1 - corr) / 2.0) ** 0.5    # distance matrix
    return dist

def plotCorrMatrix(corr, labels= None,size=(7,7)):
    fig, ax = plt.subplots(figsize=size)
    if labels is None:
        labels = []
    ax = sns.heatmap(corr)
    ax.invert_yaxis()
    ax.set_yticks(np.arange(0.5, corr.shape[0] + 0.5), list(labels))
    ax.set_xticks(np.arange(0.5, corr.shape[0] + 0.5), list(labels))
    plt.show()

def generateData(nObs, size0, size1, sigma1):
    #1) generating some uncorrelated data
    np.random.seed(seed=12345)
    random.seed(12345)
    x = np.random.normal(0, 1, size=(nObs, size0))    # each row is a variable
    #2) creating correlation between the variables
    cols = [random.randint(0, size0 - 1) for i in range(size1)]
    y = x[:, cols] + np.random.normal(0, sigma1, size=(nObs, len(cols)))
    x = np.append(x, y, axis=1)
    x = pd.DataFrame(x, columns=range(1, x.shape[1] + 1))
    return x, cols

def EXP():
    import CLA

    #1) Generate correlated data
    nObs, size0, size1, sigma1 = 10000, 5, 5, 0.25
    x, cols = generateData(nObs, size0, size1, sigma1)
    print([(j + 1, size0 + i) for i, j in enumerate(cols, 1)])
    cov, corr = x.cov(), x.corr()
    #2) compute and plot correl matrix
    plotCorrMatrix(corr, labels=corr.columns, size=(8, 6.5))
    #3) cluster
    dist = correlDist(corr)
    link = linkage(dist, 'single')
    fig, ax = plt.subplots(figsize=(12, 7))
    dendrogram(link, ax=ax, labels=corr.columns)
    plt.show()
    sortIx = getQuasiDiag(link)
    sortIx = corr.index[sortIx].tolist()    # recover labels
    df0 = corr.loc[sortIx, sortIx]    # reorder
    plotCorrMatrix(df0, labels=df0.columns, size=(8, 6.5))
    #4) Capital allocation
    hrp = getRecBipart(cov, sortIx)
    hrp=hrp.sort_index()
    df = pd.DataFrame({'HRP':hrp})
    ivp=getIvp(cov)
    df['IVP']=ivp
    mu=np.array(x.mean())
    mu=mu.reshape(-1,1)
    lb=np.zeros((len(mu),1))
    ub=np.ones((len(mu),1))
    cla=CLA.CLA(mu,cov.values,lb,ub)
    cla.solve()
    df['CLA01']=cla.w[-1].flatten()
    cla=CLA.CLA(mu,cov.values)
    cla.solve()
    df['CLANN']=cla.w[-1].flatten()
    return df

df=EXP2()
ax = df.plot( y=["HRP", "IVP", "CLA01","CLANN"], kind="bar", rot=0)