Processing でグラフを描く⑬ 行列による3次元グラフの変換
Processing でグラフを描く 第13回目です。
前回「行列による図形の変換」の続きです。行列による変換を3次元に拡張します。
Blender や Unity などの3DCGアニメーションを作成するソフトを使ったことのある方は多いかと思います。球や箱などを3次元座標上に配置して変形させる操作は、行列によって座標が計算され、ディスプレイに表示されているのです。今回の記事で、これらのソフトの内側で行われている処理の一部が見えてきます。
前回の記事で2次元を扱いましたから、未読の方はそちらからどうぞ。
3次元のグラフを描く
colors = [
    [255, 255, 255],  # white
    [255, 127, 0],  # orange
    [255, 0, 255],  # magenta
    [127, 127, 255],  # lightblue
    [255, 255, 0],  # yellow
    [0, 255, 0],  # lime
    [255, 127, 127],  # pink
    [127, 127, 127],  # gray
    [191, 191, 191],  # lightgray
    [0, 255, 255],  # cyan
    [127, 0, 127],  # purple
    [0, 0, 255],  # blue
    [127, 0, 0],  # brown
    [0, 127, 0],  # green
    [255, 0, 0],  # red
    [0, 0, 0],  # black
]
SIZE = 1000  # 画面サイズ
RANGE = [  # 作画範囲(x, z)
    [-7, 7],
    [-7, 7],
]
skip_num = 5
x_scale = float(RANGE[0][1] - RANGE[0][0]) / SIZE
z_scale = float(RANGE[1][1] - RANGE[1][0]) / SIZE
x_step = float(1) / x_scale
z_step = float(1) / z_scale
y_step = x_step
points_list = []


def setup():
    size(SIZE, SIZE, P3D)
    frameRate(5)
    # グラフのデータ
    points1 = []
    for j in range(0, SIZE, skip_num):
        for i in range(0, SIZE, skip_num):
            x = RANGE[0][0] + i * x_scale
            z = RANGE[1][0] + j * z_scale
            points1.append(math_function1(x, z))
    points_list.append(points1)


def draw():
    background(127)
    pushMatrix()
    translate(width / 2, height * 5 / 6)

    center = (0, 0, 0)
    camera_radius = width * 2
    camera_yaw = map(mouseX, 0, width, PI / 30, TWO_PI + PI / 30)
    camera_pitch = map(mouseY, 0, height, HALF_PI / 2, -HALF_PI / 2)
    camera_x = center[0] + camera_radius * sin(camera_yaw)
    camera_y = center[1] - camera_radius * sin(camera_pitch)
    camera_z = center[2] + camera_radius * cos(camera_yaw)
    camera(camera_x, camera_y, camera_z,  # 視点X, 視点Y, 視点Z
           center[0], center[1], center[2],  # 中心点X, 中心点Y, 中心点Z
           0.0, 1.0, 0.0)  # 天地X, 天地Y, 天地Z

    # グラフを描く
    for k in range(len(points_list)):
        points = points_list[k]
        for j in range(0, SIZE - skip_num, skip_num):
            for i in range(0, SIZE - skip_num, skip_num):
                index0 = (j * SIZE / skip_num ** 2 + i / skip_num)
                index1 = (j * SIZE / skip_num ** 2 + (i + skip_num) / skip_num)
                index2 = ((j + skip_num) * SIZE / skip_num ** 2 + (i + skip_num) / skip_num)
                index3 = ((j + skip_num) * SIZE / skip_num ** 2 + i / skip_num)
                x0 = x3 = (RANGE[0][0] + i * x_scale) * x_step
                z0 = z1 = (RANGE[1][0] + j * z_scale) * z_step
                x1 = x2 = (RANGE[0][0] + (i + skip_num) * x_scale) * x_step
                z2 = z3 = (RANGE[1][0] + (j + skip_num) * z_scale) * z_step
                y0 = points[index0] * y_step
                y1 = points[index1] * y_step
                y2 = points[index2] * y_step
                y3 = points[index3] * y_step
                vertexes = [
                    [x0, y0, z0],
                    [x1, y1, z1],
                    [x2, y2, z2],
                    [x3, y3, z3],
                ]
                # 平面を描く
                if not (y0 == 0 or y1 == 0 or y2 == 0 or y3 == 0):
                    fill(colors[0][0], colors[0][1], colors[0][2], 63)
                    stroke(colors[0][0], colors[0][1], colors[0][2], 63)
                    set_polygon(vertexes)

    # 座標軸を表示
    three_axes()
    popMatrix()


def math_function1(x=0, z=0):
    y = 10 - 2 * sqrt(x ** 2 + z ** 2)
    if y < 0 or x + 8 < y:
        y = 0
    return y


# 始点から終点に線を引く
def set_polygon(vts):
    x0, y0, z0 = vts[0]
    x1, y1, z1 = vts[1]
    x2, y2, z2 = vts[2]
    x3, y3, z3 = vts[3]
    beginShape()
    vertex(x0, -y0, z0)
    vertex(x1, -y1, z1)
    vertex(x2, -y2, z2)
    vertex(x3, -y3, z3)
    endShape(CLOSE)


def three_axes(direction=(1, -1, 1)):
    stroke(255, 0, 0)
    line(0, 0, 0, 1000 * direction[0], 0, 0)
    stroke(0, 255, 0)
    line(0, 0, 0, 0, 1000 * direction[1], 0)
    stroke(0, 0, 255)
    line(0, 0, 0, 0, 0, 1000 * direction[2])
    noStroke()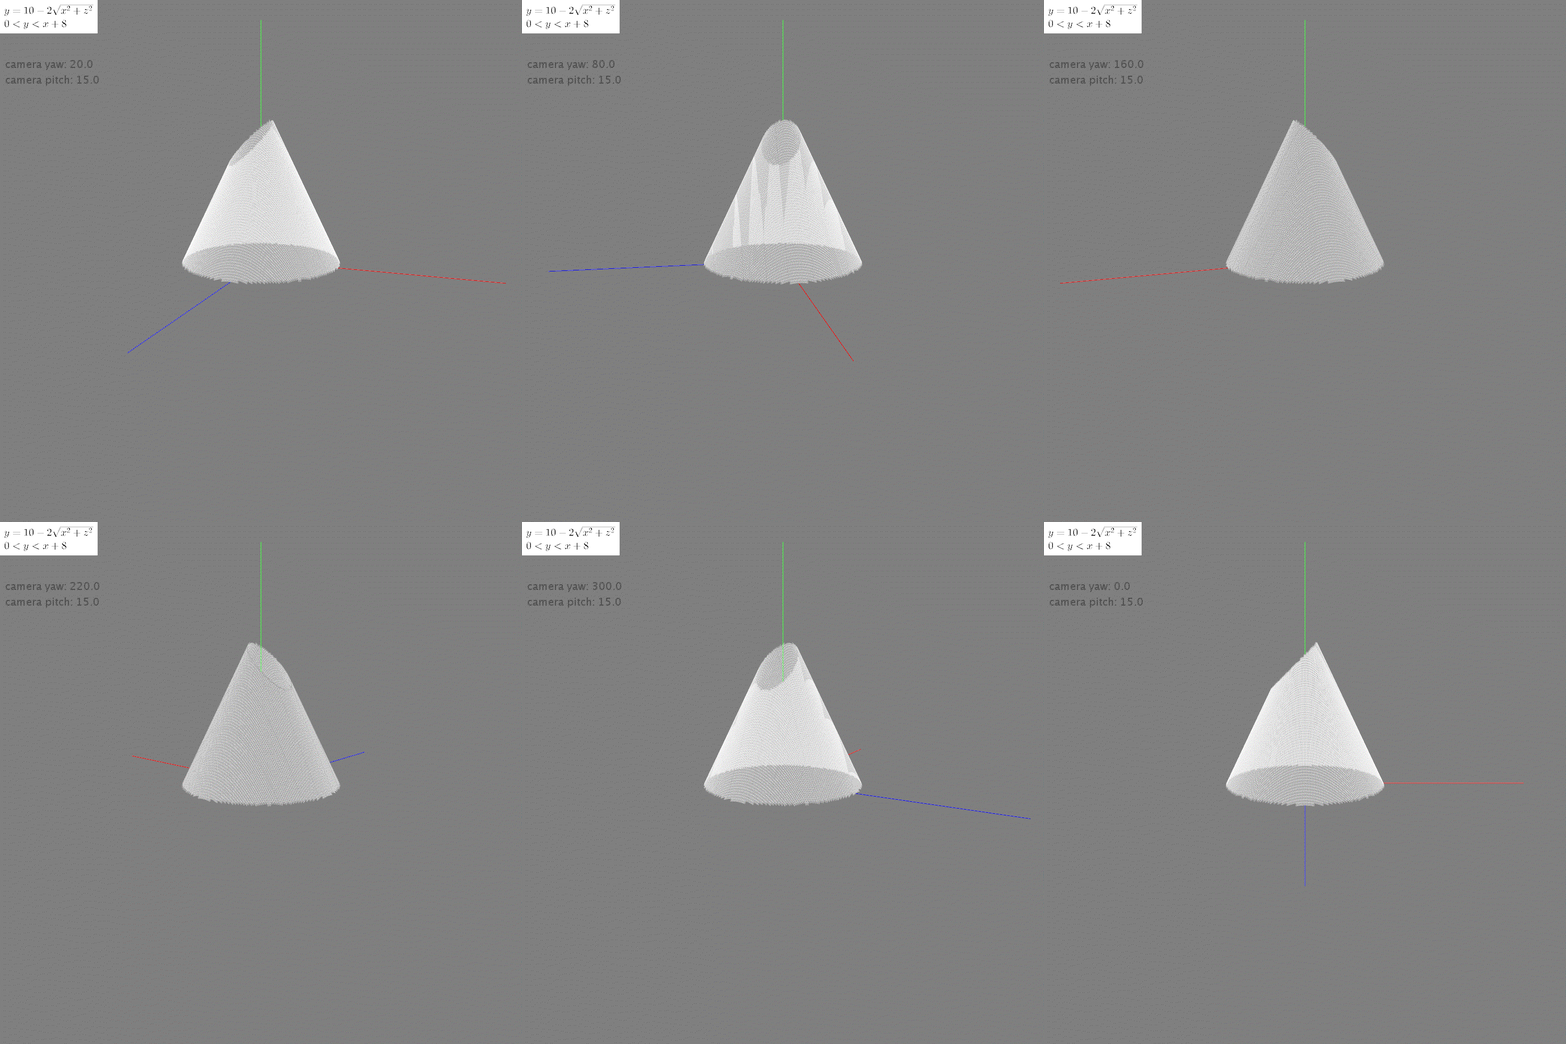
Processing でグラフを描く⑩ 3次元のグラフ のコードをほぼそのまま流用しています。平面で一部切り取られたコーン(円錐)の図形です。この図形を行列により変換(平行移動、拡大縮小、回転、せん断)していきます。
平行移動
$$
\begin{pmatrix}
x \\ y \\z
\end{pmatrix}
+
\begin{pmatrix}
t_1 \\ t_2 \\ t_3
\end{pmatrix}
=
\begin{pmatrix}
x + t_1 \\ y + t_2 \\ z + t_3
\end{pmatrix}
$$
colors = [
    [255, 255, 255],  # white
    [255, 127, 0],  # orange
    [255, 0, 255],  # magenta
    [127, 127, 255],  # lightblue
    [255, 255, 0],  # yellow
    [0, 255, 0],  # lime
    [255, 127, 127],  # pink
    [127, 127, 127],  # gray
    [191, 191, 191],  # lightgray
    [0, 255, 255],  # cyan
    [127, 0, 127],  # purple
    [0, 0, 255],  # blue
    [127, 0, 0],  # brown
    [0, 127, 0],  # green
    [255, 0, 0],  # red
    [0, 0, 0],  # black
]
SIZE = 1000  # 画面サイズ
RANGE = [  # 作画範囲(x, z)
    [-7, 7],
    [-7, 7],
]
skip_num = 5
x_scale = float(RANGE[0][1] - RANGE[0][0]) / SIZE
z_scale = float(RANGE[1][1] - RANGE[1][0]) / SIZE
x_step = float(1) / x_scale
z_step = float(1) / z_scale
y_step = x_step
points_list = []


def setup():
    size(SIZE, SIZE, P3D)
    frameRate(5)
    # グラフのデータ
    points1 = []
    for j in range(0, SIZE, skip_num):
        for i in range(0, SIZE, skip_num):
            x = RANGE[0][0] + i * x_scale
            z = RANGE[1][0] + j * z_scale
            points1.append(math_function1(x, z))
    points_list.append(points1)


def draw():
    background(127)
    pushMatrix()
    translate(width / 2, height * 5 / 6)

    center = (0, 0, 0)
    camera_radius = width * 2
    camera_yaw = map(mouseX, 0, width, PI / 30, TWO_PI + PI / 30)
    camera_pitch = map(mouseY, 0, height, HALF_PI / 2, -HALF_PI / 2)
    camera_x = center[0] + camera_radius * sin(camera_yaw)
    camera_y = center[1] - camera_radius * sin(camera_pitch)
    camera_z = center[2] + camera_radius * cos(camera_yaw)
    camera(camera_x, camera_y, camera_z,  # 視点X, 視点Y, 視点Z
           center[0], center[1], center[2],  # 中心点X, 中心点Y, 中心点Z
           0.0, 1.0, 0.0)  # 天地X, 天地Y, 天地Z

    # グラフを描く
    for k in range(len(points_list)):
        points = points_list[k]
        for j in range(0, SIZE - skip_num, skip_num):
            for i in range(0, SIZE - skip_num, skip_num):
                index0 = (j * SIZE / skip_num ** 2 + i / skip_num)
                index1 = (j * SIZE / skip_num ** 2 + (i + skip_num) / skip_num)
                index2 = ((j + skip_num) * SIZE / skip_num ** 2 + (i + skip_num) / skip_num)
                index3 = ((j + skip_num) * SIZE / skip_num ** 2 + i / skip_num)
                x0 = x3 = (RANGE[0][0] + i * x_scale) * x_step
                z0 = z1 = (RANGE[1][0] + j * z_scale) * z_step
                x1 = x2 = (RANGE[0][0] + (i + skip_num) * x_scale) * x_step
                z2 = z3 = (RANGE[1][0] + (j + skip_num) * z_scale) * z_step
                y0 = points[index0] * y_step
                y1 = points[index1] * y_step
                y2 = points[index2] * y_step
                y3 = points[index3] * y_step
                vertexes = [
                    [x0, y0, z0],
                    [x1, y1, z1],
                    [x2, y2, z2],
                    [x3, y3, z3],
                ]
                # 平面を描く
                if not (y0 == 0 or y1 == 0 or y2 == 0 or y3 == 0):
                    # 初期状態(無変換)
                    fill(colors[0][0], colors[0][1], colors[0][2], 63)
                    stroke(colors[0][0], colors[0][1], colors[0][2], 63)
                    set_polygon(vertexes)
                    # 平行移動
                    parallel_vectors = [
                        matrix_scalar([1, 2, 4], x_step),
                        matrix_scalar([1, 2, 4], x_step),
                        matrix_scalar([1, 2, 4], x_step),
                        matrix_scalar([1, 2, 4], x_step),
                    ]
                    stroke(colors[1][0], colors[1][1], colors[1][2])
                    set_polygon(matrix_add(vertexes, parallel_vectors))

    # 座標軸を表示
    three_axes()
    popMatrix()


def math_function1(x=0, z=0):
    y = 10 - 2 * sqrt(x ** 2 + z ** 2)
    if y < 0 or x + 8 < y:
        y = 0
    return y


# 始点から終点に線を引く
def set_polygon(vts):
    x0, y0, z0 = vts[0]
    x1, y1, z1 = vts[1]
    x2, y2, z2 = vts[2]
    x3, y3, z3 = vts[3]
    beginShape()
    vertex(x0, -y0, z0)
    vertex(x1, -y1, z1)
    vertex(x2, -y2, z2)
    vertex(x3, -y3, z3)
    endShape(CLOSE)


def three_axes(direction=(1, -1, 1)):
    stroke(255, 0, 0)
    line(0, 0, 0, 1000 * direction[0], 0, 0)
    stroke(0, 255, 0)
    line(0, 0, 0, 0, 1000 * direction[1], 0)
    stroke(0, 0, 255)
    line(0, 0, 0, 0, 0, 1000 * direction[2])
    noStroke()

# 行列をスカラ倍する
def matrix_scalar(a, scalar):
    row_num = len(a)
    new_matrix = []
    if type(a[0]) == list or type(a[0]) == tuple:
        column_num = len(a[0])
        for j in range(row_num):
            new_row = []
            for i in range(column_num):
                new_row.append(a[j][i] * scalar)
            new_matrix.append(new_row)
    else:
        for j in range(row_num):
            new_matrix.append(a[j] * scalar)
    return new_matrix


# 行列の和
def matrix_add(a, b):
    row_num = len(a)
    new_matrix = []
    if type(a[0]) == list or type(a[0]) == tuple:
        column_num = len(a[0])
        for j in range(row_num):
            new_row = []
            for i in range(column_num):
                new_row.append(a[j][i] + b[j][i])
            new_matrix.append(new_row)
    else:
        for j in range(row_num):
            new_matrix.append(a[j] + b[j])
    return new_matrix


# 行列の積
def matrix_mult(a, b):
    row_num = len(a)
    column_num = len(b[0])
    new_matrix = []
    for j in range(row_num):
        new_row = []
        for i in range(column_num):
            sum_value = 0
            for k in range(len(b)):
                sum_value += a[j][k] * b[k][i]
            new_row.append(sum_value)
        new_matrix.append(new_row)
    return new_matrix


# 転換行列にする
def matrix_transpose(a):
    row_num = len(a)
    new_matrix = []
    if type(a[0]) == list or type(a[0]) == tuple:
        column_num = len(a[0])
        for j in range(column_num):
            new_matrix.append([])
            for i in range(row_num):
                new_matrix[j].append(a[i][j])
    else:
        for i in range(row_num):
            new_matrix.append([a[i]])
    return new_matrix


# 拡大縮小
def matrix_zoom(a, scalars):
    row_num = len(a)
    column_num = len(a[0])
    conversion_matrix = []
    for j in range(column_num):
        new_row = []
        for i in range(row_num):
            if i == j:
                new_row.append(scalars[i])
            else:
                new_row.append(0)
        conversion_matrix.append(new_row)
    return matrix_transpose(
        matrix_mult(conversion_matrix, matrix_transpose(a))
    )


# 回転
def matrix_rotate_3d(a, angle, axis='z'):
    if axis == 'x':
        conversion_matrix = [
            [1, 0, 0],
            [0, cos(angle), -sin(angle)],
            [0, sin(angle), cos(angle)],
        ]
    elif axis == 'y':
        conversion_matrix = [
            [-sin(angle), 0, cos(angle)],
            [0, 1, 0],
            [cos(angle), 0, sin(angle)],
        ]
    else:
        conversion_matrix = [
            [cos(angle), -sin(angle), 0],
            [sin(angle), cos(angle), 0],
            [0, 0, 1],
        ]
    return matrix_transpose(
        matrix_mult(conversion_matrix, matrix_transpose(a))
    )


# スキュー(せん断)
def matrix_skew_3d(a, angles, axis='z'):
    if axis == 'x':
        conversion_matrix = [
            [1, 0, 0],
            [0, 1, tan(angles[0])],
            [0, tan(angles[1]), 1],
        ]
    elif axis == 'y':
        conversion_matrix = [
            [tan(angles[0]), 0, 1],
            [0, 1, 0],
            [1, 0, tan(angles[1])],
        ]
    else:
        conversion_matrix = [
            [1, tan(angles[0]), 0],
            [tan(angles[1]), 1, 0],
            [0, 0, 1],
        ]
    return matrix_transpose(
        mat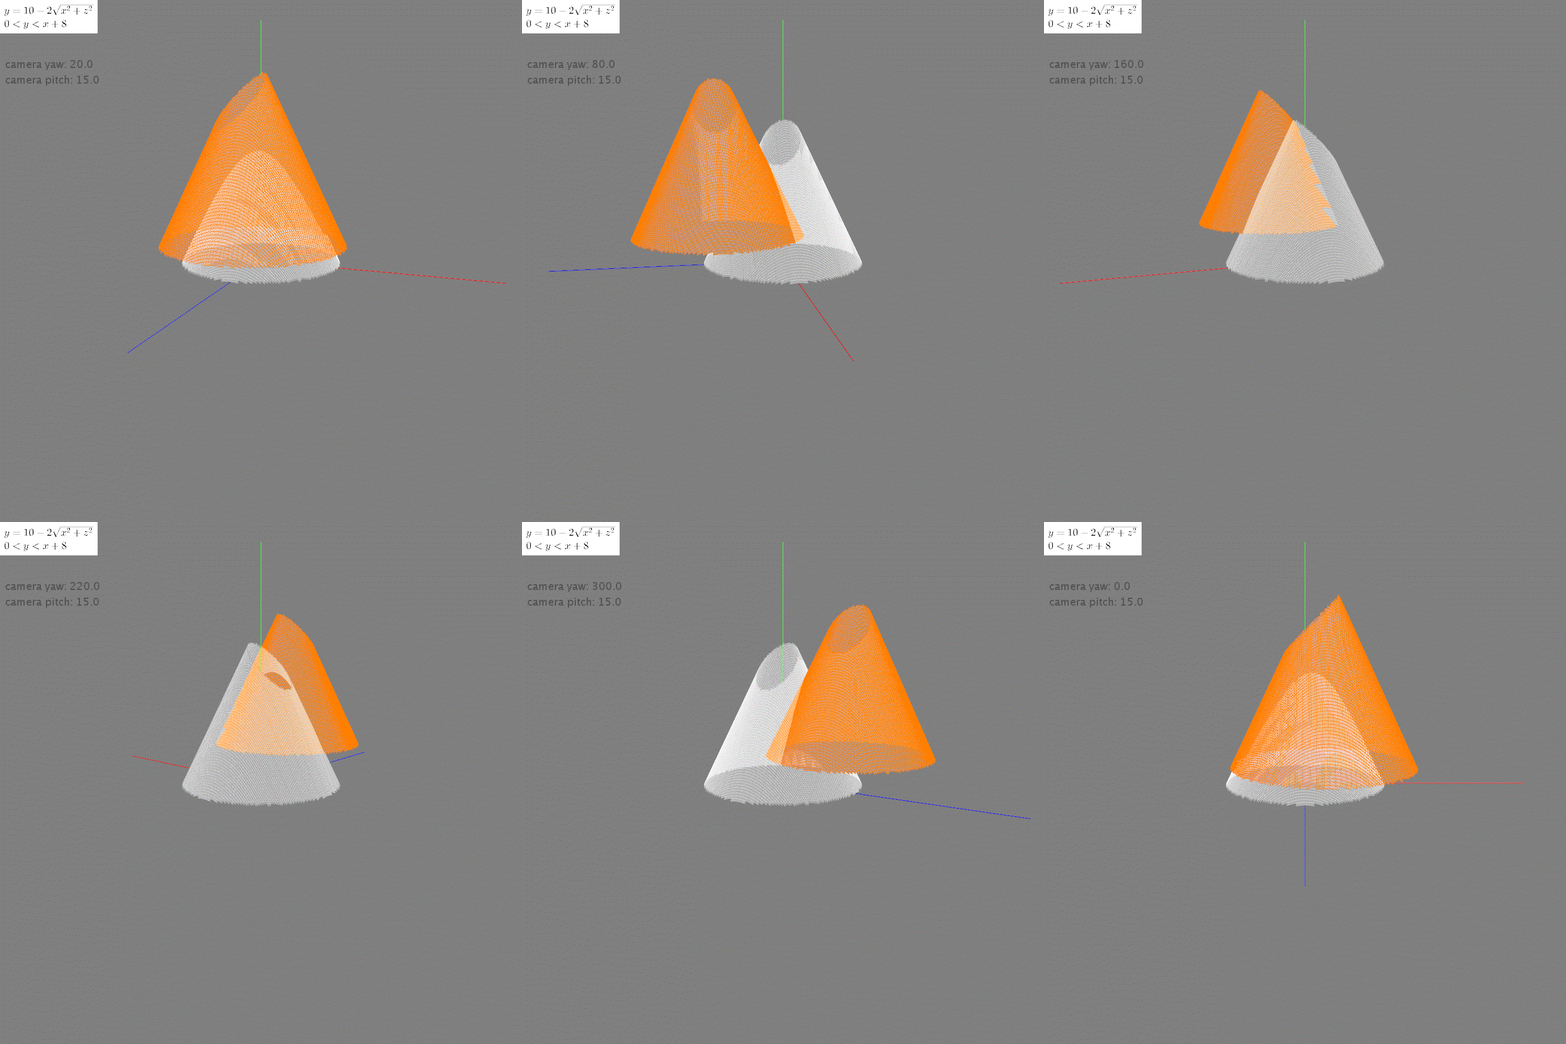
2次元と同様に「行列の和」により平行移動を実現できます。リスト [1, 2, 4] により、x方向(+1)、y方向(+2)、z方向(+4)の移動距離を指定しています。リストの数値を自由に変更して、コーンを好きな場所に移動させて遊んでみましょう。
コードの簡単な説明をします。matrix_xxx関数は行列関係の処理をまとめたものです。平行移動については、matrix_add関数で「ポリゴンの頂点座標」の変換を行っています。拡大縮小、回転、せん断は、それぞれmatrix_zoom、matrix_rotate_3d、matrix_skew_3d関数で処理しています。
前回のコードとほぼ一緒ですが、3次元に対応するため一部修正しました。前回のコードと見比べると、行列に対する理解が深まります。ぜひ挑戦してください。
拡大縮小
$$
\begin{pmatrix}s_x & 0 & 0 \\ 0 & s_y & 0 \\ 0 & 0 & s_z \end{pmatrix} \times \begin{pmatrix} x \\ y \\ z \end{pmatrix} = \begin{pmatrix}s_x x \\ s_y y \\ s_z z \end{pmatrix}
$$
# # 平行移動
# parallel_vectors = [
#     matrix_scalar([1, 2, 4], x_step),
#     matrix_scalar([1, 2, 4], x_step),
#     matrix_scalar([1, 2, 4], x_step),
#     matrix_scalar([1, 2, 4], x_step),
# ]
# stroke(colors[1][0], colors[1][1], colors[1][2])
# set_polygon(matrix_add(vertexes, parallel_vectors))
# 拡大縮小
scalars1 = [0.5, 1, 1.2]
stroke(colors[2][0], colors[2][1], colors[2][2])
set_polygon(matrix_zoom(vertexes, scalars1))
scalars2 = [1.2, -1, 2]
stroke(colors[3][0], colors[3][1], colors[3][2])
set_polygon(matrix_zoom(vertexes, scalars2))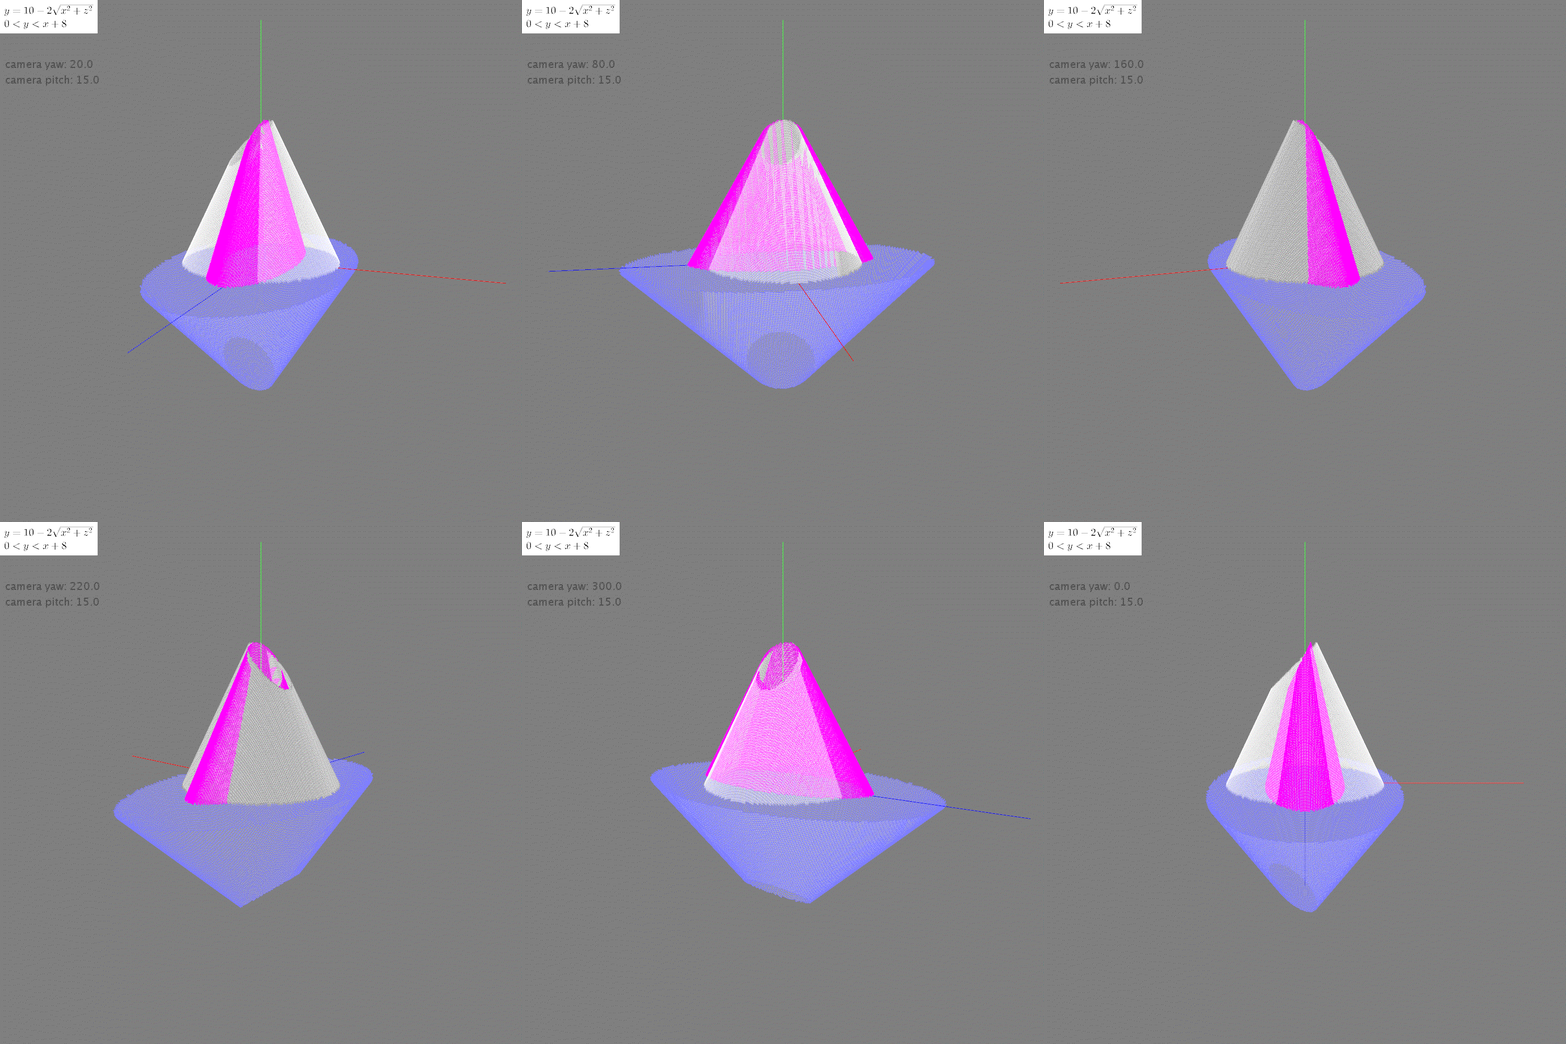
拡大縮小は「行列の積」により実行できます。リストscalars1 = [0.5, 1, 1.2] はx方向(0.5)、y方向(1.0)、z方向(1.2)の倍率になります。リストscalars2 = [1.2, -1, 2] は y方向の値(-1)がマイナスのため、下向きのコーンに変換されています。
回転
$$
\begin{pmatrix}
cos{\theta} & - sin{\theta} & 0 \\
sin{\theta} & cos{\theta} & 0\\
0 & 0 & 1 \\
\end{pmatrix} --- z軸回転 \\
\begin{pmatrix}
1 & 0 & 0 \\
0 &cos{\theta} & - sin{\theta} \\
0 & sin{\theta} & cos{\theta} \\
\end{pmatrix} --- x軸回転 \\
\begin{pmatrix}
- sin{\theta} & 0 & cos{\theta} \\
0 & 1 & 0 \\
cos{\theta} & 0 & sin{\theta} \\
\end{pmatrix} --- y軸回転 \\
$$
# # 平行移動
# parallel_vectors = [
#     matrix_scalar([1, 2, 4], x_step),
#     matrix_scalar([1, 2, 4], x_step),
#     matrix_scalar([1, 2, 4], x_step),
#     matrix_scalar([1, 2, 4], x_step),
# ]
# stroke(colors[1][0], colors[1][1], colors[1][2])
# set_polygon(matrix_add(vertexes, parallel_vectors))
# # 拡大縮小
# scalars1 = [0.5, 1, 1.2]
# stroke(colors[2][0], colors[2][1], colors[2][2])
# set_polygon(matrix_zoom(vertexes, scalars1))
# scalars2 = [1.2, -1, 2]
# stroke(colors[3][0], colors[3][1], colors[3][2])
# set_polygon(matrix_zoom(vertexes, scalars2))
# 回転
angle1 = PI / 4
stroke(colors[4][0], colors[4][1], colors[4][2])
set_polygon(matrix_rotate_3d(vertexes, angle1))
angle2 = PI / 2
stroke(colors[5][0], colors[5][1], colors[5][2])
set_polygon(matrix_rotate_3d(vertexes, angle2, 'x'))

...

# 回転
def matrix_rotate_3d(a, angle, axis='z'):
    if axis == 'x':
        conversion_matrix = [
            [1, 0, 0],
            [0, cos(angle), -sin(angle)],
            [0, sin(angle), cos(angle)],
        ]
    elif axis == 'y':
        conversion_matrix = [
            [-sin(angle), 0, cos(angle)],
            [0, 1, 0],
            [cos(angle), 0, sin(angle)],
        ]
    else:
        conversion_matrix = [
            [cos(angle), -sin(angle), 0],
            [sin(angle), cos(angle), 0],
            [0, 0, 1],
        ]
    return matrix_transpose(
        matrix_mult(conversion_matrix, matrix_transpose(a))
    )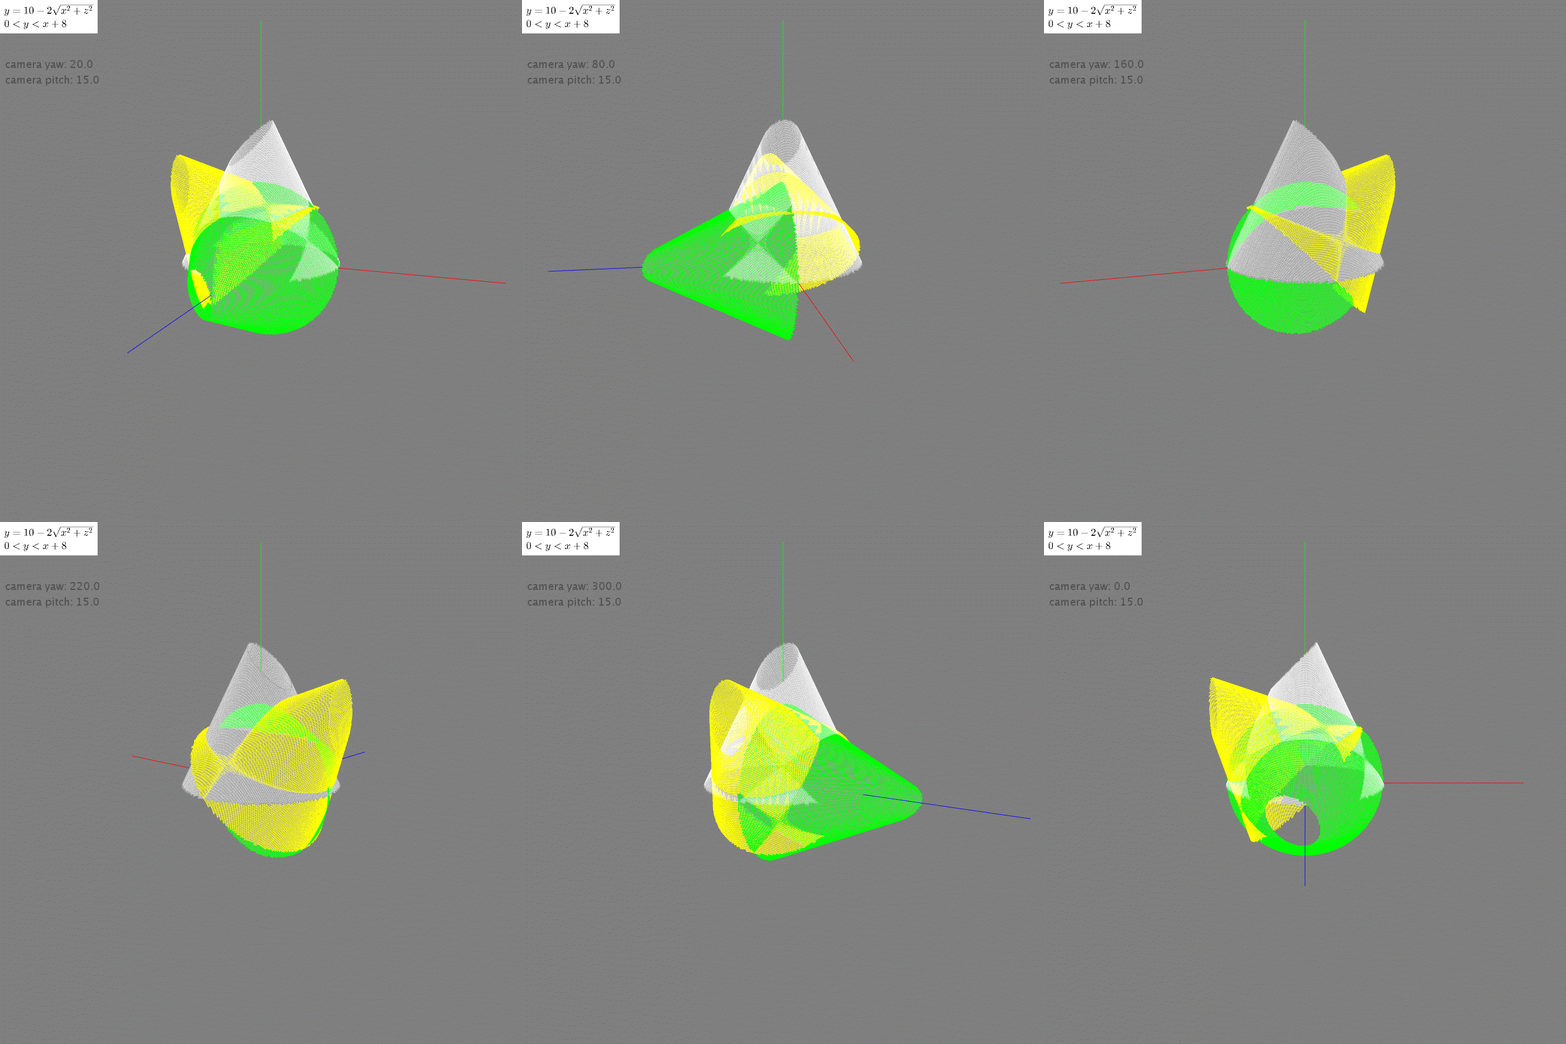
回転は「行列の積」で実行できます。2次元の回転の時は意識しませんでしたが、3次元の場合は回転する軸を決めてやらなければなりません。matrix_rotate_3d関数では、第3引数で回転軸を指定します。3次元の回転行列がどのように実装されているか、コードリーディングしてみてください。
上記の図は、z軸回転45度、x軸回転90度の行列変換を行っています。3軸の回転を適切に行うことで、あらゆる姿勢を実現できます。
スキュー(せん断)
$$
\begin{pmatrix}
1 & tan{\alpha} & 0 \\
tan{\beta} & 1 & 0\\
0 & 0 & 1 \\
\end{pmatrix} --- z軸スキュー \\
\begin{pmatrix}
1 & 0 & 0 \\
0 & 1 & tan{\alpha} \\
0 & tan{\beta} & 1 \\
\end{pmatrix} --- x軸スキュー \\
\begin{pmatrix}
tan{\alpha} & 0 & 1 \\
0 & 1 & 0 \\
1 & 0 & tan{\beta} \\
\end{pmatrix} --- y軸スキュー \\
$$
# # 回転
# angle1 = PI / 4
# stroke(colors[4][0], colors[4][1], colors[4][2])
# set_polygon(matrix_rotate_3d(vertexes, angle1))
# angle2 = PI / 2
# stroke(colors[5][0], colors[5][1], colors[5][2])
# set_polygon(matrix_rotate_3d(vertexes, angle2, 'x'))
# スキュー(せん断)
angles1 = (PI / 5, 0)
stroke(colors[6][0], colors[6][1], colors[6][2])
set_polygon(matrix_skew_3d(vertexes, angles1))
angles2 = (0, PI / 5)
stroke(colors[7][0], colors[7][1], colors[7][2])
set_polygon(matrix_skew_3d(vertexes, angles2))

...

# スキュー(せん断)
def matrix_skew_3d(a, angles, axis='z'):
    if axis == 'x':
        conversion_matrix = [
            [1, 0, 0],
            [0, 1, tan(angles[0])],
            [0, tan(angles[1]), 1],
        ]
    elif axis == 'y':
        conversion_matrix = [
            [tan(angles[0]), 0, 1],
            [0, 1, 0],
            [1, 0, tan(angles[1])],
        ]
    else:
        conversion_matrix = [
            [1, tan(angles[0]), 0],
            [tan(angles[1]), 1, 0],
            [0, 0, 1],
        ]
    return matrix_transpose(
        matrix_mult(conversion_matrix, matrix_transpose(a))
    )
スキューは図形を斜めに引き伸ばす処理のことです。「行列の積」により実行できます。回転と同様に、x軸、y軸、z軸に対してそれぞれスキューが定義されます。
上の図は z軸に対して、x方向、y方向にそれぞれ 36度せん断したものです。せん断は少しわかりづらいので、コードを修正して何度か試してみてください。
発展的課題 行列変換の合成
一通り、行列による図形の変換を見てきました。最後に残された課題は、行列変換の合成です。たとえば x軸で30度回転してから、z軸で90度回転した図形と、その逆順で変換した図形は同じ姿勢になるでしょうか。違った姿勢になるでしょうか。
$$
\begin{pmatrix}
cos{\pi / 2} & - sin{\pi / 2} & 0 \\
sin{\pi / 2} & cos{\pi / 2} & 0\\
0 & 0 & 1 \\
\end{pmatrix}
\times
\begin{pmatrix}
1 & 0 & 0 \\
0 &cos{\pi / 6} & - sin{\pi / 6} \\
0 & sin{\pi / 6} & cos{\pi / 6} \\
\end{pmatrix}
\times
\begin{pmatrix}
x \\ y \\ z \\
\end{pmatrix} \\
\begin{pmatrix}
1 & 0 & 0 \\
0 &cos{\pi / 6} & - sin{\pi / 6} \\
0 & sin{\pi / 6} & cos{\pi / 6} \\
\end{pmatrix}
\times
\begin{pmatrix}
cos{\pi / 2} & - sin{\pi / 2} & 0 \\
sin{\pi / 2} & cos{\pi / 2} & 0\\
0 & 0 & 1 \\
\end{pmatrix}
\times
\begin{pmatrix}
x \\ y \\ z \\
\end{pmatrix} \\
$$
# 回転の合成
angle1 = PI / 6
angle2 = PI / 2
stroke(colors[8][0], colors[8][1], colors[8][2])
set_polygon(
    matrix_rotate_3d(
        matrix_rotate_3d(
            vertexes, angle1, 'x'
        ), angle2, 'z'
    )
)
stroke(colors[9][0], colors[9][1], colors[9][2])
set_polygon(
    matrix_rotate_3d(
        matrix_rotate_3d(
            vertexes, angle2, 'z'
        ), angle1, 'x'
    )
)
ヒントのコードを載せて置きます。自分のパソコンで実行してみましょう。3次元変換の合成はとらえ難く、コツを掴むのが大変です。数値や軸を変更して何度も実行することで、「そういうことか!(Eureka)」と実感できる瞬間があるはずです。
前の記事
Processing でグラフを描く⑫ 行列による図形の変換
次の記事
Processing でグラフを描く⑭ ストレンジアトラクター
その他のタイトルはこちら
