
ChatGPTグラフ作成用 サンプルコード集 (Google Charts)

1. はじめに
1.1 説明
前回の記事で解説しましたとおり, ChatGPTを用いたグラフ作成では非常に詳細なプロンプトが必要です。しかし, 一度テンプレート (サンプルコード) を作成すれば, 次回から「このサンプルとこのデータセットを使って~のようなグラフを作ってください。」など雑なプロンプトで正確かつ迅速にグラフ作成してもらえます。モデルは迅速性の観点からもGPT 3.5が推奨されます。実用性は今の所 80%程度位です。エクセルで一から作るよりは速いかなというところです。精度を上げればそのうちテキストファイルから自動で症例報告, 入院後経過などで使うグラフ作成ができそうです。というわけで以下のサンプルを使ってより精度の高いコードに利用してください。
1.2 使い方, プロンプトの仕方
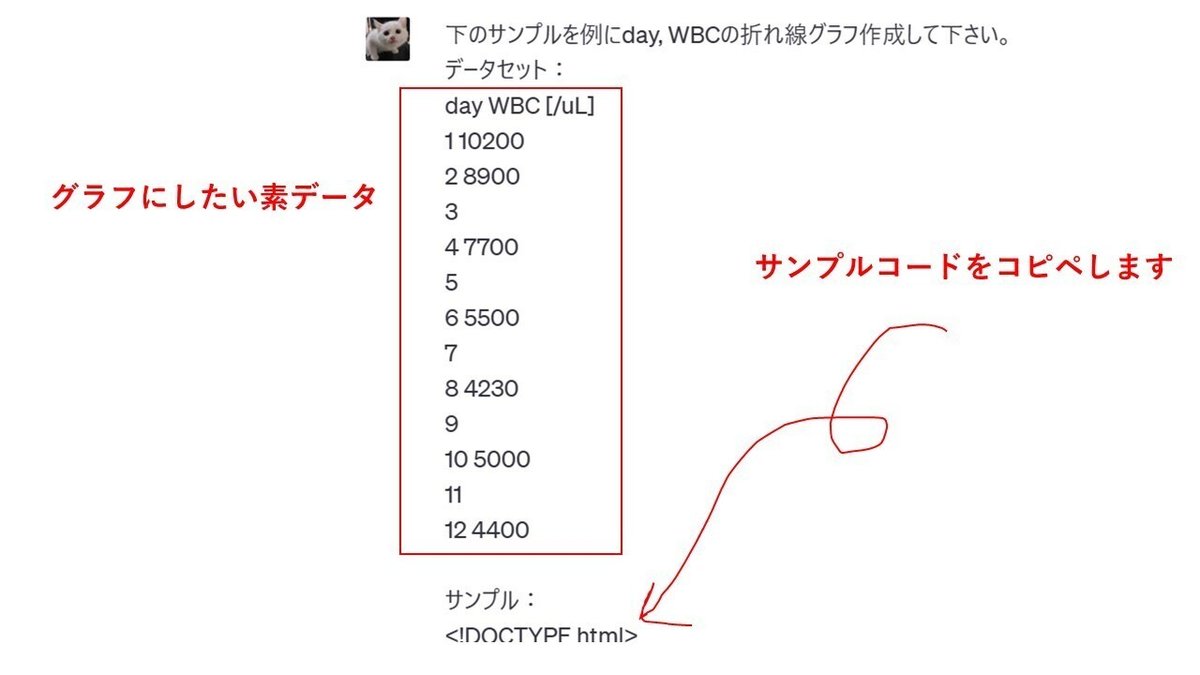
① 下のほうにサンプルを置いときますので, コピーしChatGPTに張り付けてください。
② プロンプトは「下のサンプルを例にデータセット〇〇で折れ線グラフを作成して下さい」などで詳細なプロンプトは不要です。
③ 同じchat欄で 「マーカーは三角, 12pt, 色は黄色に変更, 次は入院日数のを5日で△のデータセットで作成して下さい」など自然な言語で直感的なプロンプトで作成できます。
④ Google charts html形式で出力されますので. テキストファイルに一旦保存してweb ブラウザで開きます。
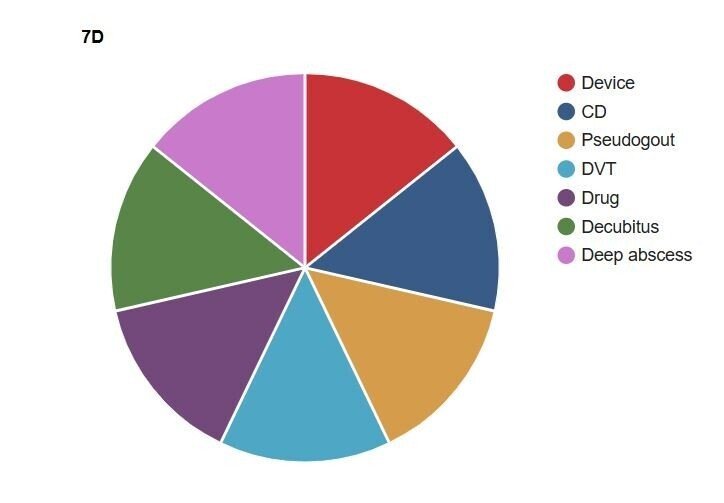
2. 円グラフ
<!DOCTYPE html>
<html>
  <head>
    <style>
      .google-visualization-legend-label {
        color: inherit !important;
      }
    </style>
    <script type="text/javascript" src="https://www.gstatic.com/charts/loader.js"></script>
    <script type="text/javascript">
      google.charts.load('current', {'packages':['corechart']});
      google.charts.setOnLoadCallback(drawChart);

      function drawChart() {
        var data = google.visualization.arrayToDataTable([
          ['Condition', ''],
          ['Device', 1],
          ['CD', 1],
          ['Pseudogout', 1],
          ['DVT', 1],
          ['Drug', 1],
          ['Decubitus', 1],
          ['Deep abscess', 1]
        ]);

        var options = {
          title: '7D',
          colors: ['#c83337', '#395b87', '#d59c4c', '#4ea7c5', '#73497b', '#598549', '#ca7aca'],
          slices: {
            0: {offset: 0.01},
            1: {offset: 0.01},
            2: {offset: 0.01},
            3: {offset: 0.01},
            4: {offset: 0.01},
            5: {offset: 0.01},
            6: {offset: 0.01}
          },
          pieSliceText: 'none',
          legend: {
            position: 'right',
            textStyle: {
              color: 'inherit'
            }
          },
          pieStartAngle: 0
        };

        var chart = new google.visualization.PieChart(document.getElementById('piechart_3d'));
        chart.draw(data, options);
      }
    </script>
  </head>
  <body>
    <div id="piechart_3d" style="width: 900px; height: 500px;"></div>
  </body>
</html>
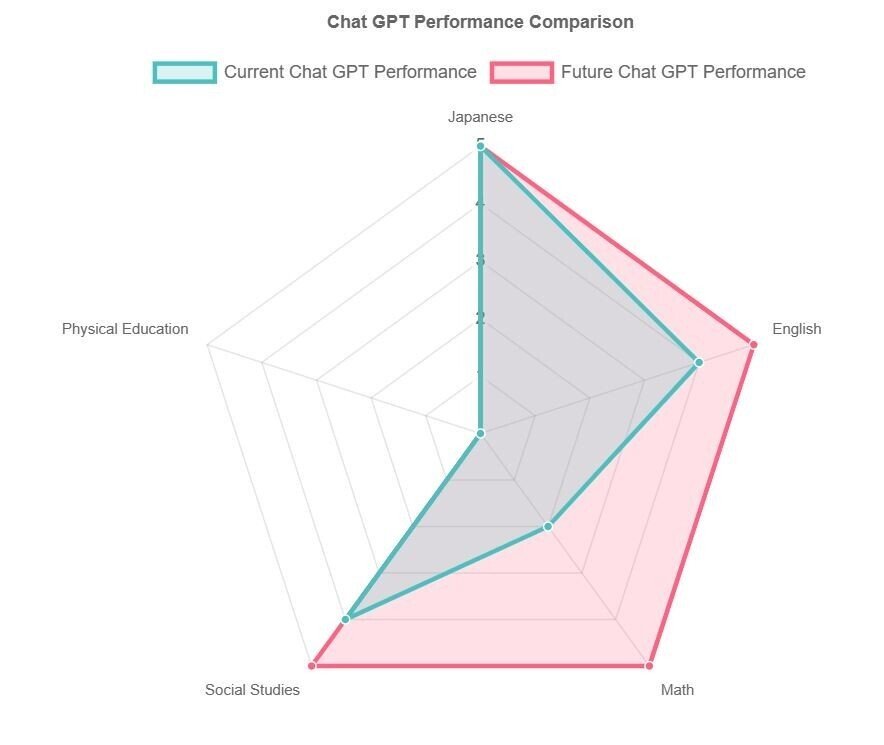
3. レーダーチャート radar chart
<!DOCTYPE html>
<html>
<head>
	<title></title>
	<script src="https://cdn.jsdelivr.net/npm/chart.js"></script>
</head>
<body>
	<canvas id="chart_div" width="500" height="500"></canvas>
	<script>
		const ctx = document.getElementById('chart_div').getContext('2d');
		const data = {
			labels: ['Japanese', 'English', 'Math', 'Social Studies', 'Physical Education'],
			datasets: [
				{
					label: 'Current Chat GPT Performance',
					data: [5, 4, 2, 4, 0],
					fill: true,
					backgroundColor: 'rgba(75, 192, 192, 0.2)',
					borderColor: 'rgb(75, 192, 192)',
					pointBackgroundColor: 'rgb(75, 192, 192)',
					pointBorderColor: '#fff',
					pointHoverBackgroundColor: '#fff',
					pointHoverBorderColor: 'rgb(75, 192, 192)'
				},
				{
					label: 'Future Chat GPT Performance',
					data: [5, 5, 5, 5, 0],
					fill: true,
					backgroundColor: 'rgba(255, 99, 132, 0.2)',
					borderColor: 'rgb(255, 99, 132)',
					pointBackgroundColor: 'rgb(255, 99, 132)',
					pointBorderColor: '#fff',
					pointHoverBackgroundColor: '#fff',
					pointHoverBorderColor: 'rgb(255, 99, 132)'
				}
			]
		};
		const config = {
			type: 'radar',
			data: data,
			options: {
				responsive: true,
				maintainAspectRatio: false,
				plugins: {
					legend: {
						position: 'top',
					},
					title: {
						display: true,
						text: 'Chat GPT Performance Comparison'
					}
				},
				scales: {
					r: {
						ticks: {
							stepSize: 1,
						}
					}
				}
			},
		};
		const myChart = new Chart(ctx, config);
	</script>
</body>
</html>
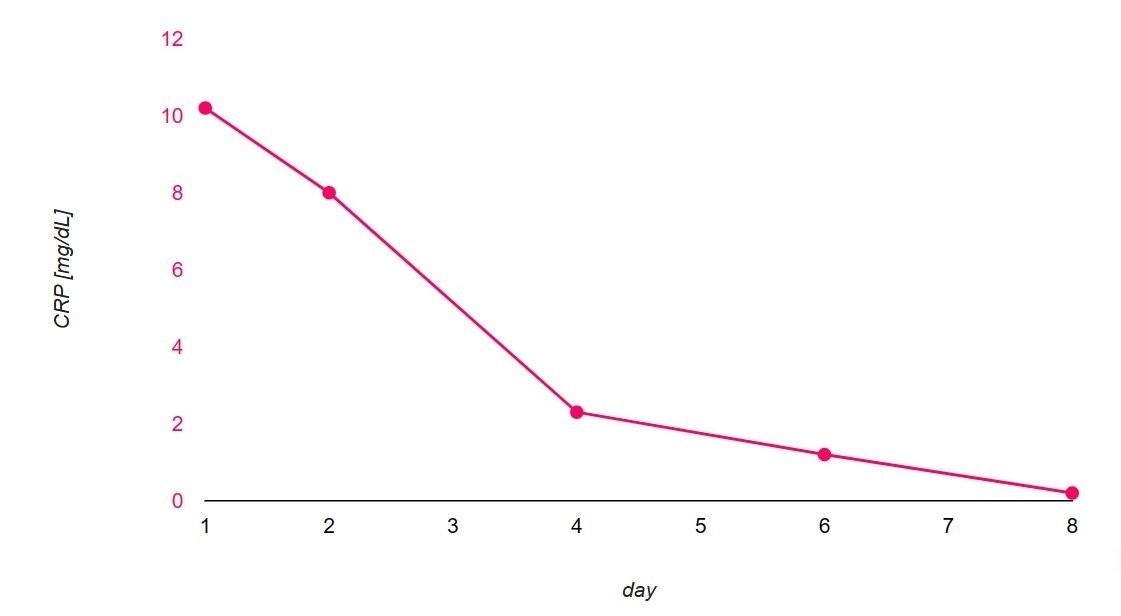
4. 折れ線グラフ
4.1 1軸
<!DOCTYPE html>
<html>
<head>
	<title></title>
	<script type="text/javascript" src="https://www.gstatic.com/charts/loader.js"></script>
	<script type="text/javascript">
		google.charts.load('current', {'packages':['corechart']});
		google.charts.setOnLoadCallback(drawChart);

		function drawChart() {
			var data = google.visualization.arrayToDataTable([
				['day', 'CRP'],
				[1, 10.2],
				[2, 8.0],
				[3, null],
				[4, 2.3],
				[5, null],
				[6, 1.2],
				[7, null],
				[8, 0.2]
			]);

			var options = {
				curveType: 'none',
				interpolateNulls: true,
				pointShape: 'circle',
				pointSize: 7,
				backgroundColor: 'transparent',
				hAxis: {
					title: 'day',
					textStyle: {color: '#FF0064'},
					gridlines: {color: 'transparent'},
					ticks: [1, 2, 3, 4, 5, 6, 7, 8],
					textStyle: {color: '#000'}
				},
				vAxis: {
					title: 'CRP [mg/dL]',
					textStyle: {color: '#FF0064'},
					baselineColor: '#000',
					gridlines: {color: 'transparent'}
				},
				colors: ['#FF0064'],
				legend: 'none',
				width: 900,
				height: 500
			};

			var chart = new google.visualization.LineChart(document.getElementById('chart_div'));
			chart.draw(data, options);
		}
	</script>
</head>
<body>
	<div id="chart_div"></div>
</body>
</html>
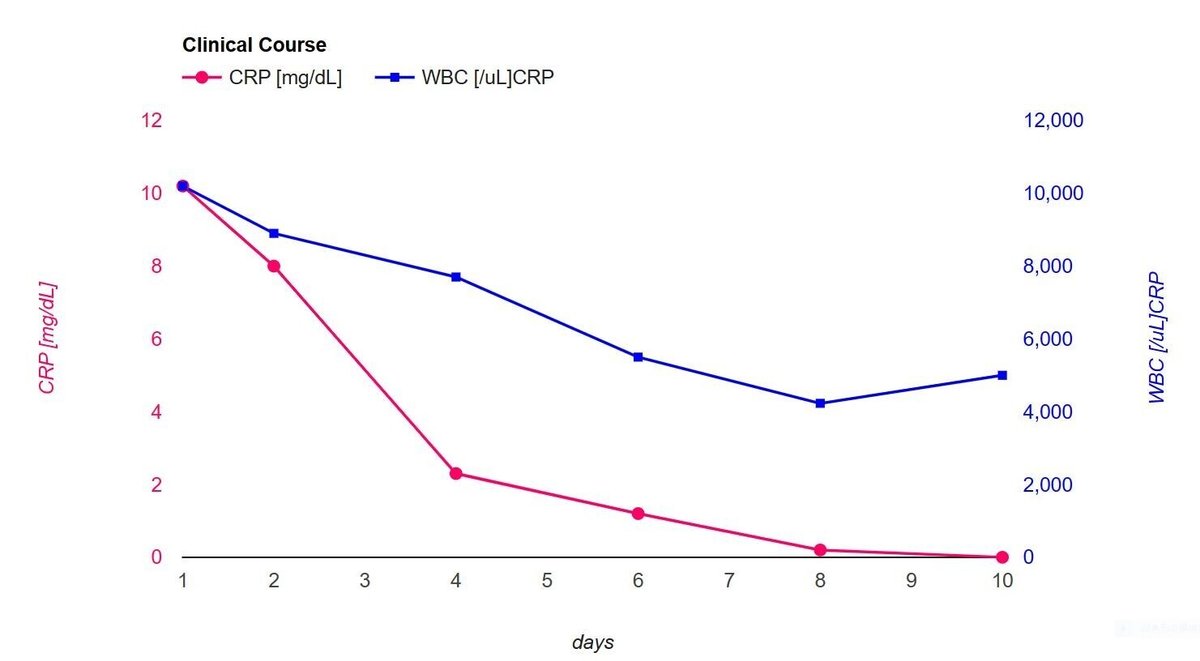
4.2 2軸
<!DOCTYPE html>
<html>
<head>
  <title>Clinical Course</title>
  <script type="text/javascript" src="https://www.gstatic.com/charts/loader.js"></script>
  <script type="text/javascript">
    google.charts.load('current', {packages: ['corechart']});
    google.charts.setOnLoadCallback(drawChart);

    function drawChart() {
      var data = google.visualization.arrayToDataTable([
        ['days', 'CRP [mg/dL]', 'WBC [/uL]CRP'],
        [1, 10.2, 10200],
        [2, 8.0, 8900],
        [3, null, null],
        [4, 2.3, 7700],
        [5, null, null],
        [6, 1.2, 5500],
        [7, null, null],
        [8, 0.2, 4230],
        [9, null, null],
        [10, 0.0, 5000]
      ]);

      var options = {
        title: 'Clinical Course',
        curveType: 'none',
        interpolateNulls: true,
        width: 900,
        height: 500,
        vAxes: {
          0: {
            title: 'CRP [mg/dL]',
            titleTextStyle: {color: '#FF0064'},
            viewWindow: {min: 0},
            textStyle: {color: '#FF0064'},
            gridlines: {color: 'transparent'}
          },
          1: {
            title: 'WBC [/uL]CRP',
            titleTextStyle: {color: '#0000FF'},
            viewWindow: {min: 0},
            textStyle: {color: '#0000FF'},
            gridlines: {color: 'transparent'}
          }
        },
        hAxis: {
          title: 'days',
          ticks: [1, 2, 3, 4, 5, 6, 7, 8, 9, 10],
          gridlines: {color: 'transparent'}
        },
        series: {
          0: {targetAxisIndex: 0, color: '#FF0064', pointShape: 'circle', pointSize: 7},
          1: {targetAxisIndex: 1, color: '#0000FF', pointShape: 'square', pointSize: 7}
        },
        baselineColor: 'black'
      };

      var chart = new google.visualization.LineChart(document.getElementById('chart_div'));
      chart.draw(data, options);
    }
  </script>
</head>
<body>
  <div id="chart_div"></div>
</body>
</html>
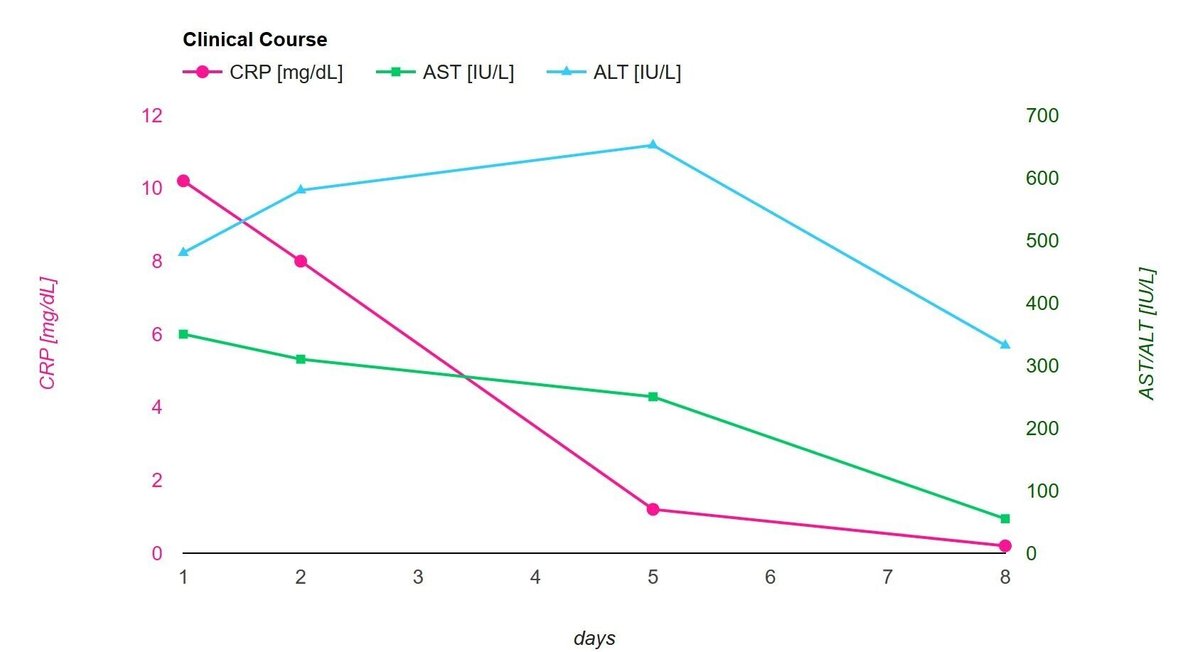
4.3 2軸3変数
上のグラフをプロンプト「先ほどのプロンプトを左CRP右AST/ALTで作り直してください」で何回かやりとりして作ったグラフです。
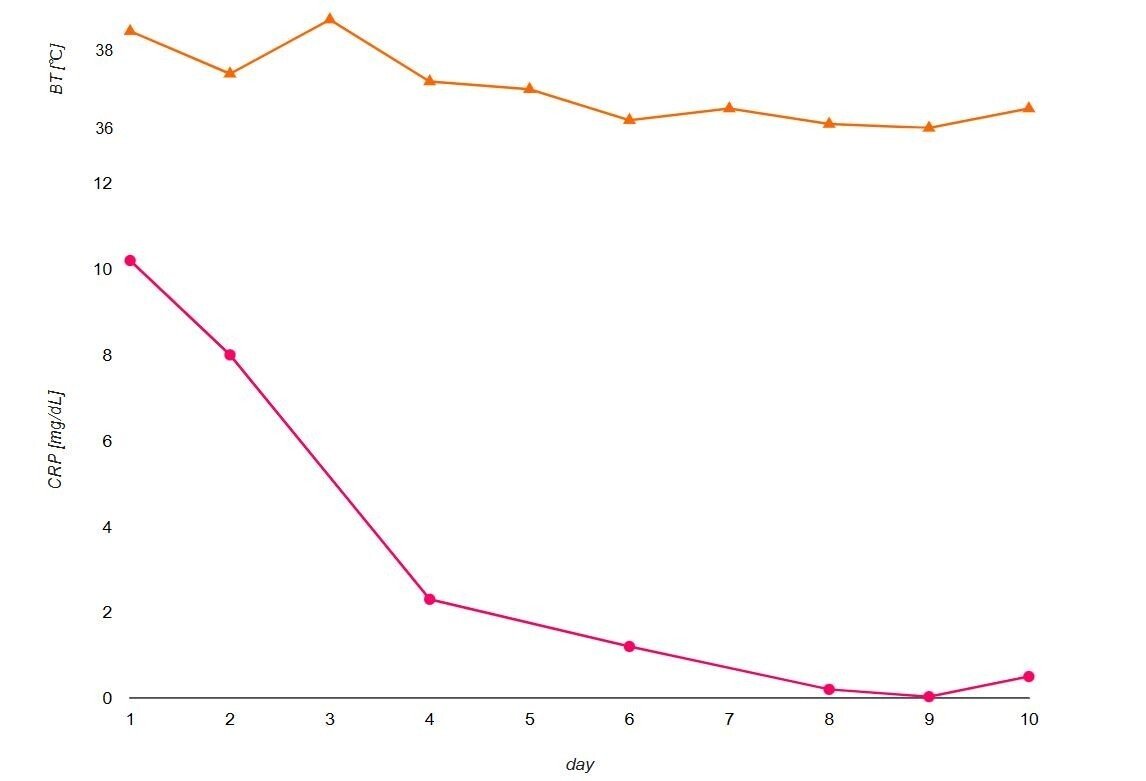
4.4 1軸+1軸 (縮小)
1軸のグラフを参考にして, 縮小グラフ(体温)を並べて表示。何度も作り直ししてもらいました。
<!DOCTYPE html>
<html>
<head>
    <title></title>
    <script type="text/javascript" src="https://www.gstatic.com/charts/loader.js"></script>
    <script type="text/javascript">
        google.charts.load('current', { 'packages': ['corechart'] });
        google.charts.setOnLoadCallback(drawCharts);

        function drawCharts() {
            drawBTChart();
            drawCRPChart();
        }

        function drawBTChart() {
            var data = google.visualization.arrayToDataTable([
                ['day', 'BT [℃]'],
                [1, 38.5],
                [2, 37.4],
                [3, 38.8],
                [4, 37.2],
                [5, 37.0],
                [6, 36.2],
                [7, 36.5],
                [8, 36.1],
                [9, 36.0],
                [10, 36.5]
            ]);

            var options = getCommonChartOptions();
            options.vAxis.title = 'BT [℃]';
            options.colors = ['#FF6600'];
            options.height = 125;
            options.chartArea = { left: '10%', top: '10%', width: '80%', height: '75%' };
            options.hAxis.title = null;
            options.hAxis.ticks = [];
            options.pointShape = 'triangle';
            options.pointSize = 10;
options.vAxis.viewWindow = {
        min: 36,
        max: 39
    };
            var chart = new google.visualization.LineChart(document.getElementById('bt_chart_div'));
            chart.draw(data, options);
        }

        function drawCRPChart() {
            var data = google.visualization.arrayToDataTable([
                ['day', 'CRP'],
                [1, 10.2],
                [2, 8.0],
                [3, null],
                [4, 2.3],
                [5, null],
                [6, 1.2],
                [7, null],
                [8, 0.2],
                [9, 0.03],
                [10, 0.5]
            ]);

            var options = getCommonChartOptions();
            options.vAxis.title = 'CRP [mg/dL]';
            options.colors = ['#FF0064'];
            options.height = 550;
            options.chartArea = { left: '10%', top: '10%', width: '80%', height: '75%' };
            options.hAxis.title = 'day';
            options.hAxis.ticks = [1, 2, 3, 4, 5, 6, 7, 8, 9, 10];

            var chart = new google.visualization.LineChart(document.getElementById('crp_chart_div'));
            chart.draw(data, options);
        }

        function getCommonChartOptions() {
            return {
                curveType: 'none',
                interpolateNulls: true,
                pointShape: 'circle',
                pointSize: 7,
                backgroundColor: 'transparent',
                hAxis: {
                    textStyle: { color: '#000' },
                    gridlines: { color: 'transparent' }
                },
                vAxis: {
                    textStyle: { color: '#000' },
                    baselineColor: '#000',
                    gridlines: { color: 'transparent' },
                    minValue: 0
                },
                legend: 'none',
                width: 900
            };
        }
    </script>
    <style        <style>
            .chart-container {
                width: 900px;
                margin: 0 auto;
            }

            #bt_chart_div {
                height: 125px;
            }

            #crp_chart_div {
                margin-top: -30px;
                height: 550px;
            }
        </style>
    </head>

    <body>
        <div class="chart-container">
            <div id="bt_chart_div"></div>
            <div id="crp_chart_div"></div>
        </div>
    </body>

</html>
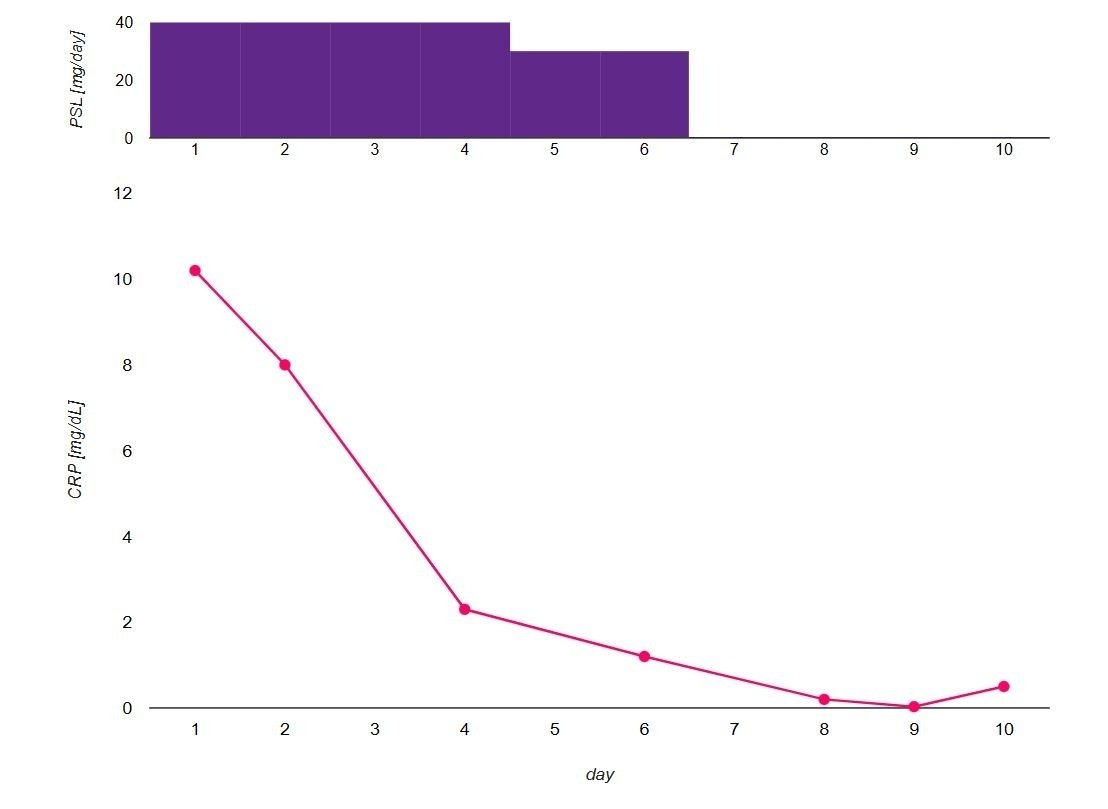
上のグラフをプレドニンの投与量 (棒グラフ) に変更してもらいました。
<!DOCTYPE html>
<html>
<head>
    <title></title>
    <script type="text/javascript" src="https://www.gstatic.com/charts/loader.js"></script>
    <script type="text/javascript">
        google.charts.load('current', { 'packages': ['corechart', 'bar'] });
        google.charts.setOnLoadCallback(drawCharts);

        function drawCharts() {
            drawPSLChart();
            drawCRPChart();
        }

        function drawPSLChart() {
            var data = google.visualization.arrayToDataTable([
                ['day', 'PSL [mg/day]'],
                ['1', 40],
                ['2', 40],
                ['3', 40],
                ['4', 40],
                ['5', 30],
                ['6', 30],
                ['7', 0],
                ['8', 0],
                ['9', 0],
                ['10', 0]
            ]);

            var options = getCommonChartOptions();
            options.vAxis.title = 'PSL [mg/day]';
            options.colors = ['#602888'];
            options.height = 125; // Change the height here
            options.chartArea = { left: '10%', top: '10%', width: '80%', height: '75%' };
            options.hAxis.title = null;
            options.hAxis.ticks = [];
            options.bar = { groupWidth: '100%' };

            var chart = new google.visualization.ColumnChart(document.getElementById('psl_chart_div'));
            chart.draw(data, options);
        }

        function drawCRPChart() {
            var data = google.visualization.arrayToDataTable([
                ['day', 'CRP'],
                ['1', 10.2],
                ['2', 8.0],
                ['3', null],
                ['4', 2.3],
                ['5', null],
                ['6', 1.2],
                ['7', null],
                ['8', 0.2],
                ['9', 0.03],
                ['10', 0.5]
            ]);

            var options = getCommonChartOptions();
            options.vAxis.title = 'CRP [mg/dL]';
            options.colors = ['#FF0064'];
            options.height = 550;
            options.chartArea = { left: '10%', top: '10%', width: '80%', height: '75%' };
            options.hAxis.title = 'day';
            options.hAxis.ticks = ['1', '2', '3', '4', '5', '6', '7', '8', '9', '10'];

            var chart = new google.visualization.LineChart(document.getElementById('crp_chart_div'));
            chart.draw(data, options);
        }

        function getCommonChartOptions() {
            return {
                curveType: 'none',
                interpolateNulls: true,
                pointShape: 'circle',
                pointSize: 7,
                backgroundColor: 'transparent',
                hAxis: {
                    textStyle: { color: '#000' },
                    gridlines: { color: 'transparent' }
                },
                vAxis: {
                    textStyle: { color: '#000' },
                    baselineColor: '#000',
                    gridlines: { color: 'transparent' },
                    minValue: 0
                },
                legend: 'none',
                width: 900
            };
        }
    </script>
    <style>
        .chart-container {
            width: 900px;
            margin: 0 auto;
        }

        #psl_chart_div {
            height
            height: 125px; /* Change the height here */
        }

        #crp_chart_div {
            margin-top: -30px;
            height: 500px;
        }
    </style>
</head>

<body>
    <div class="chart-container">
        <div id="psl_chart_div"></div>
        <div id="crp_chart_div"></div>
    </div>
</body>

</html>
5. まとめ
詳細なプロンプトが必要なので初めの作成が大変です。しかし次回以降は「このコードを参考に〇〇を作ってください」とプロンプトするだけで別のグラフを作ってくれます。htmlコード自体がChatGPTが理解しやすいAIからみると極めて詳細なプロントなので, こまかなニュアンスのずれも生じません。次回以降, 新たな種類のグラフ作成にかかる時間が短縮されていっていますので, これこそAIの利点と言えます。