
R | ggplot | scale_x_discrete |x軸(離散値)を並び替えたい

*ハイライト*
・ggplotで棒グラフのX軸の並び替えができるようになる
・scale_x_discrete(limit = c())でX軸(離散値)の順番が決める
・連続数であれば scale_x_reverse()でもできる
install.packages("tidyverse")
library(ggplot2)

df <- data.frame(
 subject = c("x1", "x2", "x3", "x4", "x5", "x6"),
 weight = c(45, 53, 56, 72, 65, 50))
head(df, 2)

g <- ggplot(df, aes(x = subject, y = weight))+
 geom_bar(stat = "identity")+
 scale_x_discrete(limit = c("x6", "x5", "x4", "x3", "x2", "x1"))
plot(g)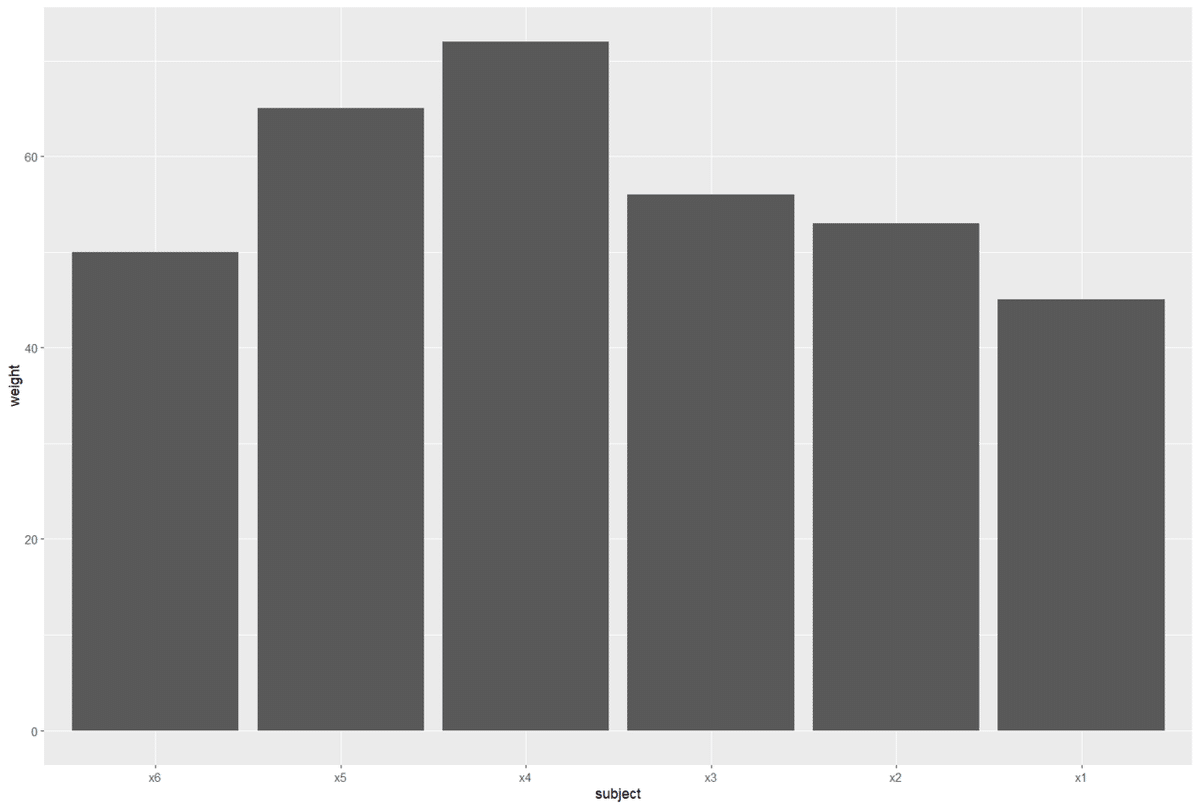
コードの説明
#パッケージのインストール
最初にパッケージをRにインストールしましょう。gglpot2はtidyverseはパッケージに内包されているので,tidyverseをインストールし,ggplot2をライブラリーします。
install.packages("tidyverse")
library(ggplot2)
#データフレームの作成
ggplotで棒グラフを作成するために被験者6人の体重を表しているデータフレームを作成します。subjectは「被験者」を,weightは「体重」を表しています。
df <- data.frame(
 subject = c("x1", "x2", "x3", "x4", "x5", "x6"),
 weight = c(45, 53, 56, 72, 65, 50))
head(df, 2)
subject weight
1 x1 45
2 x2 53
: : :
#棒グラフの描画
ggplotで被験者をX軸に,体重をY軸にマッピングし,体重の値に従って棒グラフを作成します。まずggplotのなかに使用するデータフレーム,データセットの中の変数をX軸やY軸に割り当てます。今回は体重の値をそのまま表示させたいので,geom_bar()の中身をstat = "idenetity"にしました(1)。
g <- ggplot(df, aes(x = subject, y = weight))+
 geom_bar(stat = "identity")
plot(g)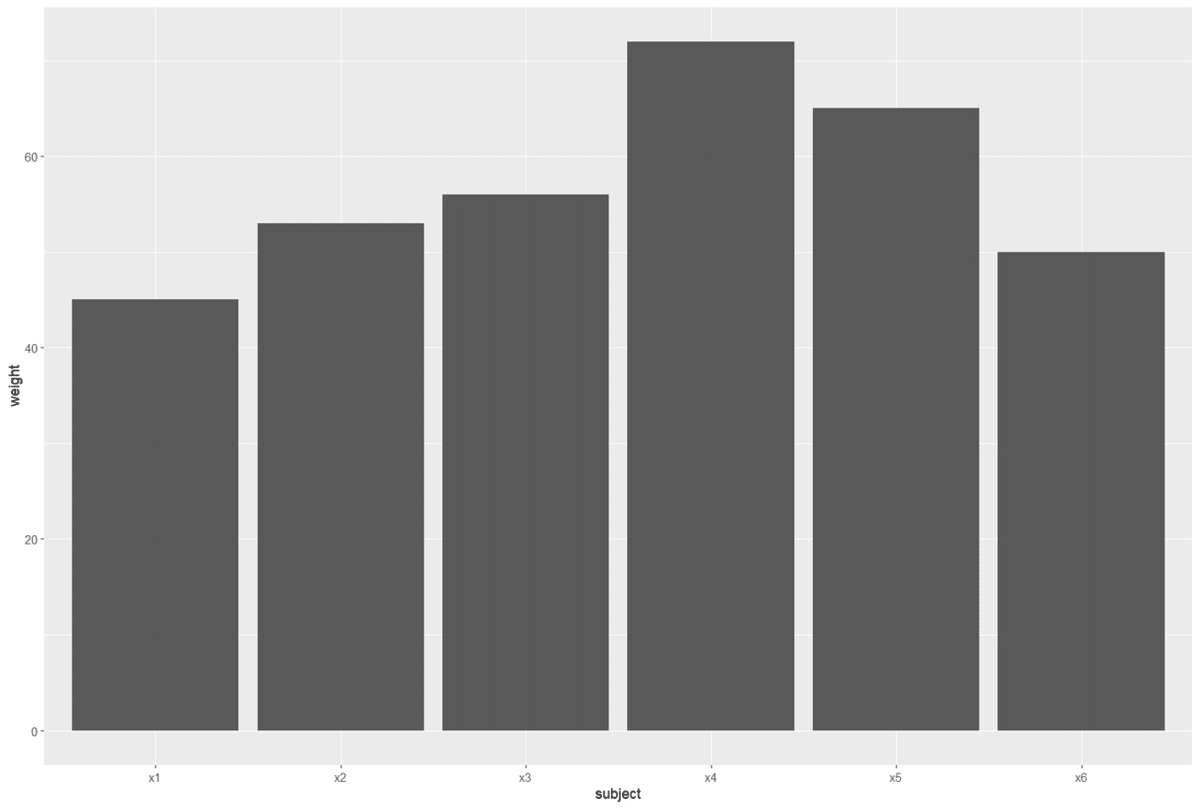
#図のX軸の並び替え
X軸の並び替えをするためにscale_x_discreteでX軸の並び替えをします。scale_x_discreteはX軸が連続値(e.g., 1, 2, 3, etc.,)ではなく離散値(e.g., A,B,C,etc.)の場合に値を設定するときに使います。今回はX軸を反転させたいので,limit = c()でx6から順に値を設定します。
g <- ggplot(df, aes(x = subject, y = weight))+
 geom_bar(stat = "identity")+
 scale_x_discrete(limit = c("x6", "x5", "x4", "x3", "x2", "x1"))
plot(g)
#エラーの出し方1
もしscale_x_continuousでX軸の並び替えをしようとした場合には,今回のZ軸は連続値でないため,エラーが出されます。エラーの内容は離散値が連続値が必要な部分に代入されたことを示しています。
g <- ggplot(df, aes(x = subject, y = weight))+
 geom_bar(stat = "identity")+
 scale_x_continuous(limit = c("x6", "x5", "x4", "x3", "x2", "x1"))
plot(g)
Error: Discrete value supplied to continuous scale
#エラーの出し方2
X軸が連続値であれば,scale_x_reverseでも軸の値を反転することができます。しかし今回は離散値なので,以下のエラーが返されます。
g <- ggplot(df, aes(x = subject, y = weight))+
 geom_bar(stat = "identity")+
 scale_x_reverse()
plot(g)
Error in -x : invalid argument to unary operator

■Rグラフィックスクックブック第2版 ―ggplot2によるグラフ作成のレシピ集/Winston Chang (著), 石井弓美子 (翻訳), 河内崇 (翻訳), 瀬戸山雅人 (翻訳)
■改訂2版 RユーザのためのRStudio[実践]入門〜tidyverseによるモダンな分析フローの世界/松村優哉 (著), 湯谷啓明 (著), 紀ノ定保礼 (著), 前田和寛 (著)
■Rが生産性を高める〜データ分析ワークフロー効率化の実践/igjit (著), atusy (著), hanaori (著)
