
tabpyでPCAを使ってtableau上でクラスタリングを実行

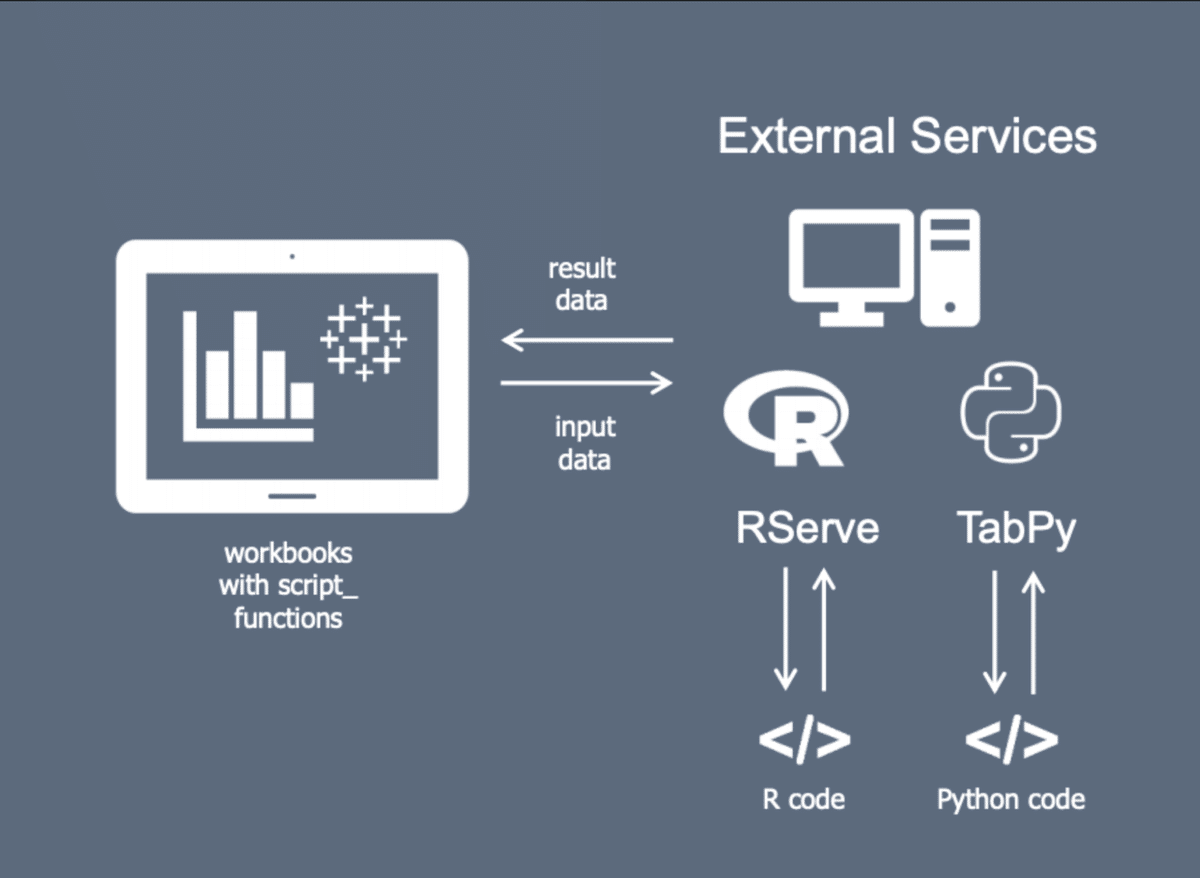
tabpyを使うとtableau上でpythonスクリプトをを実行することができる
こんな感じの仕組みになっている
tabpy serverを作成(Dockerfile)
#Dockerfile

FROM python:3.7
RUN python3 -m pip install --upgrade pip
RUN pip install tabpy
RUN pip install tabpy_client
RUN pip install numpy
RUN pip install scipy

# tabpy server
EXPOSE 9004
# launch tabpy server
CMD ["tabpy"]
build&run
docker build -f Dockerfile . -t tabpy
docker run -it -d -p 9004:9004 tabpy
tabpy serverが立ち上がったら
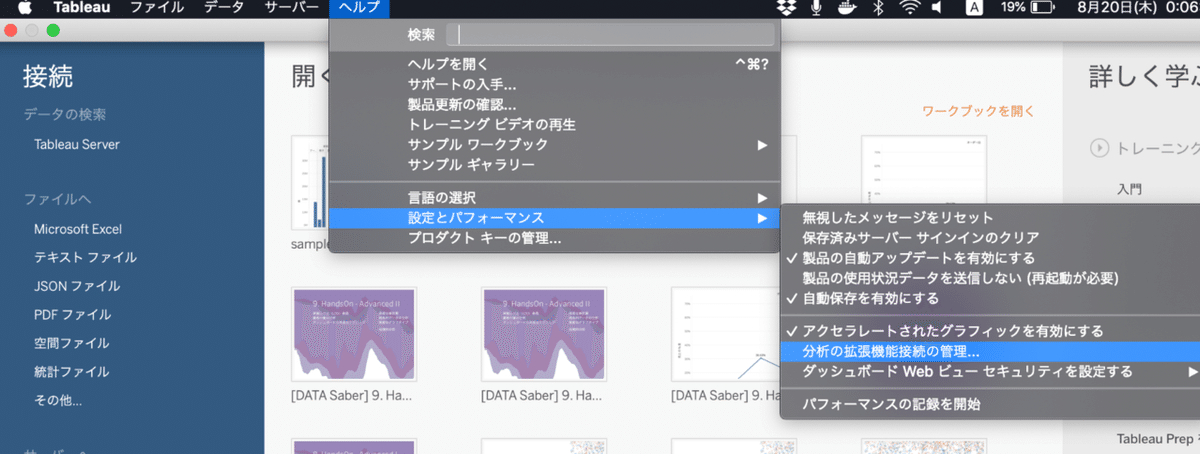
tableauのメニューバー→ヘルプ→設定とパフォーマンス→分析の拡張機能接続の管理
から接続先の設定を行う
スクリプト実行
PCAを適用したあと、クラスター分析してグループ化できたりすると面白いかと思いやってみた
データセットはUCI Machine Learning Repository: Wine Data Setを使用する。データセットにヘッダー名と通し番号(id)を追加している
計算フィールドとして↓を作成。全ての特徴量(13次元)を2次元に次元削減する
script_real("import numpy as np
from sklearn.datasets import load_wine
from sklearn.decomposition import PCA
from sklearn.preprocessing import StandardScaler
x = np.column_stack([_arg1,_arg2,_arg3,_arg4,_arg5,
_arg6, _arg7, _arg8, _arg9,_arg10,_arg11,_arg12,_arg13])
X = StandardScaler().fit_transform(x)
pca = PCA(n_components=2)
comps = pca.fit_transform(X)
return list(comps[:, 0])",
sum([Alcohol]), sum([Total phenols]),
sum([Flavanoids]), sum([Ash]), sum([Proline]),
sum([Hue]), sum([Alcalinity of ash]), sum([Magnesium]),
sum([Malic acid]), sum([Color intensity]),
sum([Nonflavanoid phenols]), sum([Proanthocyanins]),
sum([OD280/OD315 of diluted wines])
)
軸ごとにメジャーとして取り出したいため、returnの列が0/1のものを2つ作成する
可視化するとこんな感じ

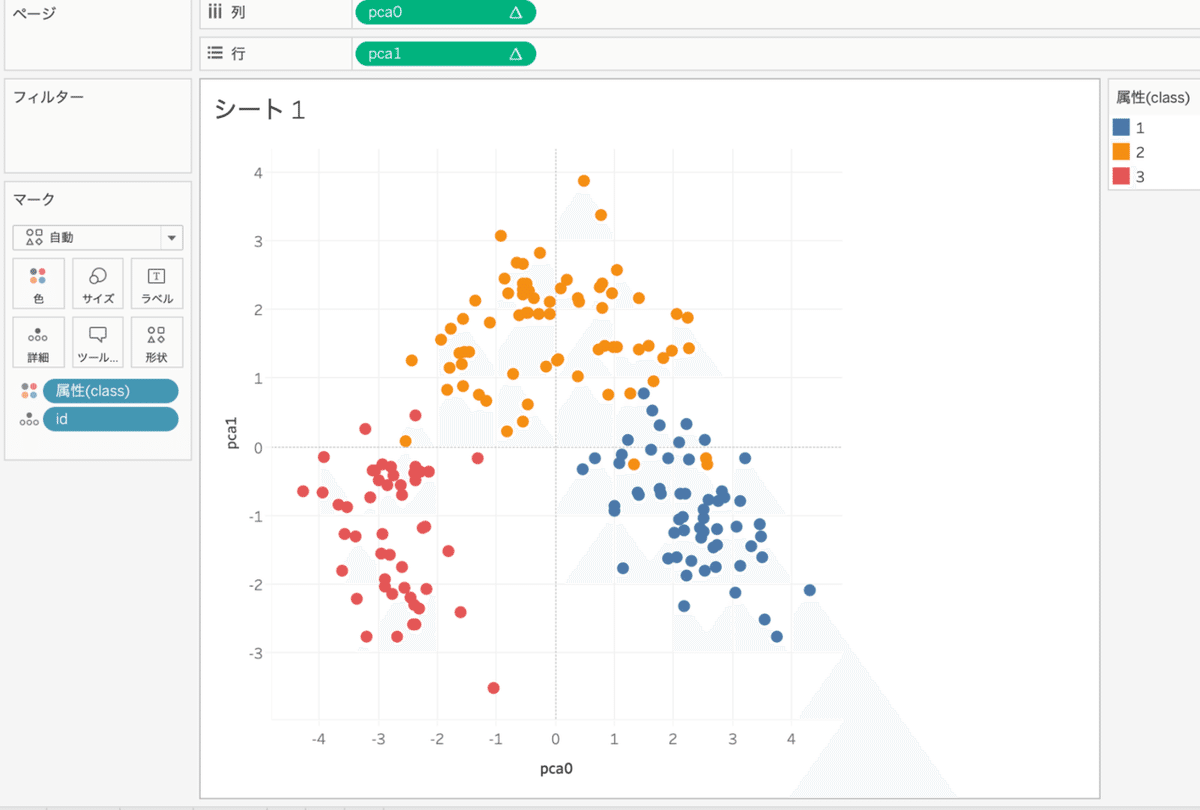
実際にImportance of Feature Scaling — scikit-learn 0.23.2 documentationにあるようなpythonで描画するのと似た図を作ることができた
参考
1. Importance of Feature Scaling — scikit-learn 0.23.2 documentation
2. Pythonで機械学習 - Deployment
3. How I used Naïve Bayes and Logistic Regression to detect Breast Cancer using TabPy – mc.ai