回帰分析とは
説明のためのメモ。
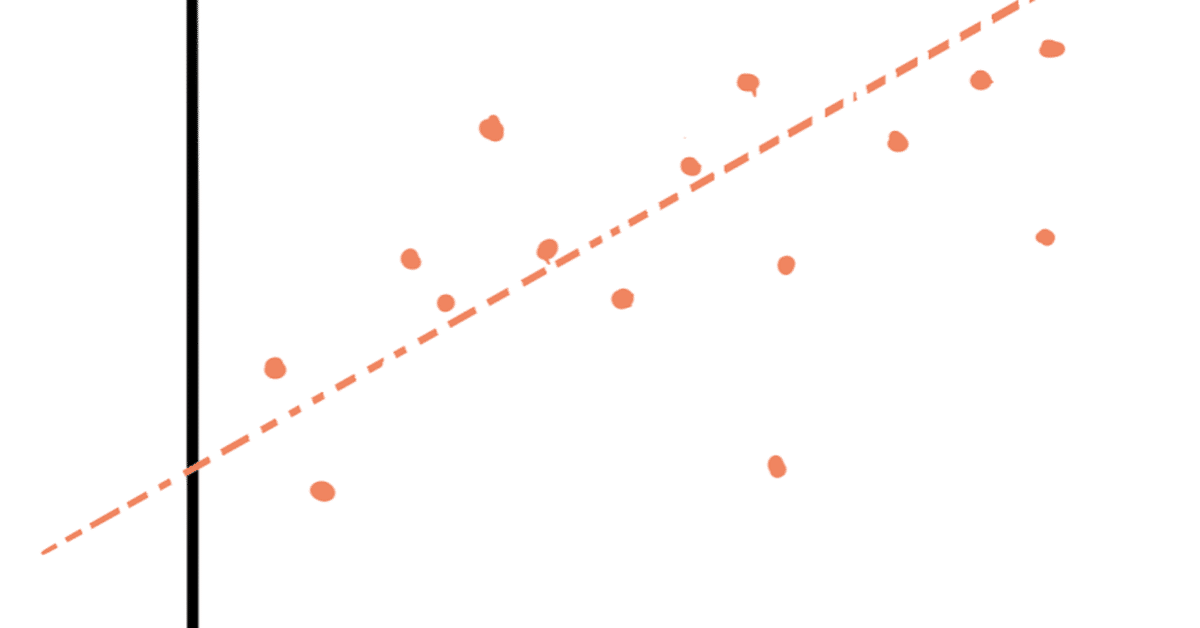
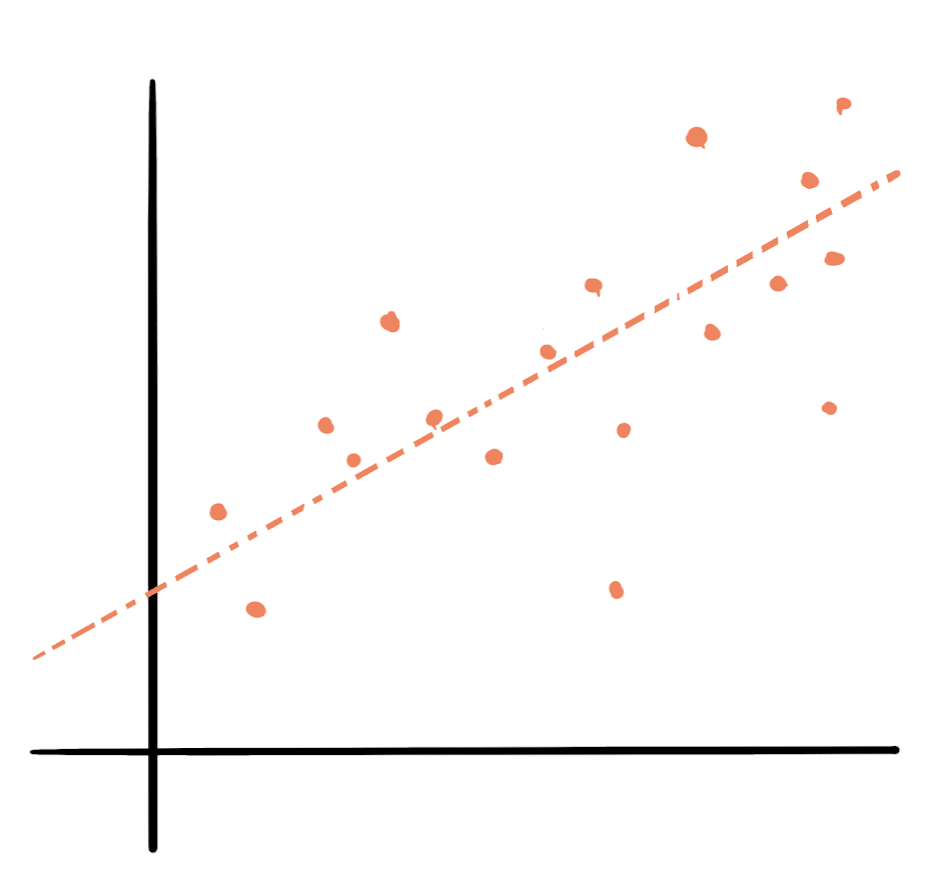
いくつかの変数を持ったデータの集まりを考える。例えば東京都の住宅物件の面積と価格を集めたデータ。これを関数だと考える。面積と価格の関係を表す関数、例えば面積から価格が割り出せる関数がある。もちろん実際のデータはきれいな線になっていないのだけど、そのズレはこの関数にノイズが加わったものだと考える。このときこの関数を予測しようというのが回帰分析。
この関数が手に入れば予測に役立つ。この大きさなら大体この値段かな、とか、広告費から売り上げの変動を予測したりとか。
変数の数は幾つでも良いのだけど想像しづらいので二次元で考える。上の例だと面積が x 、価格が y としてグラフに書ける。

x と y が対等な関係の場合は相関(correlation)、x が yを左右する場合は回帰(regression)。住宅の場合、値段は面積(やその他の条件)を考慮した結果だと考えられるので回帰っぽい。
x が y を左右するとき x を独立変数(independent variable)、y を従属変数(dependent variable)と呼ぶ。
この関数が直線なのが線形回帰(linear regression)。曲線なのが非線形。線形の意味は長くなるのでまた別に書く(かもしれない)。
言葉の由来
regression とは元に戻ること、前の状態に戻ること。Progress(進む、進歩する)とRegressを合わせて覚えると良い。
元々は統計の手法ではなく、極端なデータの値が平均に戻ろうとする傾向のことを指して使われたらしい。So Why Is It Called "Regression," Anyway? という記事に書いてあった。
So here’s the irony: The term regression, as Galton used it, didn't refer to the statistical procedure he used to determine the fit lines for the plotted data point. (略)For Galton, “regression” referred only to the tendency of extreme data values to "revert" to the overall mean value. In a biological sense, this meant a tendency for offspring to revert to average size ("mediocrity") as their parentage became more extreme in size. In a statistical sense, it meant that, with repeated sampling, a variable that is measured to have an extreme value the first time tends to be closer to the mean when you measure it a second time.
