表形式データの分類(FT-Transformer)

はじめに
表形式データの分類モデルを構築します。
概要
adultデータセットを用いて収入を予測するモデルを構築します。
モデルはFT-Transformerを使用します。
FT-Transformer
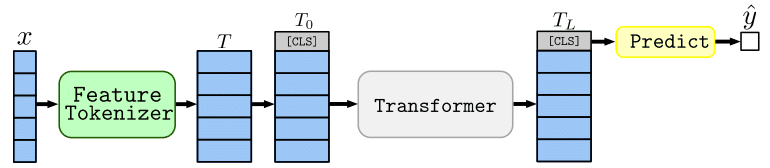
FT-Transformerは、Transformerを表形式データに適用できるように拡張した手法で、Feature TokenizerとTransformerから構成されます。
下の図は提案論文の図です。
Feature Tokenizerでは、入力の各要素をembeddingに変換します。
それに[CLS]トークンを追加し、Transformerに入力します。
[CLS]トークンに対応するTransfomrmerの出力を予測に用います。
Feature Tokenizer
連続値またはカテゴリ変数を連続値のベクトルであるembeddingに変換します(下記提案論文の図(a))。
連続値の場合は、重みを掛けてバイアス項を足すことで変換します。
カテゴリ変数の場合は、カテゴリごとの重みにバイアス項を足すことで変換します。
変数ごとに変換を行い、その結果を結合して、トークン列として扱います。
Transformer
主要な処理としては、multi-head self-attentionとposition-wise feed-forwardで構成されています(下記提案論文の図(b))。
自然言語では、positional encodingも用いますが、表形式のデータでは、変数の順序に意味はないので、FT-Transformerでは用いません。
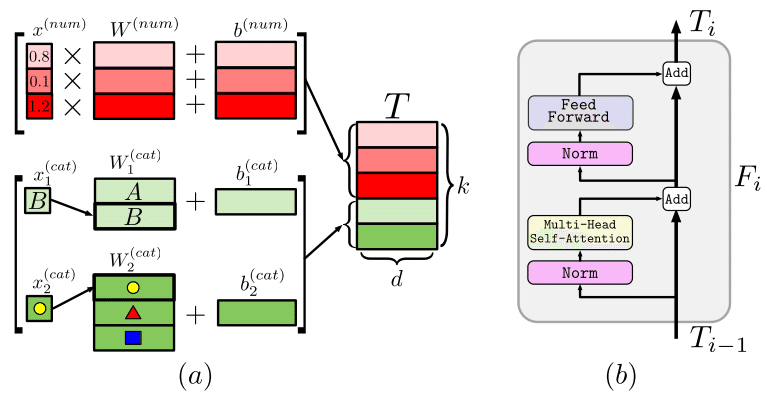
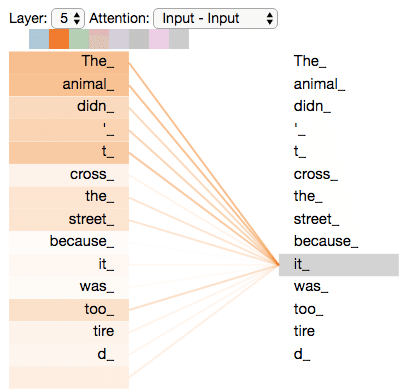
self-attentionでは、各tokenのembeddingを、関連の強いtokenの影響を受けながら更新します。
下記は解説記事の図です。
multi-head self-attentionでは、複数パターンのattentionを用いて、更新を行います。
position-wise feed-forwardでは、単語ごとに全結合層での伝播を行います。
実装
1. ライブラリのインポート
!pip install ucimlrepo
from ucimlrepo import fetch_ucirepo

!pip install pytorch_tabular
import sys
import os

import matplotlib.pyplot as plt
import numpy as np
import pandas as pd
import collections
from sklearn.model_selection import train_test_split

import torch
2. 実行環境の確認
使用するライブラリのバージョンや、GPU環境を確認します。
print('Python:', sys.version)
print('PyTorch:', torch.__version__)
!nvidia-smi
Python: 3.10.12 (main, Nov 20 2023, 15:14:05) [GCC 11.4.0]
PyTorch: 2.1.0+cu121
Sat Jan 20 06:10:57 2024
+---------------------------------------------------------------------------------------+
| NVIDIA-SMI 535.104.05 Driver Version: 535.104.05 CUDA Version: 12.2 |
|-----------------------------------------+----------------------+----------------------+
| GPU Name Persistence-M | Bus-Id Disp.A | Volatile Uncorr. ECC |
| Fan Temp Perf Pwr:Usage/Cap | Memory-Usage | GPU-Util Compute M. |
| | | MIG M. |
|=========================================+======================+======================|
| 0 Tesla T4 Off | 00000000:00:04.0 Off | 0 |
| N/A 45C P8 9W / 70W | 0MiB / 15360MiB | 0% Default |
| | | N/A |
+-----------------------------------------+----------------------+----------------------+
+---------------------------------------------------------------------------------------+
| Processes: |
| GPU GI CI PID Type Process name GPU Memory |
| ID ID Usage |
|=======================================================================================|
| No running processes found |
+---------------------------------------------------------------------------------------+3. データセットの用意
adultデータセットをダウンロードして、学習に使用できる形式に整形します。
adult = fetch_ucirepo(id=2)

X = adult.data.features
y = adult.data.targets['income']

y = y.replace({'<=50K.': 0, '<=50K':0, '>50K.': 1, '>50K': 1})

# カテゴリ変数の特定
categorical = X.columns[X.dtypes == 'object'].tolist()
continuous = X.columns[X.dtypes != 'object'].tolist()


# 教師データとテストデータにランダムに分割
X_train, X_test, y_train, y_test = train_test_split(X, y, test_size=0.3, random_state=42)


print(X_train.shape, X_test.shape)
print(collections.Counter(y_train), collections.Counter(y_test))

X_train['income'] = y_train
X_test['income'] = y_test
4. ニューラルネットワークの定義
今回は5層の全結合ニューラルネットワークを用います。
from pytorch_tabular import TabularModel
from pytorch_tabular.models import FTTransformerConfig
from pytorch_tabular.config import DataConfig, OptimizerConfig, TrainerConfig, ExperimentConfig

data_config = DataConfig(
    target=['income'],
    continuous_cols=continuous,
    categorical_cols=categorical,
)
trainer_config = TrainerConfig(
    auto_lr_find=False,
    batch_size=128,
    max_epochs=100,
)
optimizer_config = OptimizerConfig(
    optimizer_params = {'weight_decay':1e-4}
)

model_config = FTTransformerConfig(
    task="classification",
)

tabular_model = TabularModel(
    data_config=data_config,
    model_config=model_config,
    optimizer_config=optimizer_config,
    trainer_config=trainer_config,
)
5. 学習
ニューラルネットワークの学習を行います。
tabular_model.fit(train=X_train)6. 学習結果の表示
テストデータの損失と精度を評価します。
result = tabular_model.evaluate(X_test)┏━━━━━━━━━━━━━━━━━━━━━━━━━━━┳━━━━━━━━━━━━━━━━━━━━━━━━━━━┓
┃ Test metric ┃ DataLoader 0 ┃
┡━━━━━━━━━━━━━━━━━━━━━━━━━━━╇━━━━━━━━━━━━━━━━━━━━━━━━━━━┩
│ test_accuracy │ 0.8548420071601868 │
│ test_loss │ 0.31522735953330994 │
└───────────────────────────┴───────────────────────────┘おわりに
今回の結果
今回の設定では、テスト精度は85%程度となりました。
全結合ニューラルネットワークと同等の精度となっています。
次にやること
他の表形式データのために提案されたニューラルネットワークも試してみようと思います。
参考資料
Y. Gorishniy et al., Revisiting Deep Learning Models for Tabular Data, NeurIPS, 2021.
The Illustrated Transformer
https://jalammar.github.io/illustrated-transformer/PyTorch Tabular
https://pytorch-tabular.readthedocs.io/en/latest/