
Get meaning from data (Day 27)

Data is the new power, said by many, and it is quite easy to collect data nowadays. The big question is what can data tell us? Is it meaningful?
Here is the process to spot meaning from data:
1. Start with questions
2. Define proper data tags
3. Observe trends and pattens
4. Ask WHY behind WHYs
Start with questions
Well, it is fun to look at a bunch of data, however, without any purposes, you might end up creating meaningless charts.
To get meaning from data, actually, you need to start with a goal, or some questions you are curious.
For example, I have been writing for 26 days, and I want to look back at what I have done and learned from writing daily.
So, I asked a couple of questions to myself:
1. What is the word count for each article?
2. What topics did I write? How many of each type?
3. How struggle did I feel for writing each day? (Emotion)
4. What changes did I have in each article? (Comment)
5. Did I write longer articles on weekends? (Date & word count )
Define proper data tags
After I have questions, I assigned data tags that can probably represent answers to the questions.
For example, for the question, "How struggle did I feel for writing each day?", I assign an Emotion tag to it.
Emotion tag
From 1 to 10,
1 is very struggling, and 10 is very satisfying.
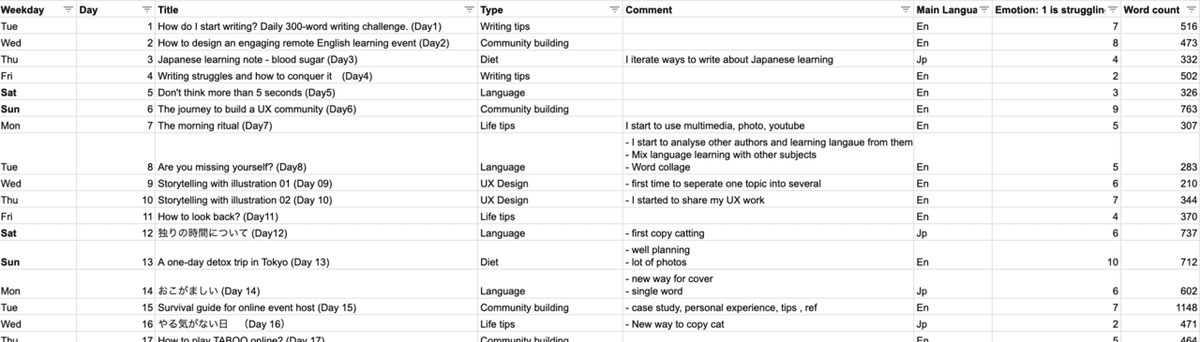
Then I made a sheet to gather all data I need: word count, emotion score, topic type, date, etc.
Great, now I can start making simple chats from these data!
Observe trends and pattens
After creating a couple of simple charts, we can start to notice some interesting changes or trends in these articles.
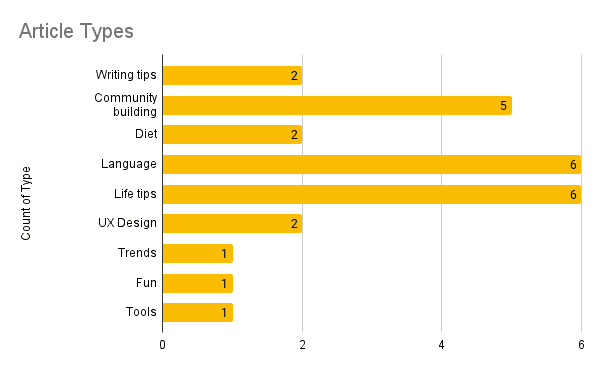
For example, I notice that the top 3 article types are language, life tips and community building.
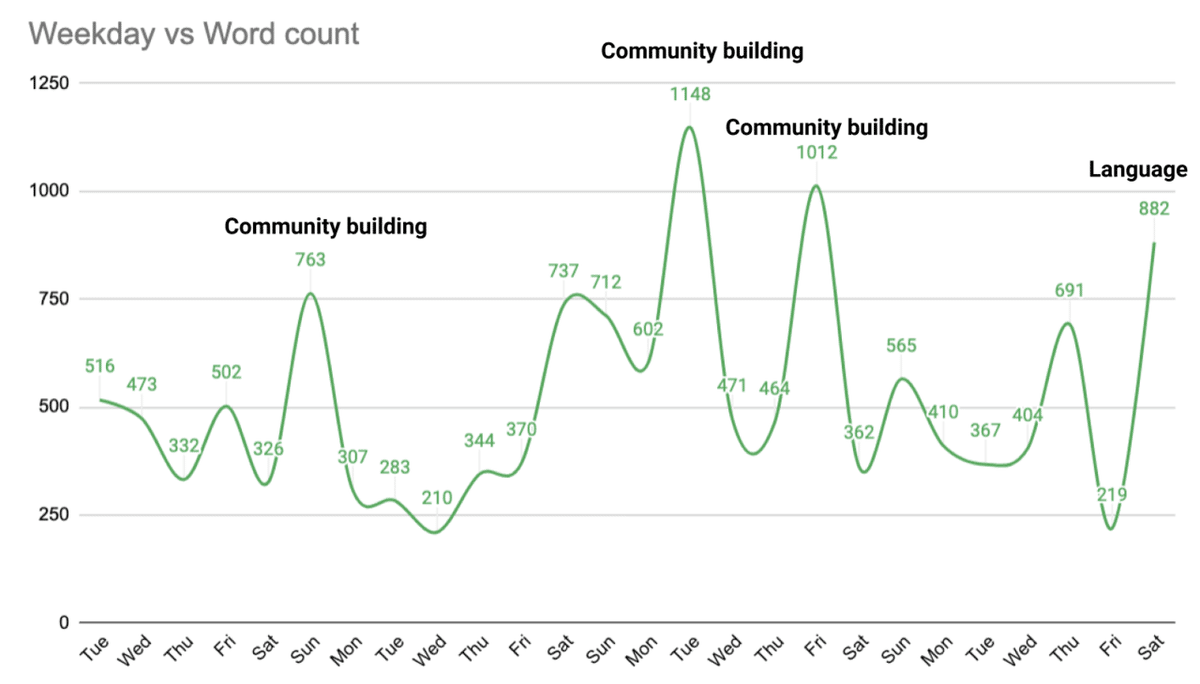
Also, those articles I wrote more than 750 words are most about community building.
It seems that I was struggling in writing (emotion scored less than 3) on Friday and Saturday.
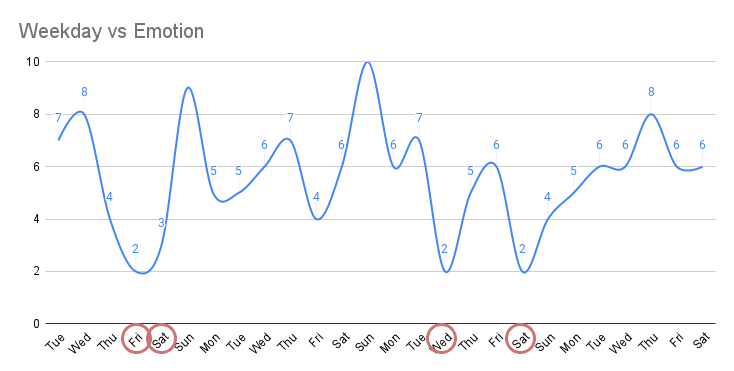
When comparing two charts, it appears to me that emotion score and word count share similar fluctuations.
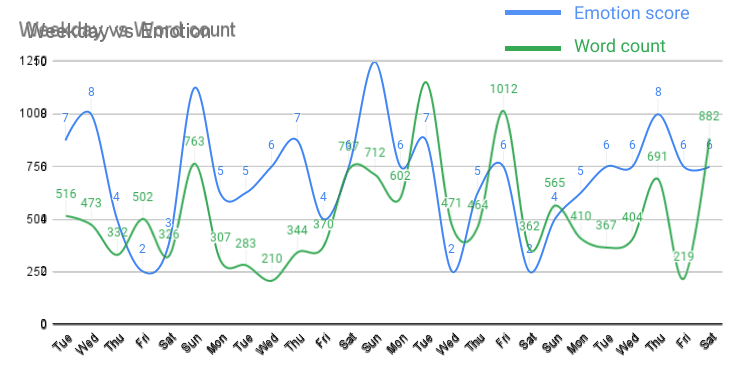
However,
Data can tell us what happened, but data cannot tell us why happened.
To be honest, I got more questions when seeing these charts.
Like why I was usually struggling on Friday and Saturday? Is that because I was burned out after working 5 days? so I was too frustrated to write?
Too many WHYs I want to find out, but it just a waste of time to keep digging data without a focus.
Ask the WHY behind WHYs
Find the root behind those questions / WHYs. Ask yourself "do those questions share similar problems or are related to certain needs?"
If you work for a company, usually you can find the big WHY by looking at company's business goals.
With a clear goal, you can go back to the charts and make lots of assumptions.
Take my writing data for example, I asked why behind those surface level questions, and I realised there is one big need in my writing challenge:
How to be inspired and have good writing ideas EVERY DAY?
With that being said, I focussed on the days when I wrote more than 750 words and make assumptions:
Assumption 1
Topics related to community building is relatively easier to write because it is part of my job.
Assumption 2
It is better to write about language learning on Friday, so I can spend less energy and write longer.
~~
Okay, well, it is so fun to look back my writing through a data aspect.
Hopefully, I move one step closer to the data science world.
---
Cover is designed using a free image from Unsplash.