Ultralyticsの自動アノテーションを試してみた
概要
ultralyticsライブラリのセグメンテーション向け自動アノテーション関数auto_annotateを試してみました。
YOLO形式での出力時に塞がれてしまう🍩の穴を復活させる方法を調査して試してみました。
実施内容
Google ColabのCPU環境で試しました。
準備
ライブラリインストールとリポジトリのクローンします。
!pip install ultralytics
!git clone https://github.com/ryouchinsa/donut
ディレクトリ移動します。(あまり意味はありません)
cd donutインポートと入力画像の設定
import os

import cv2
import matplotlib.pyplot as plt
import numpy as np
from ultralytics import SAM, YOLO
from ultralytics.data.annotator import auto_annotate
from ultralytics.utils.plotting import Annotator, colors

img_dir = "images"  # in "donut" dir
img_path = os.path.join(img_dir, "mak-E-6fFmT1kAw-unsplash.jpg")
img_name = os.path.splitext(os.path.basename(img_path))[0]
img = cv2.imread(img_path)
img_h, img_w = img.shape[:2]
donut_id = 54  # COCOのドーナツクラスのID
🍩検出のお試し
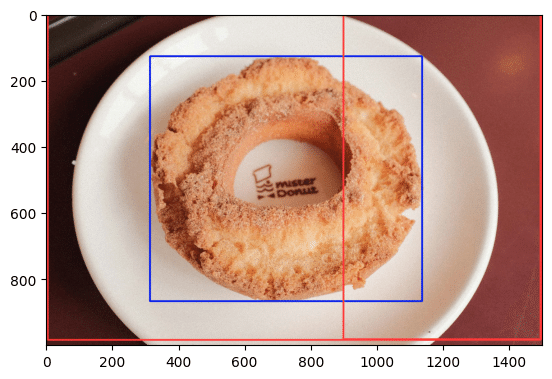
後述のSAMでのセグメンテーション時にBoxの座標を指定するため、インストール後の動確も兼ねて物体検出で🍩のBoxを確認します。
ultralyticsでは、YOLOv5やv8以外のモデルもいくつか利用できるようで、YOLOv9も一部のサイズが利用可能になっていました。
せっかくなので新しいモデルであるYOLOv9-Eを使ってみます。
# YOLOv9で物体検出を行う
yolo_model = YOLO("yolov9e.pt")
results = yolo_model(img_path)
annotator = Annotator(cv2.imread(img_path), line_width=3)

# 検出結果を可視化する
for result in results:
    for box in result.boxes:
        # print(box)  # ultralytics.engine.results.Boxes のインスタンス
        cls_id = int(box.cls.cpu().item())
        xyxy = box.xyxy.cpu().numpy()[0]
        print(f"Class ID: {cls_id}    xyxy: {xyxy}")
        annotator.box_label(xyxy, label="", color=colors(cls_id, True))

annotation_result = annotator.result()
plt.imshow(cv2.cvtColor(annotation_result, cv2.COLOR_BGR2RGB))
出力
```
image 1/1 /content/donut/images/mak-E-6fFmT1kAw-unsplash.jpg: 448x640 1 donut, 2 dining tables, 3137.7ms
Speed: 4.6ms preprocess, 3137.7ms inference, 2.9ms postprocess per image at shape (1, 3, 448, 640)
Class ID: 54 xyxy: [ 314.96 127.02 1138 867.15]
Class ID: 60 xyxy: [ 899.05 1.5239 1498.3 982.65]
Class ID: 60 xyxy: [ 5.0663 0.56484 1495.6 984.09]
<matplotlib.image.AxesImage at 0x7b1bea5ad6c0>
```
自動アノテーション
ultralyticsの自動アノテーションはYOLOとSAM(Segment Anything Model)を組み合わせて実現されているようです。
# 自動アノテーションを実行する
auto_annotate(data=img_dir, det_model="yolov9e.pt", sam_model="sam_l.pt")
SAMの「sam_b」と「sam_l」は指定したptファイルを自動でダウンロードしてくれますが、「sam_h」は用意されていないようです。
ですがソースコード上は「sam_h」にも対応しており、SAM公式のリポジトリからHサイズのpthファイルをダウンロードして「sam_h.pt」にリネームすると「sam_h」も利用できるようです。
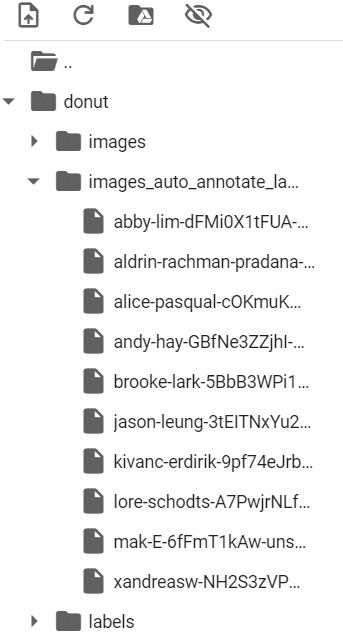
「auto_annotate」を実行すると、末尾に「_auto_annotate_labels」がついたフォルダが作成され、YOLOのセグメンテーション形式のラベルファイル(.txt)が作成されます。
自動アノテーション結果の可視化
# auto_annotate関数のデフォルトでは、"_auto_annotate_labels" を追加した場所にYOLO形式セグメンテーションラベルファイル(txt)が出力される
# ラベルファイル読み込んでクラスIDとポリゴン情報を取得する
with open(os.path.join(img_dir + "_auto_annotate_labels", img_name + ".txt")) as f:
    lines = f.readlines()

cls_ids = []
poly_points_list = []
for line in lines:
    cols = line.replace("\n", "").split(" ")
    cls_ids.append(int(cols[0]))
    poly_cols = cols[1:]
    assert len(poly_cols) % 2 == 0
    poly_points_list.append(
        [(int(float(poly_cols[2*n])*img_w), int(float(poly_cols[2*n+1])*img_h)) for n in range(int(len(poly_cols) / 2))]
    )

# 自動アノテーションされたセグメントマスクを可視化する
auto_masks = []
for idx, cls_id in enumerate(cls_ids):
    if cls_id is not donut_id:
        continue
    auto_masks.append(
        # cv2.fillConvexPoly(img.copy(), np.array(poly_points_list[idx]), colors(cls_id, True))
        cv2.fillPoly(img.copy(), np.array([poly_points_list[idx]]), colors(donut_id, True))
    )

plt.imshow(cv2.cvtColor(auto_masks[0], cv2.COLOR_BGR2RGB))
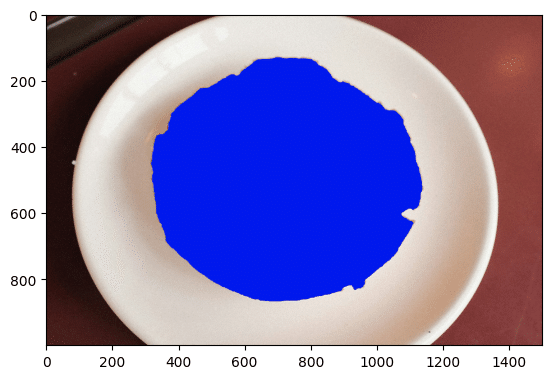
ゴチャッとしたコードになっていますが、ラベルファイルを読み込んで「cv2.fillPoly」で読み込んだ🍩マスクだけ描画しています。
ラベルファイルの中はYOLO形式(下記リンク)になっています。
https://docs.ultralytics.com/ja/datasets/segment/
以下の様に🍩の穴が塞がれてしまいました。
SAM単体(Box指定)でのセグメンテーション
# SAMのBoxプロンプトでセグメンテーションを実施する
sa_model = SAM("sam_l.pt")
results = sa_model(img_path, bboxes=[314, 127, 1138, 867])  # yolo_model で検出した donut の bbox を指定する

# SAMの結果からマスク情報を取得する
sa_binary_masks = []
sa_poly_masks = []
for result in results:
    for msk in result.masks:
        # print(msk)  # ultralytics.engine.results.Masks のインスタンス
        sa_binary_masks.append(
            msk.data.cpu().numpy().astype("uint8")[0] * 255
        )
        sa_poly_masks.append(
            # cv2.fillConvexPoly(img.copy(), msk.xy[0].astype("int64"), colors(donut_id, True))
            cv2.fillPoly(img.copy(), np.array([msk.xy[0].astype("int64")]), colors(donut_id, True))
        )
公式ドキュメント(下記リンク)によると、セグメンテーション結果のマスクは ultralytics.engine.results.Masksインスタンスの「xy」、「xyn」にポリゴン形式で保持されているようですが、Maskインスタンスをprintすると「data」としてbooleanのTensorのマスクも保持されていました。
「xy」はarrayの形を少し調整してあげれば「cv2.fillPoly」や「cv2.fillConvexPoly」で可視化できました。
# ポリゴン形式のマスクを表示する
plt.imshow(cv2.cvtColor(sa_poly_masks[0], cv2.COLOR_BGR2RGB))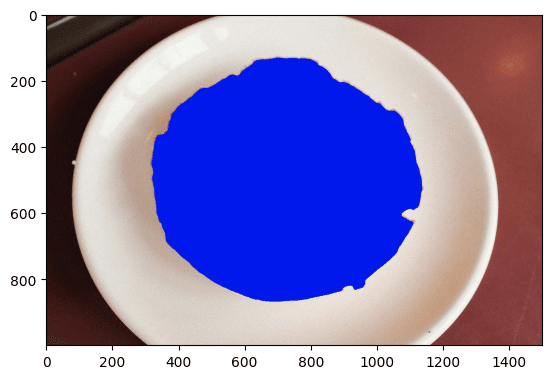
# 2値形式のマスクを表示する
plt.imshow(cv2.cvtColor(sa_binary_masks[0], cv2.COLOR_BGR2RGB))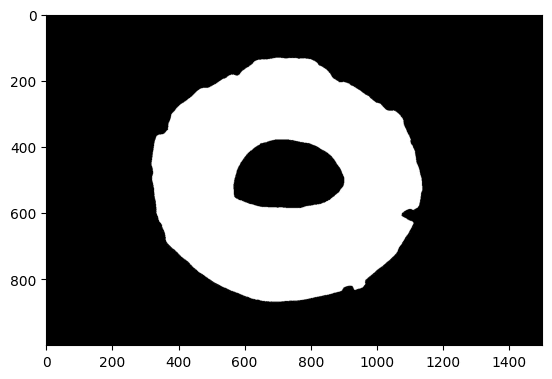
「data」のマスクに🍩の穴がしっかりあるので、SAMの出力をYOLO形式にする過程で穴がなくなってしまったようです。
GitHubのissue(下記リンク)で🍩の穴問題が議論されていました。
(正確には、別画像で穴が塞がる結果になったので、このissueを見て後述のスクリプトと🍩画像を試したという流れですが)
🍩の穴有りポリゴン変換スクリプト
後述の利用したリポジトリの「mask2polygons.py」をコピペして、Colabでの実行に合わせて末尾の「if name == 'main':」以降は消しました。
# 参考URL: https://github.com/ryouchinsa/Rectlabel-support/blob/master/mask2polygons.py
import cv2
import numpy as np

def is_clockwise(contour):
    value = 0
    num = len(contour)
    for i, point in enumerate(contour):
        p1 = contour[i]
        if i < num - 1:
            p2 = contour[i + 1]
        else:
            p2 = contour[0]
        value += (p2[0][0] - p1[0][0]) * (p2[0][1] + p1[0][1]);
    return value < 0

def get_merge_point_idx(contour1, contour2):
    idx1 = 0
    idx2 = 0
    distance_min = -1
    for i, p1 in enumerate(contour1):
        for j, p2 in enumerate(contour2):
            distance = pow(p2[0][0] - p1[0][0], 2) + pow(p2[0][1] - p1[0][1], 2);
            if distance_min < 0:
                distance_min = distance
                idx1 = i
                idx2 = j
            elif distance < distance_min:
                distance_min = distance
                idx1 = i
                idx2 = j
    return idx1, idx2

def merge_contours(contour1, contour2, idx1, idx2):
    contour = []
    for i in list(range(0, idx1 + 1)):
        contour.append(contour1[i])
    for i in list(range(idx2, len(contour2))):
        contour.append(contour2[i])
    for i in list(range(0, idx2 + 1)):
        contour.append(contour2[i])
    for i in list(range(idx1, len(contour1))):
        contour.append(contour1[i])
    contour = np.array(contour)
    return contour

def merge_with_parent(contour_parent, contour):
    if not is_clockwise(contour_parent):
        contour_parent = contour_parent[::-1]
    if is_clockwise(contour):
        contour = contour[::-1]
    idx1, idx2 = get_merge_point_idx(contour_parent, contour)
    return merge_contours(contour_parent, contour, idx1, idx2)

def mask2polygon(image):
    contours, hierarchies = cv2.findContours(image, cv2.RETR_CCOMP, cv2.CHAIN_APPROX_TC89_KCOS)
    contours_approx = []
    polygons = []
    for contour in contours:
        epsilon = 0.001 * cv2.arcLength(contour, True)
        contour_approx = cv2.approxPolyDP(contour, epsilon, True)
        contours_approx.append(contour_approx)

    contours_parent = []
    for i, contour in enumerate(contours_approx):
        parent_idx = hierarchies[0][i][3]
        if parent_idx < 0 and len(contour) >= 3:
            contours_parent.append(contour)
        else:
            contours_parent.append([])

    for i, contour in enumerate(contours_approx):
        parent_idx = hierarchies[0][i][3]
        if parent_idx >= 0 and len(contour) >= 3:
            contour_parent = contours_parent[parent_idx]
            if len(contour_parent) == 0:
                continue
            contours_parent[parent_idx] = merge_with_parent(contour_parent, contour)

    contours_parent_tmp = []
    for contour in contours_parent:
        if len(contour) == 0:
            continue
        contours_parent_tmp.append(contour)

    h, w = image.shape
    line_width = int((h + w) * 0.5 * 0.005)
    cv2.drawContours(image, contours_parent_tmp, -1, 128, line_width)
    cv2.imwrite('polygons.png', image)

    polygons = []
    for contour in contours_parent_tmp:
        polygon = contour.flatten().tolist()
        polygons.append(polygon)
    return polygons
先ほどの2値マスクを上記のスクリプトで穴有りポリゴンに変換します。
gray_mask = sa_binary_masks[0].copy()
polygons = mask2polygon(gray_mask)[0]
# print(polygons)
assert len(polygons) % 2 == 0
converted_poly_points = [(polygons[2*n], polygons[2*n+1]) for n in range(int(len(polygons) / 2))]
# print(converted_poly_points)

converted_poly_mask = cv2.fillPoly(img.copy(), np.array([converted_poly_points]), colors(donut_id, True))
# converted_convex_poly_mask = cv2.fillConvexPoly(img.copy(), np.array(converted_poly_points), colors(donut_id, True))
上記の「polygons」に変換後の内容が入っているので、可視化して確認します。
plt.imshow(cv2.cvtColor(converted_poly_mask, cv2.COLOR_BGR2RGB))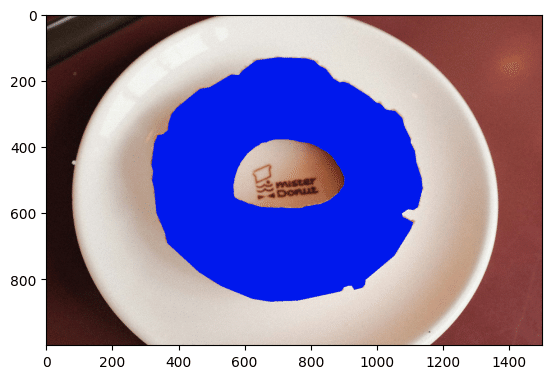
しっかり穴のある🍩(のマスクのポリゴン)が出来たことを確認できました。
あとは、YOLO形式に合わせて「polygons」の内容を画像サイズで正規化してtxt化すればYOLOの学習等にも利用できそうです。
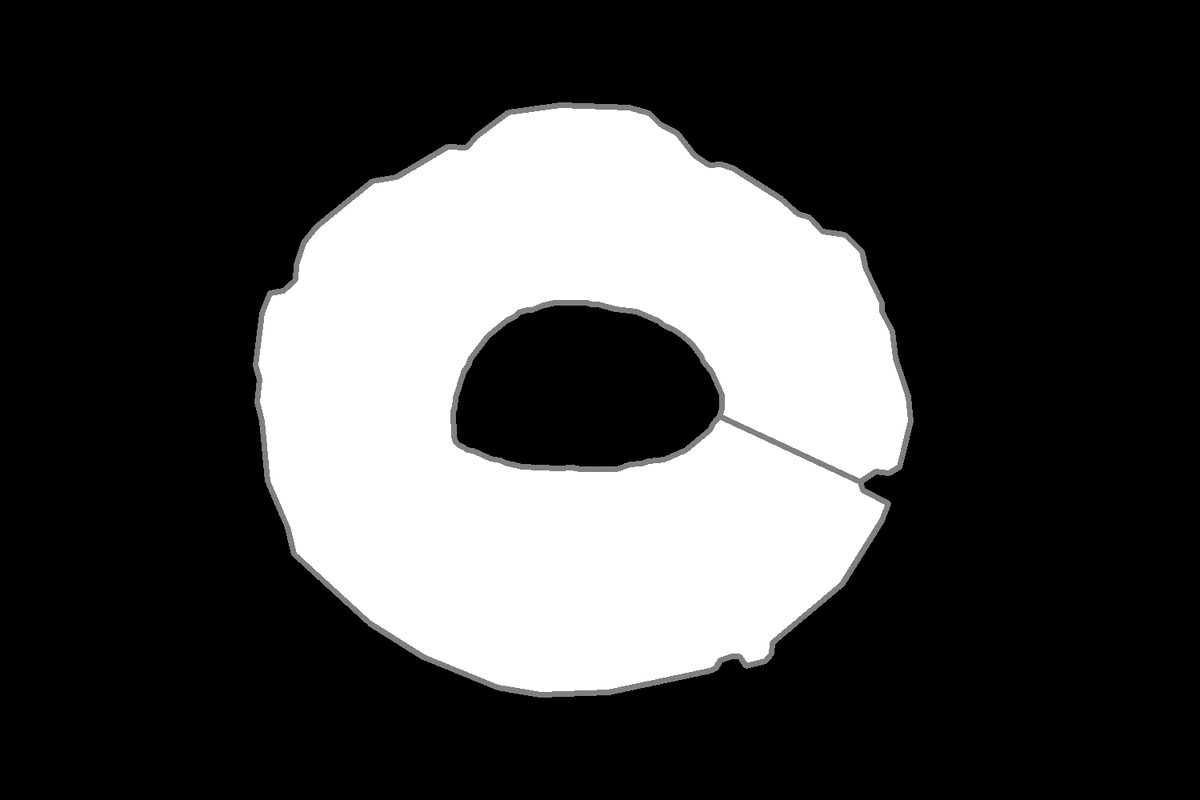
利用したスクリプトの処理内で「polygons.png」が保存されます。
🍩の外と内をつなぐ線が🍩右側に見えますね。
ちなみに上記の可視化を「cv2.fillPoly」ではなく「cv2.fillConvexPoly」でやってしまうと、変換後も以下のような穴の埋まったマスクで可視化されてしまいますのでご注意ください。
plt.imshow(cv2.cvtColor(converted_convex_poly_mask, cv2.COLOR_BGR2RGB))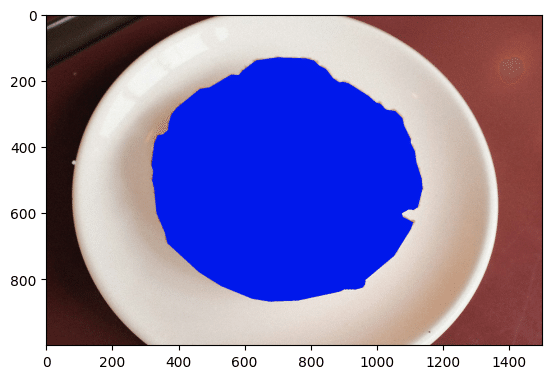
利用したリポジトリ
🍩画像
🍩穴を残したポリゴン化のスクリプト
