
ChatGPTで帳票作成:「現場に掲示するやつ」を作成してみる~Python・Google Colab~

この記事では、ChatGPTのCode Interpreterを利用し、Pythonコードで帳票を作成する過程をご紹介します。
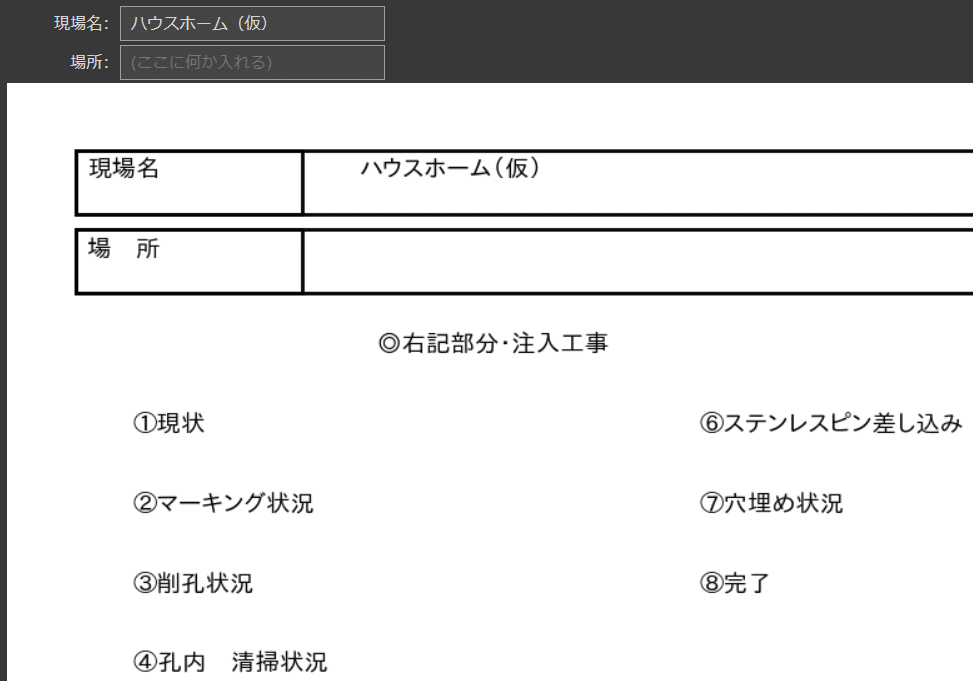
以下に示すものを作成するまでの流れを解説します。
※Code Interpreterを使っていますが、後述する理由によりChatGPT内では動かせないため、普通のGPT-4でもコーディングは可能でしょう。
なお、本記事のベースとなったのは以下の情報です。
2chで少し前に話題になりました、PCに不慣れな方が掲示板の参加者にお願いしたスレッドから始まったものです。
ChatGPTにコードを書いてもらおう
まず、完成形となったコードを以下に示します。
一部を書き換えていますが、大部分はChatGPTが生成したものです(3行分のみ書き換え)。
やりとりの途中では、日本語フォントの問題でChatGPT内で文字化けが発生したため、Google Colabで動作するように修正しました。
下記のコードをコピー&ペーストし、実行すれば作動します。
コード
!apt-get -y install fonts-ipafont-gothic
!rm -rf /root/.cache/matplotlib/*

import matplotlib.pyplot as plt
import matplotlib.font_manager as fm
from matplotlib.patches import Rectangle
import ipywidgets as widgets
from IPython.display import clear_output

# Set the font path to the IPA Gothic font
font_path = "/usr/share/fonts/opentype/ipafont-gothic/ipagp.ttf"

# Create a font object
font_prop = fm.FontProperties(fname=font_path)

# Create input widgets
site_name_input = widgets.Text(value='', placeholder='(ここに何か入れる)', description='現場名:')
location_input = widgets.Text(value='', placeholder='(ここに何か入れる)', description='場所:')
display(site_name_input)
display(location_input)

def draw_poster(site_name, location):
    # A4 size in inches is approximately 11.69 x 8.27 (landscape orientation)
    fig, ax = plt.subplots(figsize=(11.69, 8.27))

    # Draw rectangles, lines and text
    for i, text in enumerate(["現場名", "場 所"]):
        ax.add_patch(Rectangle((0.05, 0.85 - i*0.1), 0.9, 0.08, fill=None, edgecolor='black', lw=2))
        ax.add_patch(Rectangle((0.05, 0.85 - i*0.1), 0.2, 0.08, fill=None, edgecolor='black', lw=2))
        ax.text(0.06, 0.92 - i*0.1, text, transform=ax.transAxes, fontsize=14, va='top', fontproperties=font_prop)

    # Display the inputted values
    ax.text(0.3, 0.92, site_name, transform=ax.transAxes, fontsize=14, va='top', fontproperties=font_prop)
    ax.text(0.3, 0.82, location, transform=ax.transAxes, fontsize=14, va='top', fontproperties=font_prop)

    # Set the main points
    points_left = [
        "          ◎右記部分・注入工事",
        "①現状",
        "②マーキング状況",
        "③削孔状況",
        "④孔内 清掃状況",
        "⑤エポキシ樹脂注入状況",
    ]

    points_right = [
        "⑥ステンレスピン差し込み",
        "⑦穴埋め状況",
        "⑧完了",
    ]

    for i, point in enumerate(points_left):
        ax.text(0.1, 0.7 - i * 0.1, point, transform=ax.transAxes, fontsize=14, va='top', fontproperties=font_prop)

    for i, point in enumerate(points_right):
#    ax.text(0.6, 0.4 - i * 0.1, point, transform=ax.transAxes, fontsize=14, va='top', fontproperties=font_prop)
     ax.text(0.6, 0.6 - i * 0.1, point, transform=ax.transAxes, fontsize=14, va='top', fontproperties=font_prop)

    # Hide the axes
    ax.axis('off')

    # Display the figure
    plt.show()

# Initial drawing
draw_poster(site_name_input.value, location_input.value)

# Define event handlers
def on_site_name_change(change):
    clear_output(wait=True)
    display(site_name_input)
    display(location_input)
    draw_poster(site_name_input.value, location_input.value)

def on_location_change(change):
    clear_output(wait=True)
    display(site_name_input)
    display(location_input)
    draw_poster(site_name_input.value, location_input.value)

# Add event handlers
site_name_input.observe(on_site_name_change, names='value')
location_input.observe(on_location_change, names='value')
実行結果

プロンプト・やりとり
ChatGPTに要求する際のやりとりです。
より効果的な指示出しをすることで、やりとりの回数を減らすことも可能だと思います。
まとめ
今までPythonで帳票を作る経験はありませんでしたが、実際に作れるということに驚きました。
もしかしたら、これはExcelよりも便利かもしれません。
Excelではプリンタとの相性問題で印刷時にズレることがありますが、Pythonで作成すればそのような問題は発生しないでしょう。
よって、ほぼ個人で使う場合でも、使い方次第でPythonによる帳票作成はかなり可能性を秘めていると感じました。
また、特に印象深かった点として、「ここに何か入れる」と書いた過去のやりとりを引っ張ってきて、入力欄に適用するというアプローチがあることに感心しました。
余談
ふと思いついたので急ぎやってみましたが、実際最終的な作成まで15分くらいで済みましたので、本当に日常でも使えそうですね。