
World Bank APIを用いた国際指標比較レポート

目次
はじめに
本レポートの概要と分析対象国
指標別コード(凡例グラフ外配置、全データ表示)
2.1 エネルギー使用量 (EG.USE.PCAP.KG.OE)
2.2 CO₂排出量 (EN.GHG.CO2.PC.CE.AR5)
2.3 交通事故による死亡率 (SH.STA.TRAF.P5)
2.4 人口の変化 (SP.POP.TOTL)
2.5 GDP (NY.GDP.MKTP.CD)
2.6 銀行の自己資本比率 (FB.BNK.CAPA.ZS)
2.7 電気へのアクセス(人口比)(EG.ELC.ACCS.ZS)
2.8 0〜14歳の人口割合 (SP.POP.0014.TO.ZS)
2.9 特許出願(居住者)(IP.PAT.RESD)
2.10 森林面積(国土に占める割合)(AG.LND.FRST.ZS)最後に
データの欠損
指標間の関連性
背景情報の追加
他の国との比較
1. はじめに
本レポートでは、World Bankが提供する各種経済・社会・環境指標データを用いて、日本、アメリカ、イギリス、中国、インド、ロシアの6か国における各指標の時系列変化を分析します。
また、各コード例は全年度のデータ(利用可能な全ての数値)をそのまま表示し、グラフの凡例は右上外側に配置するようにしています。
2. 指標別コード(凡例グラフ外配置、全データ表示)
※各コード例では、APIから取得したデータの「date」と「value」を表示する形式になっています。
直近の年はまだデータがないことが多い。
2.1. エネルギー使用量
指標コード: EG.USE.PCAP.KG.OE
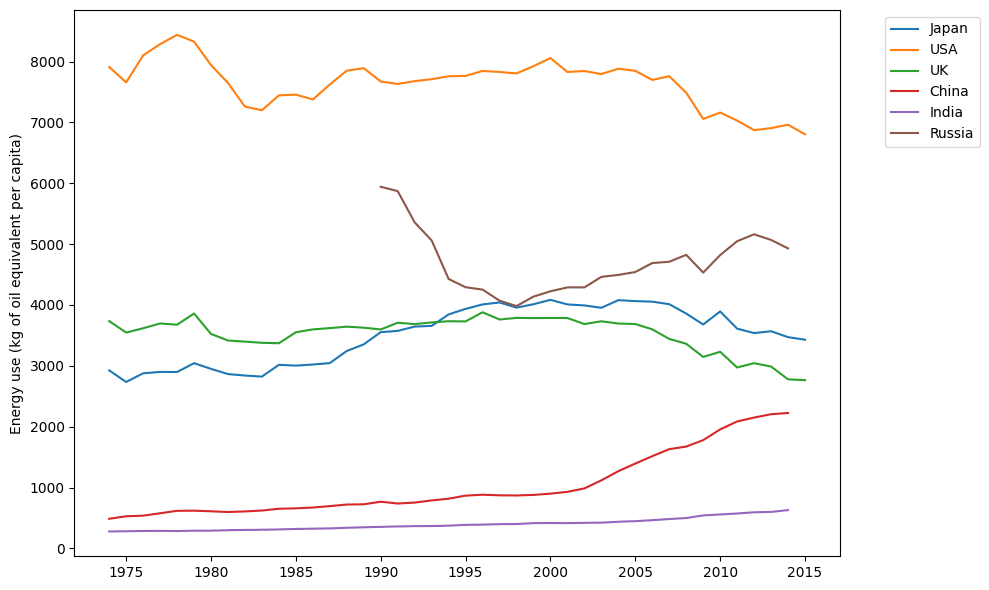
【エネルギー使用量】
1974年~2015年のデータでは、長期的な上昇傾向や変動が確認できます。
最新年度(2016年以降)のデータがNaNとなっている点から、最新の統計更新を待つか、利用可能な期間内で分析する必要があります。
import requests
import pandas as pd

urls = {
    'Japan': "https://api.worldbank.org/v2/country/JP/indicator/EG.USE.PCAP.KG.OE?format=json",
    'USA':   "https://api.worldbank.org/v2/country/US/indicator/EG.USE.PCAP.KG.OE?format=json",
    'UK':    "https://api.worldbank.org/v2/country/GB/indicator/EG.USE.PCAP.KG.OE?format=json",
    'China': "https://api.worldbank.org/v2/country/CN/indicator/EG.USE.PCAP.KG.OE?format=json",
    'India': "https://api.worldbank.org/v2/country/IN/indicator/EG.USE.PCAP.KG.OE?format=json",
    'Russia':"https://api.worldbank.org/v2/country/RU/indicator/EG.USE.PCAP.KG.OE?format=json"
}

dataframes = {}
for country, url in urls.items():
    response = requests.get(url)
    data = response.json()
    if len(data) < 2:
        print(f"{country}: データが見つかりませんでした。")
        continue
    df = pd.json_normalize(data[1])
    df['date'] = pd.to_datetime(df['date'])
    dataframes[country] = df[['date', 'value']]

for country, df in dataframes.items():
    print(f"--- {country} (エネルギー使用量) ---")
    print(df.to_string(index=False))
    print("\n")
2.2. CO₂排出量
指標コード: EN.GHG.CO2.㍶

【CO₂排出量(EN.GHG.CO2.PC.CE.AR5)】
各国の1人あたりのCO₂排出量は、国ごとの産業構造、エネルギー政策、技術革新などの影響を受けています。
例えば、日本は比較的低い値から徐々に上昇し、最近はやや下落傾向が見られるのに対し、USAは高い水準を維持しています。
この違いは、経済規模だけでなく、エネルギー効率や環境規制の違いとも関連していると考えられます。
import requests
import pandas as pd

urls = {
    'Japan': "https://api.worldbank.org/v2/country/JP/indicator/EN.GHG.CO2.㍶?format=json",
    'USA':   "https://api.worldbank.org/v2/country/US/indicator/EN.GHG.CO2.㍶?format=json",
    'UK':    "https://api.worldbank.org/v2/country/GB/indicator/EN.GHG.CO2.㍶?format=json",
    'China': "https://api.worldbank.org/v2/country/CN/indicator/EN.GHG.CO2.㍶?format=json",
    'India': "https://api.worldbank.org/v2/country/IN/indicator/EN.GHG.CO2.㍶?format=json",
    'Russia':"https://api.worldbank.org/v2/country/RU/indicator/EN.GHG.CO2.㍶?format=json"
}

dataframes = {}
for country, url in urls.items():
    response = requests.get(url)
    data = response.json()
    if len(data) < 2:
        print(f"{country}: データが見つかりませんでした。")
        continue
    df = pd.json_normalize(data[1])
    df['date'] = pd.to_datetime(df['date'])
    dataframes[country] = df[['date', 'value']]

for country, df in dataframes.items():
    print(f"--- {country} (CO₂排出量) ---")
    print(df.to_string(index=False))
    print("\n")
2.3. 交通事故による死亡率
指標コード: SH.STA.TRAF.P5

減少傾向: 多くの国で、交通事故による死亡率は減少傾向にありますが、そのペースは国によって異なります。
import requests
import pandas as pd

urls = {
    'Japan': "https://api.worldbank.org/v2/country/JP/indicator/SH.STA.TRAF.P5?format=json",
    'USA':   "https://api.worldbank.org/v2/country/US/indicator/SH.STA.TRAF.P5?format=json",
    'UK':    "https://api.worldbank.org/v2/country/GB/indicator/SH.STA.TRAF.P5?format=json",
    'China': "https://api.worldbank.org/v2/country/CN/indicator/SH.STA.TRAF.P5?format=json",
    'India': "https://api.worldbank.org/v2/country/IN/indicator/SH.STA.TRAF.P5?format=json",
    'Russia':"https://api.worldbank.org/v2/country/RU/indicator/SH.STA.TRAF.P5?format=json"
}

dataframes = {}
for country, url in urls.items():
    response = requests.get(url)
    data = response.json()
    if len(data) < 2:
        print(f"{country}: データが見つかりませんでした。")
        continue
    df = pd.json_normalize(data[1])
    df['date'] = pd.to_datetime(df['date'])
    dataframes[country] = df[['date', 'value']]

for country, df in dataframes.items():
    print(f"--- {country} (交通事故による死亡率) ---")
    print(df.to_string(index=False))
    print("\n")
2.4. 人口の変化
指標コード: SP.POP.TOTL

中国とインドの人口増加: 中国とインドは、世界で最も人口が多い国であり、その人口は増加し続けています。ただし、中国は近年、人口増加率が鈍化しています。
import requests
import pandas as pd

urls = {
    'Japan': "https://api.worldbank.org/v2/country/JP/indicator/SP.POP.TOTL?format=json",
    'USA':   "https://api.worldbank.org/v2/country/US/indicator/SP.POP.TOTL?format=json",
    'UK':    "https://api.worldbank.org/v2/country/GB/indicator/SP.POP.TOTL?format=json",
    'China': "https://api.worldbank.org/v2/country/CN/indicator/SP.POP.TOTL?format=json",
    'India': "https://api.worldbank.org/v2/country/IN/indicator/SP.POP.TOTL?format=json",
    'Russia':"https://api.worldbank.org/v2/country/RU/indicator/SP.POP.TOTL?format=json"
}

dataframes = {}
for country, url in urls.items():
    response = requests.get(url)
    data = response.json()
    if len(data) < 2:
        print(f"{country}: データが見つかりませんでした。")
        continue
    df = pd.json_normalize(data[1])
    df['date'] = pd.to_datetime(df['date'])
    dataframes[country] = df[['date', 'value']]

for country, df in dataframes.items():
    print(f"--- {country} (人口) ---")
    print(df.to_string(index=False))
    print("\n")
2.5. GDP
指標コード: NY.GDP.MKTP.CD

アメリカと中国の経済規模: アメリカと中国は、世界で最もGDPが大きい国であり、世界経済を牽引しています。
日本の経済成長の停滞: 日本のGDPは、1990年代以降、長期的に停滞しています。
import requests
import pandas as pd

urls = {
    'Japan': "https://api.worldbank.org/v2/country/JP/indicator/NY.GDP.MKTP.CD?format=json",
    'USA':   "https://api.worldbank.org/v2/country/US/indicator/NY.GDP.MKTP.CD?format=json",
    'UK':    "https://api.worldbank.org/v2/country/GB/indicator/NY.GDP.MKTP.CD?format=json",
    'China': "https://api.worldbank.org/v2/country/CN/indicator/NY.GDP.MKTP.CD?format=json",
    'India': "https://api.worldbank.org/v2/country/IN/indicator/NY.GDP.MKTP.CD?format=json",
    'Russia':"https://api.worldbank.org/v2/country/RU/indicator/NY.GDP.MKTP.CD?format=json"
}

dataframes = {}
for country, url in urls.items():
    response = requests.get(url)
    data = response.json()
    if len(data) < 2:
        print(f"{country}: データが見つかりませんでした。")
        continue
    df = pd.json_normalize(data[1])
    df['date'] = pd.to_datetime(df['date'])
    dataframes[country] = df[['date', 'value']]

for country, df in dataframes.items():
    print(f"--- {country} (GDP) ---")
    print(df.to_string(index=False))
    print("\n")
2.6. 銀行の自己資本比率
指標コード: FB.BNK.CAPA.ZS

データの欠損: 多くの国で、近年(特に2013年以降)のデータが欠損しており、十分な分析ができません。
ばらつき: データが存在する範囲では、国によって自己資本比率にばらつきが見られます。
日本のデータ: 日本のデータは少なく、近年の傾向はつかめない。
import requests
import pandas as pd

urls = {
    'Japan': "https://api.worldbank.org/v2/country/JP/indicator/FB.BNK.CAPA.ZS?format=json",
    'USA':   "https://api.worldbank.org/v2/country/US/indicator/FB.BNK.CAPA.ZS?format=json",
    'UK':    "https://api.worldbank.org/v2/country/GB/indicator/FB.BNK.CAPA.ZS?format=json",
    'China': "https://api.worldbank.org/v2/country/CN/indicator/FB.BNK.CAPA.ZS?format=json",
    'India': "https://api.worldbank.org/v2/country/IN/indicator/FB.BNK.CAPA.ZS?format=json",
    'Russia':"https://api.worldbank.org/v2/country/RU/indicator/FB.BNK.CAPA.ZS?format=json"
}

dataframes = {}
for country, url in urls.items():
    response = requests.get(url)
    data = response.json()
    if len(data) < 2:
        print(f"{country}: データが見つかりませんでした。")
        continue
    df = pd.json_normalize(data[1])
    df['date'] = pd.to_datetime(df['date'])
    dataframes[country] = df[['date', 'value']]

for country, df in dataframes.items():
    print(f"--- {country} (銀行の自己資本比率) ---")
    print(df.to_string(index=False))
    print("\n")
2.7. 電気へのアクセス(人口比)
指標コード: EG.ELC.ACCS.ZS

先進国はほぼ100%: 日本、アメリカ、イギリスなどの先進国では、ほぼ全ての人が電気を利用できます。
発展途上国での改善: 電気へのアクセス率が向上していますが、まだ100%には達していません(特にインド)。
import pandas as pd

urls = {
    'Japan': "https://api.worldbank.org/v2/country/JP/indicator/EG.ELC.ACCS.ZS?format=json",
    'USA':   "https://api.worldbank.org/v2/country/US/indicator/EG.ELC.ACCS.ZS?format=json",
    'UK':    "https://api.worldbank.org/v2/country/GB/indicator/EG.ELC.ACCS.ZS?format=json",
    'China': "https://api.worldbank.org/v2/country/CN/indicator/EG.ELC.ACCS.ZS?format=json",
    'India': "https://api.worldbank.org/v2/country/IN/indicator/EG.ELC.ACCS.ZS?format=json",
    'Russia':"https://api.worldbank.org/v2/country/RU/indicator/EG.ELC.ACCS.ZS?format=json"
}

dataframes = {}
for country, url in urls.items():
    response = requests.get(url)
    data = response.json()
    if len(data) < 2:
        print(f"{country}: データが見つかりませんでした。")
        continue
    df = pd.json_normalize(data[1])
    df['date'] = pd.to_datetime(df['date'])
    dataframes[country] = df[['date', 'value']]

for country, df in dataframes.items():
    print(f"--- {country} (電気へのアクセス) ---")
    print(df.to_string(index=False))
    print("\n")
2.8. 0〜14歳の人口(総人口の%)
指標コード: SP.POP.0014.TO.ZS

少子高齢化: 日本は、0〜14歳の人口割合が最も低く、少子高齢化が深刻な状況です。
インドの若年層: インドは、0〜14歳の人口割合が比較的高く、若い人口構成となっています。
中国の変化: 中国は一人っ子政策を近年まで行っていたこともあり、0-14歳の人口割合が減少傾向にある。
import requests
import pandas as pd

urls = {
    'Japan': "https://api.worldbank.org/v2/country/JP/indicator/SP.POP.0014.TO.ZS?format=json",
    'USA':   "https://api.worldbank.org/v2/country/US/indicator/SP.POP.0014.TO.ZS?format=json",
    'UK':    "https://api.worldbank.org/v2/country/GB/indicator/SP.POP.0014.TO.ZS?format=json",
    'China': "https://api.worldbank.org/v2/country/CN/indicator/SP.POP.0014.TO.ZS?format=json",
    'India': "https://api.worldbank.org/v2/country/IN/indicator/SP.POP.0014.TO.ZS?format=json",
    'Russia':"https://api.worldbank.org/v2/country/RU/indicator/SP.POP.0014.TO.ZS?format=json"
}

dataframes = {}
for country, url in urls.items():
    response = requests.get(url)
    data = response.json()
    if len(data) < 2:
        print(f"{country}: データが見つかりませんでした。")
        continue
    df = pd.json_normalize(data[1])
    df['date'] = pd.to_datetime(df['date'])
    dataframes[country] = df[['date', 'value']]

for country, df in dataframes.items():
    print(f"--- {country} (0〜14歳の人口割合) ---")
    print(df.to_string(index=False))
    print("\n")
2.9. 特許出願(居住者)
指標コード: IP.PAT.RESD

中国の急増: 中国は、近年、居住者による特許出願数が急増しており、技術革新の進展が著しいです。
日本とアメリカ: 日本とアメリカは、長年にわたり多くの特許を出願してきましたが、近年は減少傾向または横ばいです。
import requests
import pandas as pd

urls = {
    'Japan': "https://api.worldbank.org/v2/country/JP/indicator/IP.PAT.RESD?format=json",
    'USA':   "https://api.worldbank.org/v2/country/US/indicator/IP.PAT.RESD?format=json",
    'UK':    "https://api.worldbank.org/v2/country/GB/indicator/IP.PAT.RESD?format=json",
    'China': "https://api.worldbank.org/v2/country/CN/indicator/IP.PAT.RESD?format=json",
    'India': "https://api.worldbank.org/v2/country/IN/indicator/IP.PAT.RESD?format=json",
    'Russia':"https://api.worldbank.org/v2/country/RU/indicator/IP.PAT.RESD?format=json"
}

dataframes = {}
for country, url in urls.items():
    response = requests.get(url)
    data = response.json()
    if len(data) < 2:
        print(f"{country}: データが見つかりませんでした。")
        continue
    df = pd.json_normalize(data[1])
    df['date'] = pd.to_datetime(df['date'])
    dataframes[country] = df[['date', 'value']]

for country, df in dataframes.items():
    print(f"--- {country} (特許出願(居住者)) ---")
    print(df.to_string(index=False))
    print("\n")
2.10. 森林面積(国土に占める割合)
指標コード: AG.LND.FRST.ZS

日本の森林率の高さ: 日本は、国土の約7割が森林であり、先進国の中でも森林率が非常に高い国です。
ロシアの広大な森林: ロシアは、広大な国土に広大な森林を有しています。
中国、インドの植林: 中国とインドは森林面積が増加傾向にあり、植林などの取り組みが進められていると考えられます。
import requests
import pandas as pd

urls = {
    'Japan': "https://api.worldbank.org/v2/country/JP/indicator/AG.LND.FRST.ZS?format=json",
    'USA':   "https://api.worldbank.org/v2/country/US/indicator/AG.LND.FRST.ZS?format=json",
    'UK':    "https://api.worldbank.org/v2/country/GB/indicator/AG.LND.FRST.ZS?format=json",
    'China': "https://api.worldbank.org/v2/country/CN/indicator/AG.LND.FRST.ZS?format=json",
    'India': "https://api.worldbank.org/v2/country/IN/indicator/AG.LND.FRST.ZS?format=json",
    'Russia':"https://api.worldbank.org/v2/country/RU/indicator/AG.LND.FRST.ZS?format=json"
}

dataframes = {}
for country, url in urls.items():
    response = requests.get(url)
    data = response.json()
    if len(data) < 2:
        print(f"{country}: データが見つかりませんでした。")
        continue
    df = pd.json_normalize(data[1])
    df['date'] = pd.to_datetime(df['date'])
    dataframes[country] = df[['date', 'value']]

for country, df in dataframes.items():
    print(f"--- {country} (森林面積) ---")
    print(df.to_string(index=False))
    print("\n")
3. 最後に
上記の考察は、提供されたデータに基づく基本的なものです。より詳細な分析を行うためには、以下の点について検討する必要があります。
データの欠損: 特に銀行の自己資本比率など、一部の指標でデータの欠損が見られます。欠損の理由を調査し、可能であれば他のデータソースから補完する必要があります。
指標間の関連性: 各指標間の関連性を分析することで、より深い洞察を得ることができます。例えば、エネルギー使用量とGDP、CO₂排出量と経済成長、人口構成と社会保障制度など、さまざまな組み合わせが考えられます。
背景情報の追加: 各国の政策、社会情勢、歴史的背景などの情報を加えることで、データの解釈を深めることができます。
他の国との比較: 今回分析対象とした6カ国以外の国との比較を行うことで、より相対的な評価が可能になります。
これらの追加分析を行うことで、より包括的で詳細な考察が可能になります。