物をたくさん買ってもらうにはどうしたらいいの?
はじめに
データサイエンスって何?
「なんかかっこいい」とか「なんかすごい」とかいう興味本位で始めたAidemyのデータ分析コースを始めました。
業務でエクセル等は使いますが、マクロはほとんど使わず、プログラミングは一切しないIT初心者です。
Aidemyの課題
Aidemyの課題で成果物の作成があります。
データ分析コースなので、何かデータを使って、解析し、それを成果物として提出します。
身近なデータを解析したいなと思ったので、物の購入者のデータを使用し、
1. 購入額が多い購入者はどのような特徴があるのか。
2. どのようにマーケティングすればそのような購入者により買ってもらえるのか。
を調べることにしました。
kaggleというプログラミングのコンペサイトには様々なビックデータをダウンロードできます。
その中に物の購入に関するデータがありました。
そのデータを使用し、解析しました!
データの中身
このデータの中は「年収」「生年月日」等の基礎的な情報から、「使った金額」、「クーポンを使用した回数」等の購入者の履歴まであります。
詳細は以下参照
購入者の基礎的な情報:
ID: 顧客のID
Year_Birth: 顧客の誕生年
Education: 顧客の教育レベル
Marital_Status: 顧客の婚姻状態
Income: 顧客の年間世帯収入
Kidhome: 顧客の世帯内の子供の数
Teenhome: 顧客の世帯内の10代の数
Dt_Customer: 顧客の会社への登録日
Recency: 顧客の最後の購入からの経過日数
Complain: 2年以内にクレームがあった場合は1、それ以外は0
購入者履歴 データ:
MntWines, MntFruits, MntMeatProducts, MntFishProducts, MntSweetProducts, MntGoldProds: 各製品カテゴリにおける顧客の過去2年間の支出
NumDealsPurchases: ディスカウントを使用して行われた購入の回数
AcceptedCmp1〜AcceptedCmp5: 各キャンペーンでのオファーの受け入れ(1: 受け入れ、0: それ以外)
Response: 最後のキャンペーンでのオファーの受け入れ(1: 受け入れ、0: それ以外)
NumWebPurchases, NumCatalogPurchases, NumStorePurchases: 顧客が行ったウェブサイト、カタログ、店舗での購入の回数
NumWebVisitsMonth: 顧客が直近1ヶ月で会社のウェブサイトを訪れた回数
実行環境
Google Colaboratory
Python
最初のデータの状態
初期のデータ
ID	Year_Birth	Education	Marital_Status	Income	Kidhome	Teenhome	Dt_Customer	Recency	MntWines	...	NumWebVisitsMonth	AcceptedCmp3	AcceptedCmp4	AcceptedCmp5	AcceptedCmp1	AcceptedCmp2	Complain	Z_CostContact	Z_Revenue	Response
0	5524	1957	Graduation	Single	58138.0	0	0	04-09-2012	58	635	...	7	0	0	0	0	0	0	3	11	1
1	2174	1954	Graduation	Single	46344.0	1	1	08-03-2014	38	11	...	5	0	0	0	0	0	0	3	11	0
2	4141	1965	Graduation	Together	71613.0	0	0	21-08-2013	26	426	...	4	0	0	0	0	0	0	3	11	0
3	6182	1984	Graduation	Together	26646.0	1	0	10-02-2014	26	11	...	6	0	0	0	0	0	0	3	11	0
4	5324	1981	PhD	Married	58293.0	1	0	19-01-2014	94	173	...	5	0	0	0	0	0	0	3	11	0
1.データの読み込み
ダウンロードしたデータが.csvの為、pandasを用いて読み込みます。
import pandas as pd

# CSV ファイルを読み込み
main_df = pd.read_csv("/content/drive/My Drive/Aidemy/marketing_campaign.csv", sep="\t")
2.データの整理
①欠損データの処理
欠損データがある場合、エラーが発生したりします。
そのため、そのデータの平均値や中央値等で代替することが可能です。
今回はデータ数が多いため、欠損のあるデータは削除しました。
データ数:2240
削除後のデータ数:2216
df.dropna(axis = 0, inplace = True)②データをまとめる
特徴量(IDや誕生年、肉の購入量等)が多いため、どのように処理をしたらよいか分からない場合があります。その時はまとめた方が分かりやすくなるものもあります。
例えば、
・個別の購入額(ワイン、肉等)⇒ 「全体の購入額」(個々の購入額の合計)
・「家にいる10代の数」、「子供の数」⇒「子供の合計人数」
df["Spent"] = df["MntWines"] + df["MntFruits"] + df["MntMeatProducts"] + df["MntFishProducts"] + df["MntSweetProducts"] + df["MntGoldProds"]
df["Children"] = df["Kidhome"] + df["Teenhome"]
df['TotalAcceptedCmp'] = df['AcceptedCmp1'] + df['AcceptedCmp2'] + df['AcceptedCmp3'] + df['AcceptedCmp4'] + df['AcceptedCmp5']
③データ処理
処理した方が分りやすいデータもあります。
例えば、
・「誕生年」⇒ 「年齢」(データ取得年-誕生年)
df["Age"] =2020 - df["Year_Birth"]④名前を分かりやすくする
しっくりこない特徴量がある場合、特徴量の名前を変更することもできます。データ解析中の混乱を防ぐことができます。
例えば、
「MntWines」 ⇒ 「Wines」等
df.rename(columns={"Marital_Status": "Marital Status","MntWines": "Wines","MntFruits":"Fruits","MntMeatProducts":"Meat","MntFishProducts":"Fish","MntSweetProducts":"Sweets","MntGoldProds":"Gold","NumWebPurchases": "Web","NumCatalogPurchases":"Catalog","NumStorePurchases":"Store","NumDealsPurchases":"Discount Purchases"}, inplace = True)⑤データを絞る
外れ値等ですごいレアなデータがある場合、対象データを絞ることが可能です。
年齢及び年収について、グラフで確認してみました。
その結果、120歳くらいの方や60万ドル円/年収の方がいたため、gグラフで可視化し、一定数のデータがいるところでデータを除外しました。
plt.subplots(figsize=(10, 4))
p = sns.histplot(df["Age"],kde=True,bins=50,alpha=1,fill=True,edgecolor="black")
p.axes.lines[0].set_color("black")
p.axes.set_title("\nCustomer's Age Distribution\n",fontsize=25)
plt.ylabel("Count",fontsize=20)
plt.xlabel("\nAge",fontsize=20)
sns.despine(left=True, bottom=True)

plt.show()
plt.subplots(figsize=(10, 4))
p = sns.histplot(df["Income"],kde=True,bins=50,alpha=1,fill=True,edgecolor="black")
p.axes.lines[0].set_color("black")
p.axes.set_title("\nCustomer's Income Distribution\n",fontsize=25)
plt.ylabel("Count",fontsize=20)
plt.xlabel("\nIncome",fontsize=20)
sns.despine(left=True, bottom=True)

plt.show()
よって、年齢のデータを80歳未満、年収のデータを10万ドル未満に限定した。
df = df[df["Age"] < 80]
df = df[df["Income"] < 100000]
3.データの相関
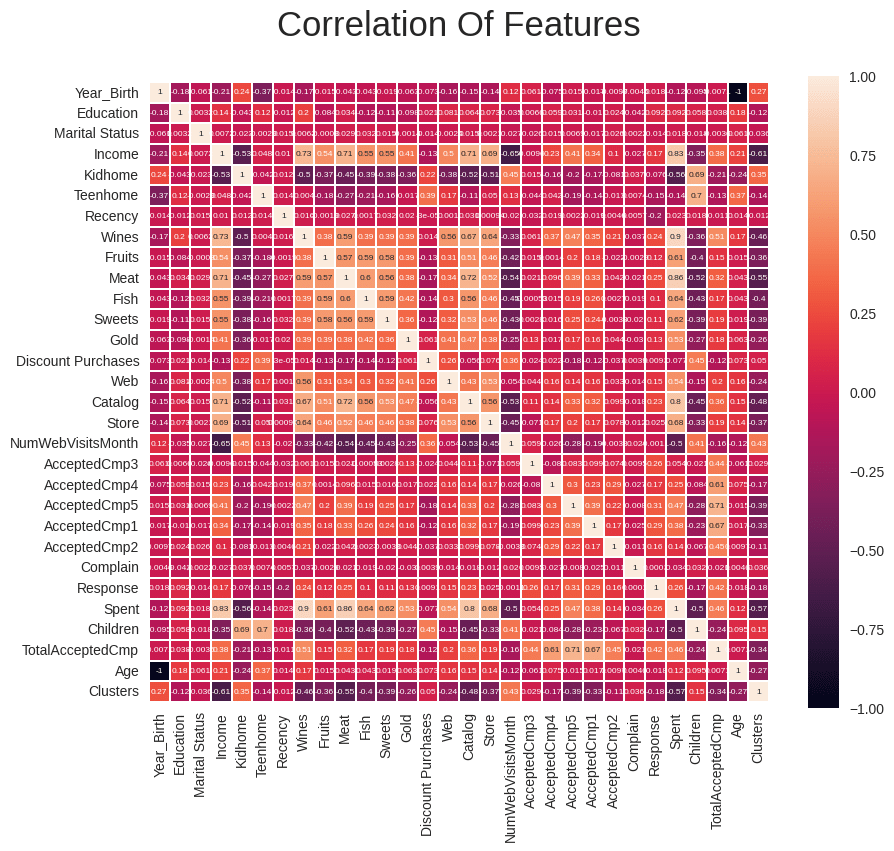
本データ解析の目的の一つは「1. 購入額が多い購入者はどのような特徴があるのか。」でした。購入額「Spent」との相関関係を確認しました。
色が白い方が購入額との相関関係が高いことを示します。
plt.subplots(figsize =(10, 10))

sns.heatmap(df.drop(columns="ID").corr(),  square=True, cbar_kws=dict(shrink =.82),
            annot=True, vmin=-1, vmax=1, linewidths=0.1,linecolor='white',annot_kws=dict(fontsize =6))
plt.title("Pearson Correlation Of Features\n", fontsize=25)
plt.xticks(rotation=90)
plt.show()
データからは「年収」「カタログでの購入回数」との相関性が高いことが確認できます。一方、年齢に関してはあまり相関性が高くないことが確認できます。
4.主成分分析
データが多い場合、処理が難しいです。
主成分分析をし、次元削減やデータの特徴を捉えます。
主成分分析とはデータの中で重要な変数や特徴を見つけ、それに基づいてデータを新しい座標系に変換することです。
ステップを以下にまとめました。
①データの型を揃える
②で標準化をするのですが、そのための処理です。
標準化は「数値」のため、文字列となっている特徴量を数値に変換します。
catcol = ["Education","Marital Status",]
le = LabelEncoder()
for col in catcol:
        df[col] = le.fit_transform(df[col])
②標準化
各変数を標準正規分布に変換し、平均が0、標準偏差が1になるように調整します。これにより、数値がバラバラなデータを同じように扱うことができます。
from sklearn.preprocessing import StandardScaler
df1 = df.copy()
scaler = StandardScaler()
df1 = scaler.fit_transform(df1)
scaled_df = pd.DataFrame(df1, columns= df.columns)
print("After scaling, let's have a glimpse of the scaled dfset :")
scaled_df.head()
標準化すると下のようになります。
ID	Year_Birth	Education	Marital Status	Income	Kidhome	Teenhome	Recency	Wines	Fruits	...	AcceptedCmp4	AcceptedCmp5	AcceptedCmp1	AcceptedCmp2	Complain	Response	Spent	Children	TotalAcceptedCmp	Age
0	-0.018564	-1.019623	-0.348727	0.255462	0.322568	-0.825291	-0.933139	0.310548	0.976521	1.558076	...	-0.281068	-0.277282	-0.258762	-0.115603	-0.095805	2.384091	1.681182	-1.271101	-0.439394	1.019623
1	-1.049690	-1.276338	-0.348727	0.255462	-0.250593	1.036058	0.903900	-0.381131	-0.874036	-0.638859	...	-0.281068	-0.277282	-0.258762	-0.115603	-0.095805	-0.419447	-0.962579	1.401128	-0.439394	1.276338
2	-0.444249	-0.335049	-0.348727	1.183991	0.977421	-0.825291	-0.933139	-0.796138	0.356703	0.573243	...	-0.281068	-0.277282	-0.258762	-0.115603	-0.095805	-0.419447	0.282815	-1.271101	-0.439394	0.335049
3	0.183968	1.290814	-0.348727	1.183991	-1.207869	1.036058	-0.933139	-0.796138	-0.874036	-0.563103	...	-0.281068	-0.277282	-0.258762	-0.115603	-0.095805	-0.419447	-0.919348	0.065013	-0.439394	-1.290814
4	-0.080123	1.034099	1.434648	-0.673068	0.330101	1.036058	-0.933139	1.555569	-0.393603	0.421730	...	-0.281068	-0.277282	-0.258762	-0.115603	-0.095805	-0.419447	-0.305796	0.065013	-0.439394	-1.034099
③データの削減
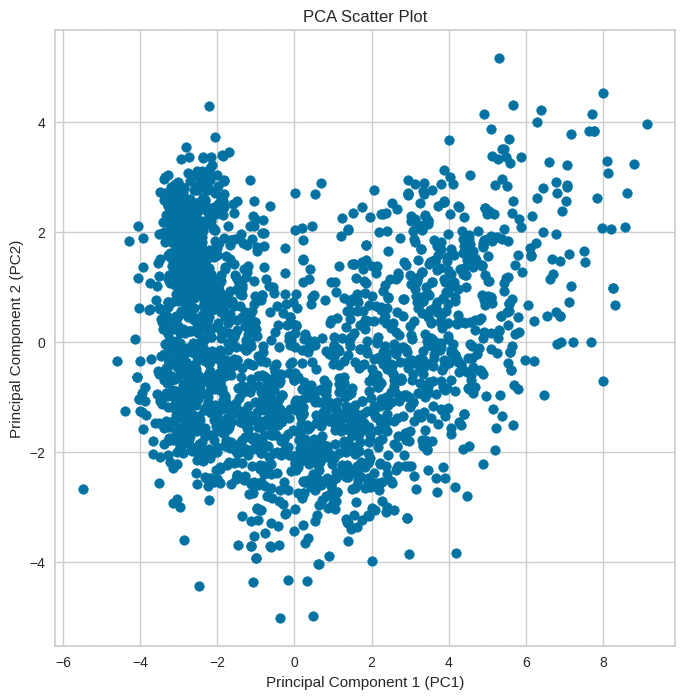
特徴量の多いデータを今回は2次元(2つ)に集約(圧縮)させました。
scaled_df1 = scaled_df.copy()
pca = PCA(n_components = 2,random_state = 42)
scaled_df1 = pca.fit_transform(scaled_df1)
pca_df = pd.DataFrame(scaled_df1, columns=["col1","col2"])

pca_df.head(15).T

plt.figure(figsize=(8, 8))
plt.scatter(pca_df["col1"], pca_df["col2"])
plt.title('PCA Scatter Plot')
plt.xlabel('Principal Component 1 (PC1)')
plt.ylabel('Principal Component 2 (PC2)')
plt.show()
以下のようにまとまりました。
0	1	2	3	4	5	6	7	8	9	10	11	12	13	14
col1	4.232424	-2.764082	1.821748	-2.808413	-0.620472	0.649494	0.377829	-2.514478	-2.720375	-4.401675	-2.455361	3.110597	-1.648524	-2.546865	5.609920
col2 -0.368002 -1.460452 -0.126712 2.020668 0.536085 -1.388813 -0.875940 1.580160 1.349570 -1.248623 2.053370 0.382466 -2.575467 2.817795 -0.518259plt.figure(figsize=(8, 8))
plt.scatter(pca_df["col1"], pca_df["col2"])
plt.title('PCA Scatter Plot')
plt.xlabel('Principal Component 1 (PC1)')
plt.ylabel('Principal Component 2 (PC2)')
plt.show()
5.データのクラスタリング
データのクラスタリングはk-means法という手法を用います。
データを分散の等しいn個のクラスターに分けることができます。
SSEという指標を用いて、クラスタリングがうまくいっているかを確認できます。
SSE:クラスター重心からどれほどずれているか(分散)の総和
つまり、SSEの値が小さいほどモデルと言えます。
以下がデータクラスタリングの流れです。
①クラスタリング数の決定
エルボー法を使用します。
エルボー法とは、クラスターを大きくしていった時にSSEがどのように変化するかを可視化できます。
出力されるグラフの傾きがガクンと曲がる箇所がクラスター数を最適とみなします。プロットの形状が肘が曲がっているように見えることから、エルボー法と呼ばれています。
from sklearn.cluster import KMeans

_, axes = plt.subplots(figsize=(10,4))

elbow = KElbowVisualizer(KMeans(), k=10, timings=False, locate_elbow=True, size=(1260,450))
elbow.fit(pca_df)

axes.set_title("\nDistortion Score Elbow For KMeans Clustering\n",fontsize=25)
axes.set_xlabel("\nK",fontsize=20)
axes.set_ylabel("\nDistortion Score",fontsize=20)

sns.despine(left=True, bottom=True)
plt.show()
最適のクラスタリング数は「4」であることが分かった。

②クラスタリング
K-means法でクラスタリングをします。
km = KMeans(n_clusters = 4,random_state = 42)
# ac = AgglomerativeClustering(n_clusters=4)

y_km = km.fit_predict(pca_df)
pca_df["Clusters"] = y_km
df["Clusters"]= y_km

plt.subplots(figsize=(10, 4))
p = sns.countplot(x=df["Clusters"],palette=["red", "green", "blue", "purple"])
p.axes.set_yscale("linear")
p.axes.set_title("\nCustomer's Clusters\n",fontsize=25)
p.axes.set_ylabel("Count",fontsize=20)
p.axes.set_xlabel("\nCluster",fontsize=20)
p.axes.set_xticklabels(p.get_xticklabels(),rotation = 0)
for container in p.containers:
    p.bar_label(container,label_type="center",padding=6,size=30,color="black",rotation=0,
    bbox={"boxstyle": "round", "pad": 0.4, "facecolor": "orange", "edgecolor": "white", "linewidth" : 4, "alpha": 1})


plt.show()
下図のように4つにクラスタリングされました。

fig = go.Figure(data=[go.Scatter(x=pca_df["col1"], y=pca_df["col2"],
                                mode='markers',
                                marker=dict(size=10, color=pca_df["Clusters"],
                                            opacity=1))])

# レイアウトの設定
fig.update_layout(title=dict(text="Dataset After Clustering [2D Projection]"),
                  xaxis=dict(title="PC1"),
                  yaxis=dict(title="PC2"),
                  margin=dict(l=0, r=0, b=0, t=0))

# グラフの表示
fig.show()
6.データ解析
3.相関性の確認からは購入額に対して、
「年収」「カタログでの購入回数」は相関性が高い、
「年齢」に関してはあまり相関性が高くない
ことが確認できました。
これらについて、データで確認していきます。
①年収と購入額の関係性
import seaborn as sns
import matplotlib.pyplot as plt

cluster_colors = ["red", "green", "blue", "purple"]

_, axes = plt.subplots(figsize=(20, 8))
sns.scatterplot(x=df["Spent"], y=df["Income"], hue=df["Clusters"],palette=cluster_colors)
axes.set_title("\nIncome-Spending Basis Clustering Profile\n", fontsize=25)
axes.set_ylabel("Income", fontsize=20)
axes.set_xlabel("\nSpending", fontsize=20)

sns.despine(left=True, bottom=True)
plt.show()
下図の通り、年収が高い人は購入額が多いことが分かります。
また、
cluster_0:年収が1番高い
cluster_3:年収が1番低い
cluster1,2はその中間であることが分かりました。

②カタログでの購入回数と購入額との相関性
import seaborn as sns
import matplotlib.pyplot as plt

cluster_colors = ["red", "green", "blue", "purple"]


_, axes = plt.subplots(figsize=(20, 8))
sns.scatterplot(x=df["Spent"], y=df["Catalog"], hue=df["Clusters"],palette=cluster_colors)
axes.set_title("\nCatalog-Spending Basis Clustering Profile\n", fontsize=25)
axes.set_ylabel("Catalog", fontsize=20)
axes.set_xlabel("\nSpending", fontsize=20)

sns.despine(left=True, bottom=True)
plt.show()
下図の通り、カタログでの購入回数が多い人は購入額が多い傾向にあることが分かります。
また、
cluster_0:カタログ購入回数が1番多い
cluster_3:カタログ購入回数が1番少ない
cluster1,2はその中間であることが分かりました。

③年齢との購入額
import seaborn as sns
import matplotlib.pyplot as plt

cluster_colors = ["red", "green", "blue", "purple"]

print(f"Let's have a look on the characteristics of the clusters on the basis of income and spending :")

_, axes = plt.subplots(figsize=(20, 8))
sns.scatterplot(x=df["Age"], y=df["Spent"], hue=df["Clusters"],palette=cluster_colors)
axes.set_title("\nSpending-Age Basis Clustering Profile\n", fontsize=25)
axes.set_ylabel("Spending", fontsize=20)
axes.set_xlabel("\nAge", fontsize=20)

sns.despine(left=True, bottom=True)
plt.show()
3.データ相関において、年収は購入額との相関性は低かったです。
下図の通り、一様に分布しているため、相関性が低いことが分かります。

④購入額が多いグループ(cluster_0)での年齢分布
_, axes = plt.subplots(figsize=(10, 6))

sns.histplot(cluster_0['Age'], bins=30, color='red', label='Cluster 0', kde=True)

axes.set_title("\nAge Distribution by Clusters\n", fontsize=20)
axes.set_xlabel("\nAge", fontsize=15)
axes.set_ylabel("Count\n", fontsize=15)
axes.legend()

sns.despine(left=True, bottom=True)
plt.show()
③で示した通り、購入額が多いグループ(cluster_0)内のみにおいても年齢は一様に分布しています。
そのため、購入額が多いグループ(cluster_0)に対して、年齢を絞ってマーケティングをすることは得策では無さそうです。

⑤購入額が多いグループ(cluster_0)でのカタログでの購入回数
_, axes = plt.subplots(figsize=(10, 6))

sns.histplot(cluster_0['Catalog'], bins=30, color='red', label='Cluster 0', kde=True)

axes.set_title("\nCatalog Distribution by Clusters\n", fontsize=20)
axes.set_xlabel("\nCataloge", fontsize=15)
axes.set_ylabel("Count\n", fontsize=15)
axes.legend()

sns.despine(left=True, bottom=True)
plt.show()
カタログでの購入回数においては、購入額が多いグループ(cluster_0)は購入回数が非常に多いというわけではありませんでした。
しかし、購入額が少ないグループ(cluster_3)での分布を確認すると、カタログでの購入者はほとんどいませんでした。
そのため、購入額が多いグループ(cluster_0)が好きそうな商品に絞って、カタログに掲載することは得策であると言えそうです。

_, axes = plt.subplots(figsize=(10, 6))

sns.histplot(cluster_3['Catalog'], bins=30, color='purple', label='Cluster 3', kde=True)

axes.set_title("\nCatalog Distribution by Clusters\n", fontsize=20)
axes.set_xlabel("\nCataloge", fontsize=15)
axes.set_ylabel("Count\n", fontsize=15)
axes.legend()

sns.despine(left=True, bottom=True)
plt.show()
以下が購入額が少ないグループ(cluster_3)の分布です。
gend()

sns.despine(left=True, bottom=True)
plt.show()
7.まとめ
今回のデータ解析では以下のことが分かりました。
・購入額が多い人の年収は高い
・購入額が多い人ほどカタログから購入する人が多い
(購入額が少ない人はカタログからほとんど商品を購入しない)
⇒購入額が多い人が好きそうな商品をカタログに掲載すると良い
・購入額が多い人の年齢はバラバラである。
8.感想と今後
途中で何をまとめたい、知りたいのかという「目的」に対して、アプローチできているのか分からなくなった。
データをあらゆる角度からまとめることが可能となるが、
目的を見失ったり、闇雲に処理しているとデータ数だけが多くなり、処理できなくなる。その辺りは難しいし、経験していかなくちゃと感じた。
一方で、普段はマーケティングとかしないし、そういう面で新鮮さと楽しさがあり、面白かった。
