[ 備忘録 ] Rでテキスト分析(データ分析編その2)
前回の記事の続きです。
今回は共起ネットワークグラフを作成してみる。
まずは次のコマンドを実行し、データの整形を行う。
library(igraph)
dat_bigram <- dat %>% filter(class %in% c("名詞", "形容詞", "動詞")) %>% rename(pre = term) %>% mutate(post = lead(pre)) %>% select(pre, post) %>% filter(! is.na(post))
メロス、王、妹、セリヌンティウスの後に来る単語を可視化する。
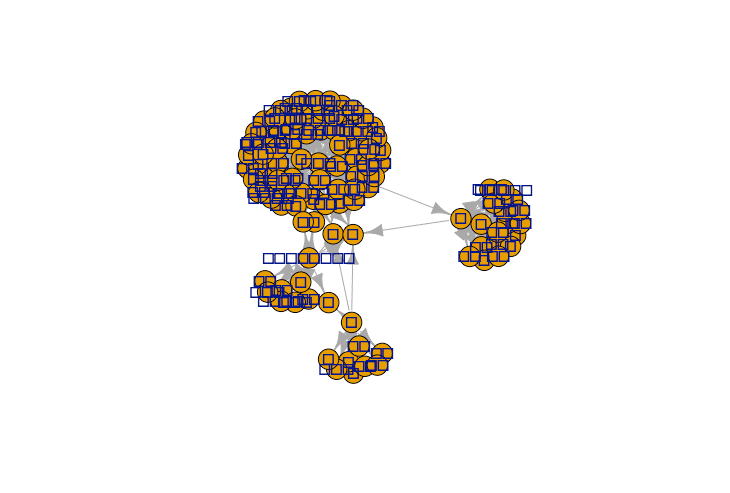
dat_bigram %>% filter(pre %in% c("メロス", "王", "妹", "セリヌンティウス")) %>% graph.data.frame() %>% plot()実行すると・・・

前回に引き続き、また、お豆腐!
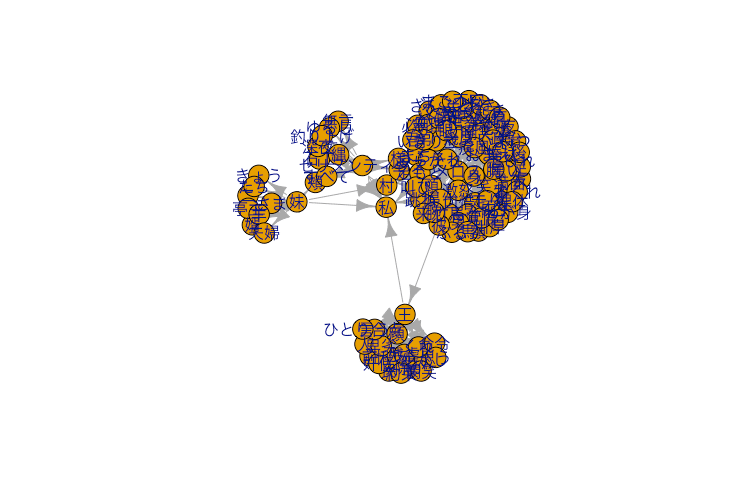
plot に vertex.label.family="HiraKakuProN-W3" を追加するとよいらしいので、追加して実行すると・・・
dat_bigram %>% filter(pre %in% c("メロス", "王", "妹", "セリヌンティウス")) %>% graph.data.frame() %>% plot(, vertex.label.family="HiraKakuProN-W3")
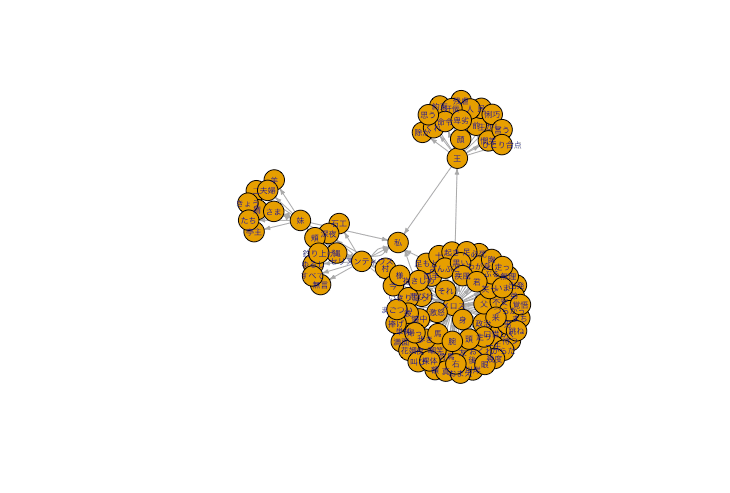
うーん、文字化けは直ったが見ずらい。オプションで少し調整する。
dat_bigram %>% filter(pre %in% c("メロス", "王", "妹", "セリヌンティウス")) %>% graph.data.frame() %>% plot(vertex.label.family="HiraKakuProN-W3", vertex.label.cex=.5, edge.arrow.size=.3, edge.curverd=.1)
・・・今回はこれくらいにしておこう!
(参考URL)
igraph の文字化け対応
https://qiita.com/gigi_QuestionsDesigner/questions/53e1cc5ce50409e9b58d
igraphのオプションなど
http://www.nemotos.net/igraph-tutorial/NetSciX_2016_Workshop_ja.html
