On the Resource Management of Pacific Bluefin Tuna — Public Inquiry to the WCPFC (Western and Central Pacific Fisheries Commission) —
The total allowable catch (TAC) for Pacific bluefin tuna have been managed since 2015, and it has been 10 years since the implementation. In October 2024, at the WCPFC (Western and Central Pacific Fisheries Commission) Northern Committee meeting, it was confirmed that the management target for the spawning stock was achieved, and the Committee approved an increase in TAC from the 2025 fishing season onwards. Over the past decade, the spawning stock has significantly increased, and resource management seems to have been successful.
However, the main sacrifices made to increase resources were borne by coastal fishermen. Due to large amounts of bluefin tuna being caught in fixed-net fisheries and other methods, there was widespread chaos on the beaches, including requests for the release of tuna and self-restraint in operations. Additionally, the extremely small allocation of TAC to coastal fisheries has placed a great strain on the management of coastal fisheries, leading to financial hardship for coastal fishermen.
Moving forward, how the increased TAC will be allocated is a major issue. To ensure a fairer distribution, it is necessary to "summarize the current fishing regulations," and based on this perspective, an evaluation was carried out on the following points:
Was it really necessary to implement such strict catch reductions in the first place?
Was there sufficient scientific evidence to justify such strict catch reductions?
Can the resource management theory used as the background be considered correct?
Was there a prioritization of large-scale fisheries and neglect of small coastal fisheries?
Did the excessive catch reduction result in wasted resource utilization?
The results were summarized in 16 points and submitted to the WCPFC in the form of a public questionnaire, which was also made available online. I sincerely request that the WCPFC staff, despite their busy schedules, provide a public response to the questions.
(1) The Process Leading to the Adoption of Conservation Management Measures at the WCPFC
First, I would like to ask about the process leading up to the adoption of conservation management measures at the WCPFC.
At the WCPFC, I understand that conservation management measures are first proposed by the member countries or the Secretariat at the Northern Committee, and after deliberation, a decision is made on whether or not the proposal will be adopted. However, I have heard that the Scientific Committee does not adopt conservation management measures by majority vote but rather by unanimous agreement of all participating countries. Therefore, if even one country among the participants opposes the measure, it will not be adopted. Is this understanding correct?
On page 36 of the document regarding Pacific bluefin tuna resource management [1], it is stated that, "In 2009, the WCPFC adopted conservation management measures to reduce fishing effort for juvenile fish (ages 0-3) to the levels of 2002-2004" (this will be referred to as 'Conservation Measure 1') and "In 2014, the WCPFC adopted conservation management measures to reduce the catch of small fish by half compared to the average levels of 2002-2004" (this will be referred to as 'Conservation Measure 2').
However, as I will show in (2), these two conservation management measures have fundamental flaws, and I would like to point out these errors first.
By the way, which country proposed Conservation Measures 1 and 2 mentioned above?
(2) "Conservation Measures 1 and 2" have fundamental flaws!
Figure 1 shows the age-specific catch numbers [2]. Looking at the catch numbers, the proportion of 0-year-old and 1-year-old fish in the total catch is extremely high (almost 90%), and from the perspective of effective resource utilization, this is indeed a significant problem. While improvements are clearly needed, I would like to discuss this issue further below.
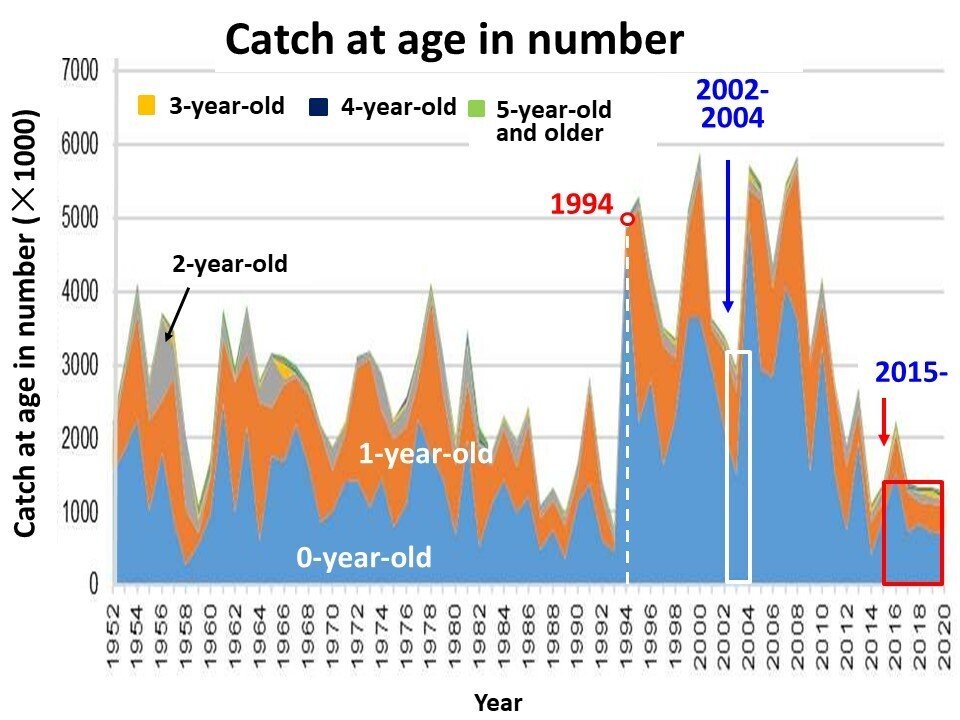
One additional point to note in Figure 1 is that the catch numbers after 1994 have nearly doubled compared to those before. How the increase in catch numbers after 1994 is interpreted will significantly affect the approach to resource management. What is important here is that "there are two factors that must be considered regarding this phenomenon." One factor is the state of the resource being targeted (natural factors), and the other factor is the artificial impact (fishing effort or fishing mortality coefficient) (human factors).
For those who believe in the MSY (Maximum Sustainable Yield) theory, the idea that "resources naturally fluctuate even without human involvement" is not considered. Therefore, they can only think that "the increase in catch numbers after 1994 was due to the increase in fishing intensity (fishing effort)." In other words, it is believed that after 1994, particularly small fish were overfished, which caused a decline in resource stock. As a result, the conclusion would be reached that "to restore the resource, the first priority must be to regulate small fish."
Indeed, it is a fact that sonar was introduced after 1994, and fishing efficiency improved significantly. Even if the number of operational days and fishing vessels remained unchanged, it is entirely plausible that the effective fishing effort (fishing mortality coefficient) increased. However, attempting to explain the increase in catch numbers solely by this would lead to a significant mistake, as will be shown later.
Figure 2 shows the year-to-year variation in the fishing mortality coefficients for 0-year-old and 1-year-old fish (fishing mortality coefficient data that I have is only available up to 2012, so only data up to 2012 is used). A comparison is made between the fishing mortality coefficients after the sharp increase in catch numbers from 1994 onward and the average values before 1993. However, it is known that a significant regime shift occurred in 1957/58, so the period from 1958 to 1993 is used. The average fishing mortality coefficient for the 36 years from 1958 to 1993 was 0.40 for 0-year-old fish and 0.79 for 1-year-old fish. From 1994 to 2012, the average fishing mortality coefficient increased to 0.56 for 0-year-old fish (a 40% increase) and 0.99 for 1-year-old fish (a 25% increase), showing that fishing effort has indeed increased since 1994.
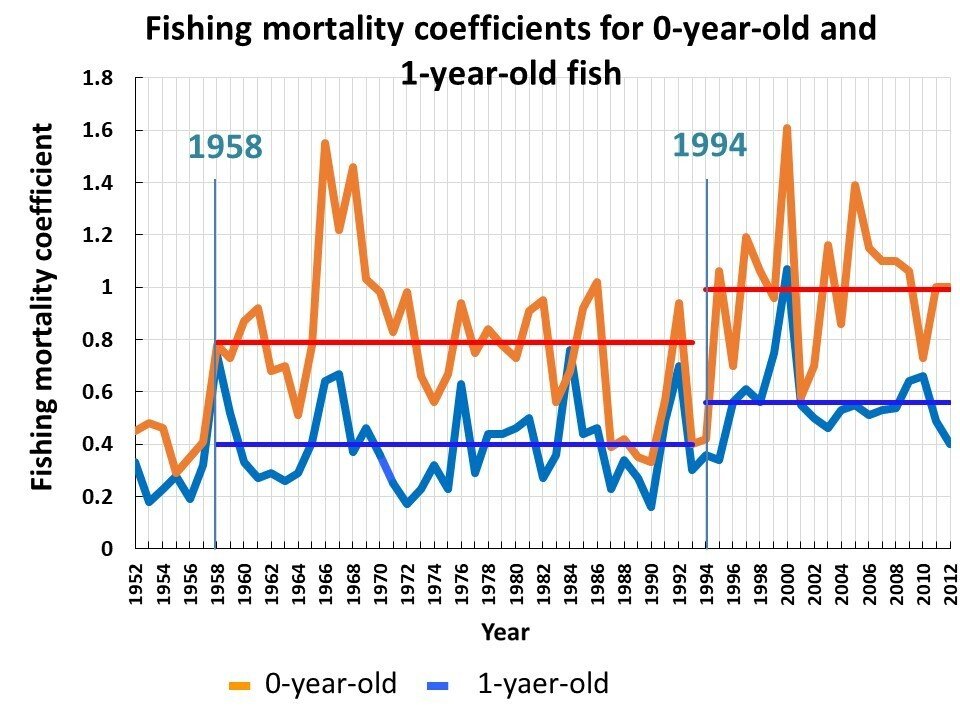
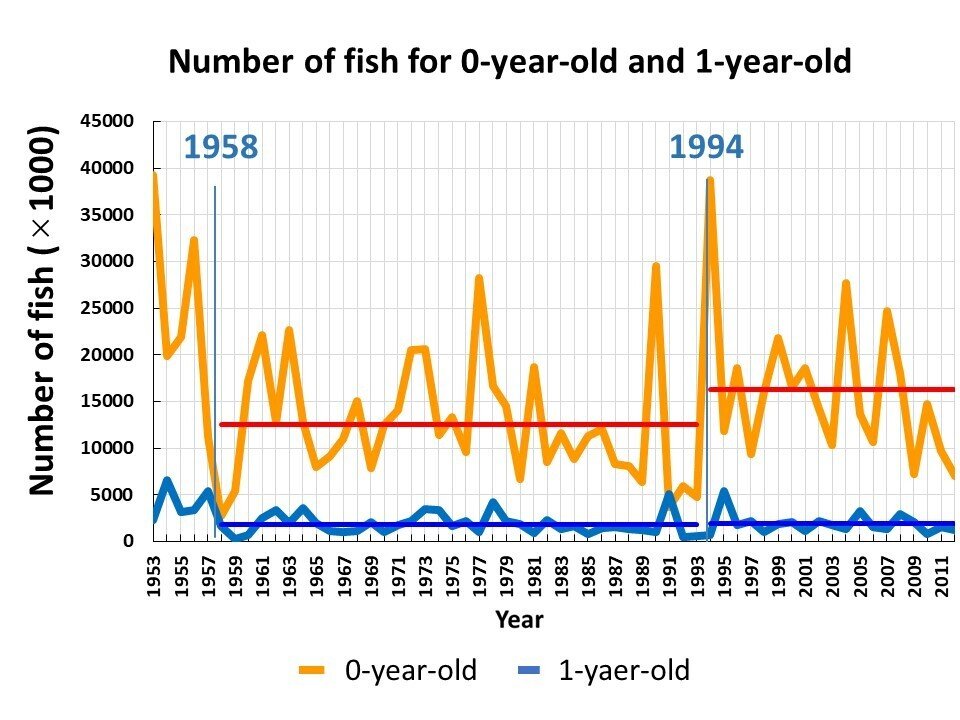
Figure 3 shows the year-to-year variation in the resource numbers for 0-year-old and 1-year-old fish (catch number data by age that I have is also only available up to 2012, so the data used is up to 2012). Similarly, the average resource numbers for the 36 years from 1958 to 1993 were 12.57 million for 0-year-old fish and 1.823 million for 1-year-old fish. From 1994 to 2012, these numbers were 16.27 million for 0-year-old fish (a 29% increase) and 1.895 million for 1-year-old fish (a 4% increase).
Although the resource numbers for 0-year-old fish increased by 29%, the increase for 1-year-old fish was only 4%. This is believed to be because much of the increase in 0-year-old fish was caught before reaching 1 year of age. Looking at Figure 1, it is clear that while the catch numbers for 0-year-old fish have sharply increased since 1994, the catch numbers for 1-year-old fishhave not increased as significantly.
From the above, it can be inferred that the sharp increase in the catch numbers of small fish (particularly 0-year-old fish) since 1994 is due to two factors: the increase in the recruitment number (0-year-old fish) and the increase in fishing intensity since 1994.
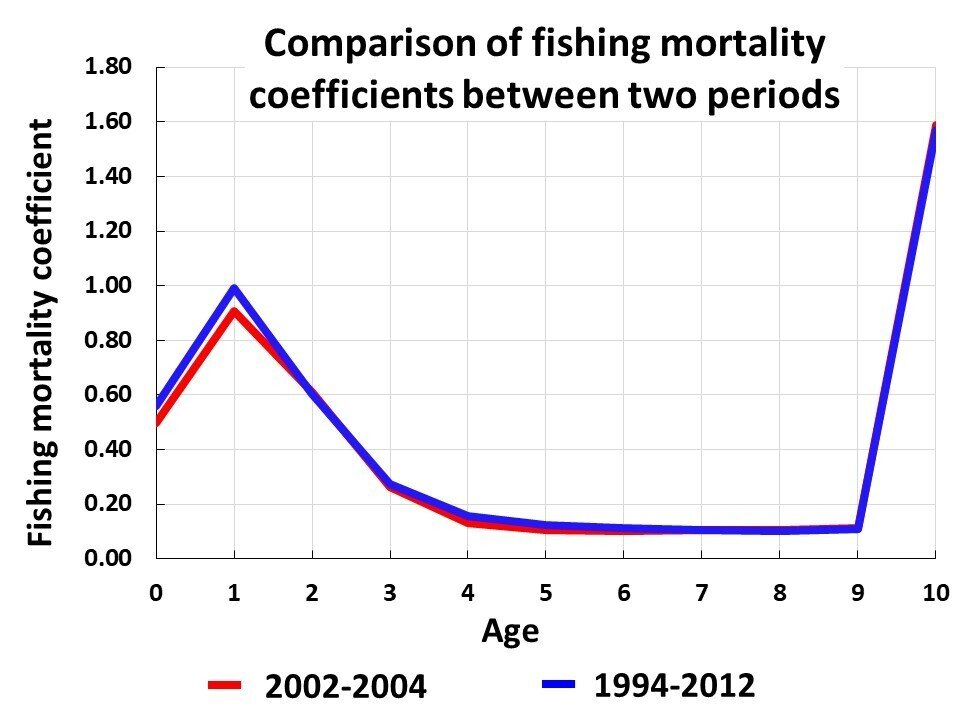
"Conservation Measure 1" is aimed at reducing the fishing effort for juvenile fish (ages 0-3) to the levels of 2002-2004. This appears to be intended to reduce the fishing effort (fishing mortality coefficient) that increased after 1994 to the levels of 2002-2004, a period when the catch numbers were low. However, this line of thinking is actually incorrect.
Figure 4 shows the average fishing mortality coefficients by age for the entire period from 1994 to 2012, as well as the period specified by "Conservation Measure 1" (2002-2004). As seen in Figure 4, the fishing mortality coefficients during the 19 years from 1994 to 2012, when the catch numbers sharply increased, and the period from 2002 to 2004, as designated by "Conservation Measure 1," hardly differ. Therefore, the idea of reducing the fishing effort (fishing mortality coefficient) that increased after 1994 to the levels of 2002-2004 is meaningless, and adopting such a conservation measure turns out to be entirely pointless.
So, why has the catch number fluctuated so greatly since 1994? It is because the resource numbers (especially the 0-year-old fish) themselves have fluctuated significantly. The catch numbers did not fluctuate due to changes in fishing effort (fishing mortality coefficient). Unfortunately, many people misunderstand this.
The reason for this misunderstanding is that, as mentioned earlier, "MSY theory does not account for natural fluctuations in resources," so people can only think that "the increase in catch numbers since 1994 was due to the increase in fishing effort (fishing mortality coefficient)." Similarly, they can only think that "the reduction in catch numbers during the 2002-2004 period was due to the lower fishing effort (fishing mortality coefficient)." In other words, because they believe "catch numbers are determined by fishing effort," the idea arises that "fishing effort for juvenile fish (ages 0-3) should be reduced to the levels of 2002-2004, when catch numbers were low." Again, the fishing effort in both the 2002-2004 period and the 1994-2012 period is nearly the same, so "Conservation Measure 1," which aims to reduce fishing effort to the 2002-2004 level, is completely meaningless.
Does the WCPFC acknowledge that Conservation Measure 1 is ineffective?
"Conservation Measure 2" aims to "reduce the catch of small fish by half from the average of 2002-2004," but this, too, is derived from the same erroneous thinking as "Conservation Measure 1," and it becomes an utterly ridiculous conservation measure.
Again, the reason the catch numbers were low during 2002-2004 was not because fishing effort was low, but because the resource numbers were low. "Reducing the already low catch by half due to low resource levels" is nothing short of "insane."
Because, if the TAC is set to half the average catch of small fish during the low-resource period of 2002-2004, then when resource numbers increase, it leads to an absurd situation. For example, if the resource numbers double, the TAC would be set to one-quarter of the 2002-2004 average catch, and if the resource numbers triple, the TAC would be set to one-sixth of the 2002-2004 average catch. As shown in Figure 3, the annual variation in the resource numbers of 0-year-old fish is large, and it is not unusual for there to be differences of several times from year to year. This is only a reflection of "the thinking of MSY believers who do not understand that resources fluctuate due to environmental changes," and it is terrifying that such decisions are made without hesitation. If such decisions are made, fishing would become nearly impossible on-site, leading to complete chaos. In fact, even though there are many bluefin tuna along the coast, the situation frequently arises where no fishing can be done due to catch restrictions (it has been reported that more than 10 times the TAC was released in set-net fisheries [3] ), leading to major confusion on the coast.
The question is: Why was the period with particularly low catch numbers (2002-2004) chosen, and why was half of the low average catch (50%) set as the TAC for small fish? In other words, I would like an explanation of the scientific basis for adopting "Conservation Measure 1" and "Conservation Measure 2."
(3) Did the WCPFC not consider the idea of "avoiding sudden fluctuations in catch numbers due to fishing regulations"?
Related to what was mentioned in (2), looking at Figure 1, it is clear that the catch numbers from 1994 to 2008 often reached extremely high levels, around 5 to 6 million individuals. However, after the implementation of the TAC, the catch numbers dramatically decreased to around 1.5 million individuals, about one-third to one-quarter of the previous level. Was it not a concern for the WCPFC that such a sharp decrease in catch numbers would occur due to the fishing regulations? Considering the impact on fisheries management, a sudden reduction in catch numbers would have a significant effect on fisheries operations, and it is generally believed that such rapid reductions should be avoided. Did the WCPFC believe that "such considerations were unnecessary"?
(4) Was the year 2002-2004 chosen as the reference period in order to prioritize purse-seine fisheries?
"Conservation Measure 2" was adopted in 2014. When comparing the average catch for large and medium-sized purse-seine fisheries and set-net fisheries, using either the three years immediately before 2014 (2011-2013) or the current reference years (2002-2004), the difference in catch can be seen.
Figure 5 shows the year-to-year changes in the catch of Pacific bluefin tuna (large fish) by fishing method in Japan [2]. The red line represents the catch of large bluefin tuna by purse-seine fisheries. As shown in this figure, the catch of large bluefin tuna by purse-seine fisheries has been decreasing since 2004, and the period from 2002-2004 was actually a high period for catches.
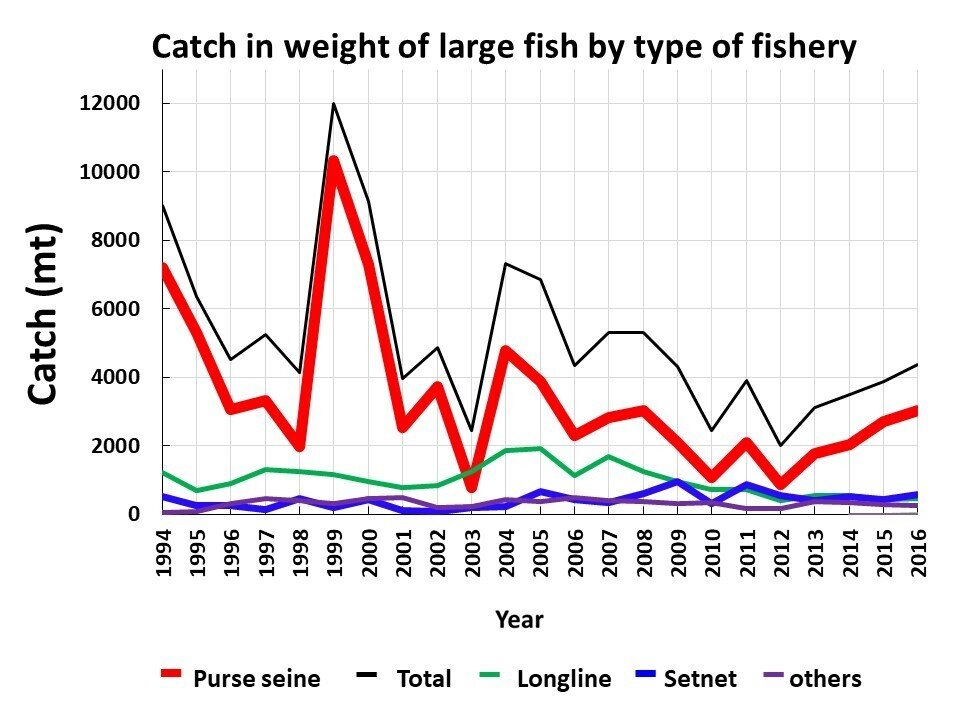
When we actually calculate the average catch, we find that the average catch of 3,098 tons using 2002-2004 as the reference period is 1.96 times larger than the average catch of 1,583 tons calculated using 2011-2013 as the reference period.
Figure 6 similarly compares the average catch of small bluefin tuna caught by purse-seine fisheries. As shown in this figure, the catch of small bluefin tuna by purse-seine fisheries has been declining since 2005. However, when using 2002-2004 as the reference period, the average catch of 4,545 tons is 1.58 times larger than the average catch of 2,942 tons calculated using 2011-2013.
In large and medium-sized purse-seine fisheries, self-imposed catch regulations for small bluefin tuna were introduced starting in 2011. From 2011 to 2013, the catch was limited to 5,000 tons, a 22% reduction compared to the average catch of 6,540 tons from 2005-2009. In 2014, the catch limit was further reduced by 34% to 4,250 tons. However, in 2011, the catch of small bluefin tuna was 6,243 tons, which was only a 5% decrease compared to the 2005-2009 period. The catches in 2012 (1,592 tons), 2013 (990 tons), and 2014 (3,409 tons) were much lower, but this appears to be due to a decrease in the resource of younger fish, rather than a reduction in fishing effort (see Figure 7).
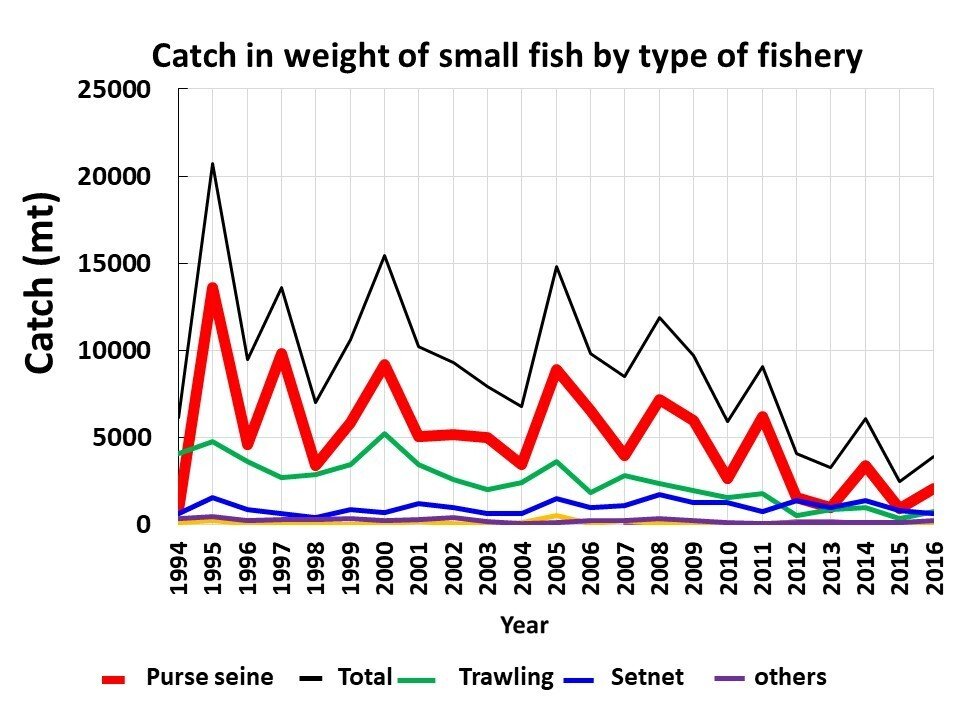
Figure 7 shows the annual variation in biomass by age group (it would be clearer to look at the resource numbers by age, but I do not have that data). Focusing on the biomass of 0-year-old and 1-year-old bluefin tuna from 2005-2009 and 2011-2014, it is clear that the biomass of 0-year-old and 1-year-old fish from 2011 to 2014 is approximately 20-30% lower than that of 2005-2009.
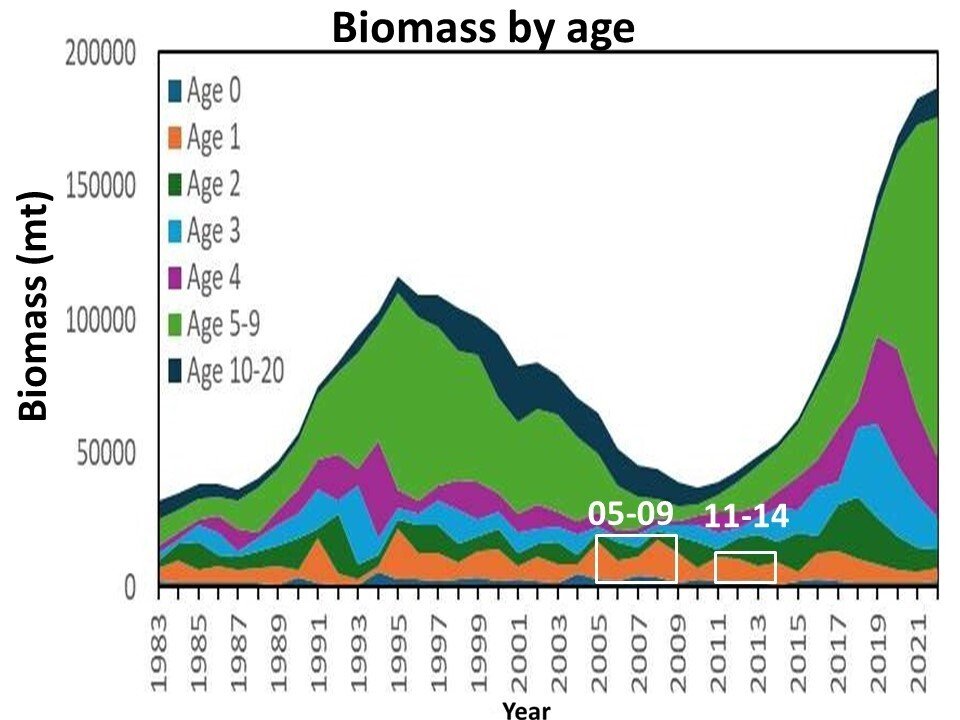
Figure 8 shows the trend in catch for coastal set nets. As can be clearly seen from Figure 8, the catch of both large and small fish has shown an increasing trend since the late 1990s, with particularly high volumes observed after 2005. When the same calculations as above are applied to the catch of coastal set nets, the average catch of large fish using the reference years 2002–2004 was 173 tons, which is an extremely low value of only 27% (a 73% decrease) compared to the average catch of 607 tons in 2011–2013. Similarly, the average catch of small fish for the reference years 2002–2004 was 772 tons, which was 73% (a 27% decrease) of the average catch of 1,059 tons in 2011–2013.
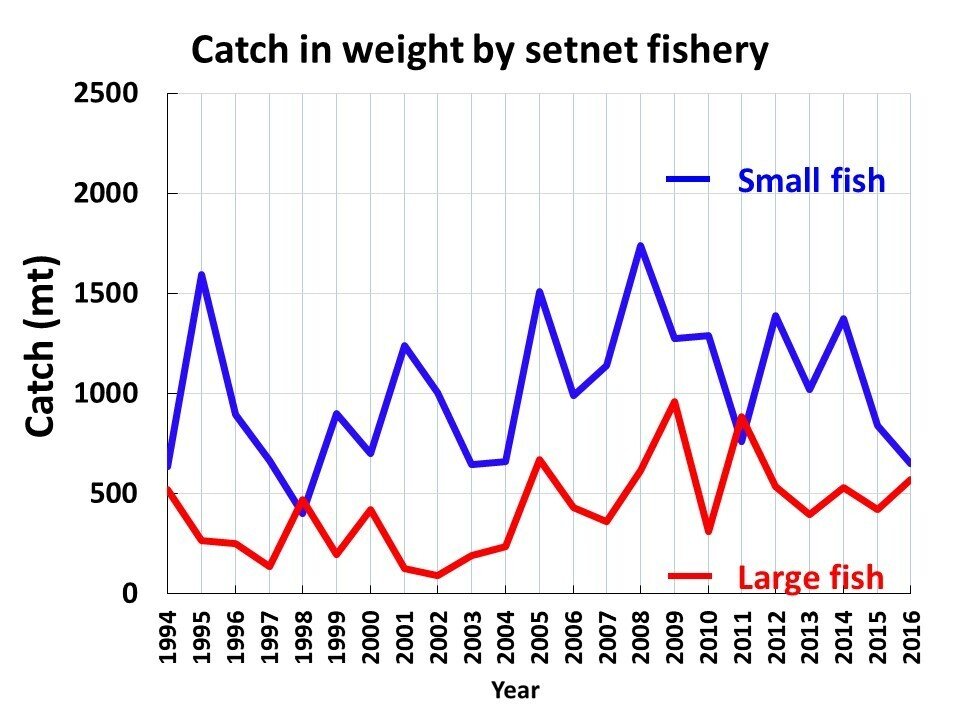
From the above, it is clear that by setting the reference years as 2002-2004, the allocation becomes extremely advantageous for the purse seine fisheries and extremely disadvantageous for the coastal set-net fisheries. The "obvious prioritization of large-scale fisheries and neglect of small-scale coastal fisheries" attitude when deciding the reference years can be seen. I would like to ask for the WCPFC' explanation regarding this.
(5) Why was it necessary to halve the TAC for small-sized fish?
Figure 9 presents the Fisheries Agency of Japan' explanation that reducing the catch of small-sized fish has a greater effect on resource recovery than reducing the catch of large-sized fish [1]. In other words, reducing the catch of small-sized fish by 1 ton will increase the resource stock by 12 times in five years, whereas reducing the catch of large-sized fish by 1 ton would only increase the resource stock to 0.66 times in five years. In other words, the explanation suggests that regulations on large-sized fish not only fail to contribute to resource growth but could even have a negative impact.
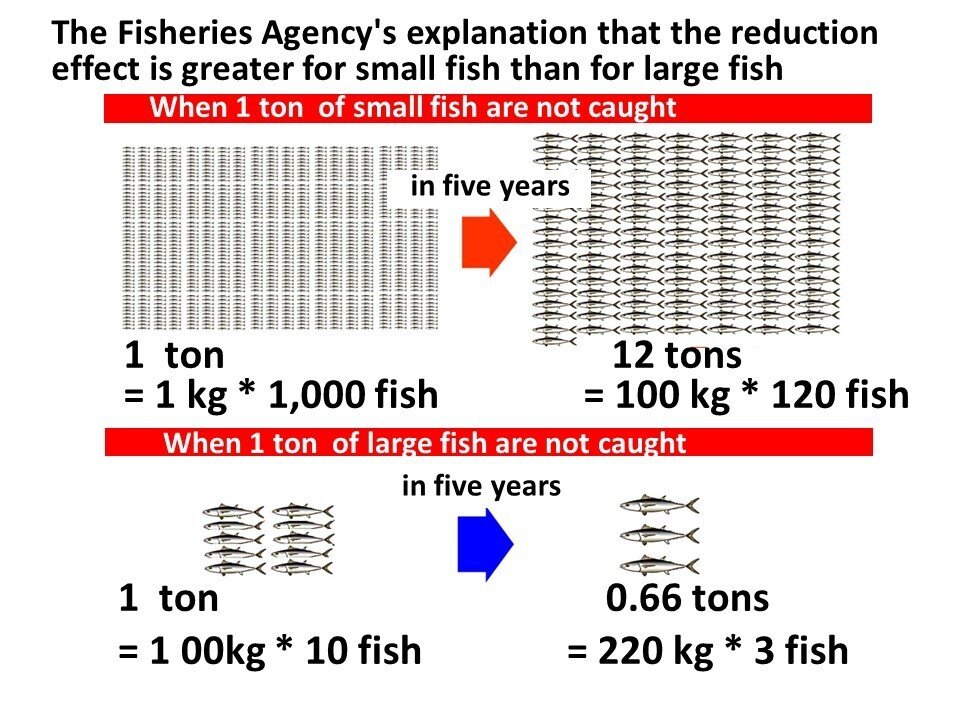
However, it seems that an important factor is "deliberately" being ignored in this explanation. The reason I write "deliberately" is because I believe that the capable Ministry of Fisheries cannot possibly have missed this. Specifically, Pacific bluefin tuna reaches 20% maturity at age 3 (34.5 kg), 50% at age 4 (58.4 kg), and 100% at age 5 (85.2 kg) [1]. The contribution of 1 kilogram of small-sized fish (1 ton = 1000 fish) to resource growth through reproduction over the following five years is likely to be quite low. In contrast, if 1 ton of large-sized fish (100 kg) is reduced, it will contribute to reproduction over the next five years, and the contribution of large fish to resource growth through reproduction is likely to be far greater than that of small fish.
When considering the effects of fishery regulations, it is important to take into account not only the increase in resource weight but also the contribution to reproduction. It seems clearly one-sided if only the former is considered, but as already mentioned, the Ministry of Fisheries has only focused on the former. I would like to ask for the WCPFC' view on this matter.
However, since it is extremely difficult to quantitatively assess which effect is larger, it is necessary to conduct simulations or other evaluations in such cases. An example of a simulation-based assessment is shown in (7).
(6) The TAC for small-sized fish in the coastal areas has not been halved but has been reduced to one-third or even one-seventh. I would like to ask for the WCPFC' opinion on this.
Figure 10 shows the changes in the fishing mortality coefficient [4]. The blue line shows the average fishing mortality coefficient by age group for the reference years 2002-2004. The dotted line represents the 2011-2012 period, and the red line shows the average fishing mortality coefficient for 2018-2020. It is clear that the fishing mortality coefficient for small fish (ages 0-3) in particular has decreased significantly in the red line compared to the blue line. The Ministry of Fisheries (Fisheries Research and Education Agency) has shown this figure and stated, "Compared to the reference years (2002-2004) or when catch limits were introduced (2011-2013), the fishing effort for young fish has drastically decreased in recent years (2018-2020). This is likely due to the reduction in small fish catches," and has affirmed the positive effect of the reduction in small fish catches [4]. However, this figure also reveals significant issues that cannot be overlooked, and caution is needed.
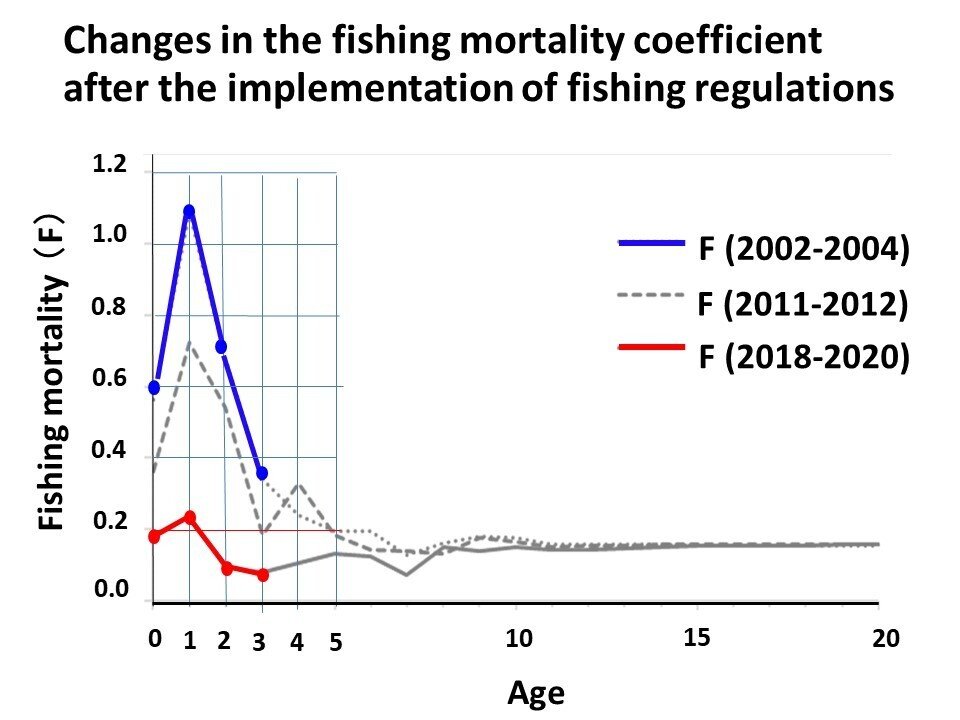
To compare the TAC for small-sized fish, which was set to reduce the average catch of small fish by 50%, I extracted the fishing mortality coefficient values from Figure 10 and converted them into fishing rates, as shown in Table 1. I will explain how to interpret the values for age 0 fish in Table 1.
From Figure 10, the average fishing mortality coefficient for age 0 fish in the reference years 2002-2004 is 0.60. When this value is converted to a fishing rate, it becomes 24%. A fishing rate of 24% means that, for example, if the resource amount of age 0 fish was 100 tons, the catch of age 0 fish would be 24 tons.
Similarly, when the fishing mortality coefficient of 0.19 for age 0 fish in the 2018-2020 period is converted to a fishing rate, it becomes 9%. This means that the TAC set at 50% of the average catch from 2002-2004 is equivalent to reducing the fishing rate from 24% to 12%. However, the actual fishing rate during 2018-2020 had decreased to 9%.
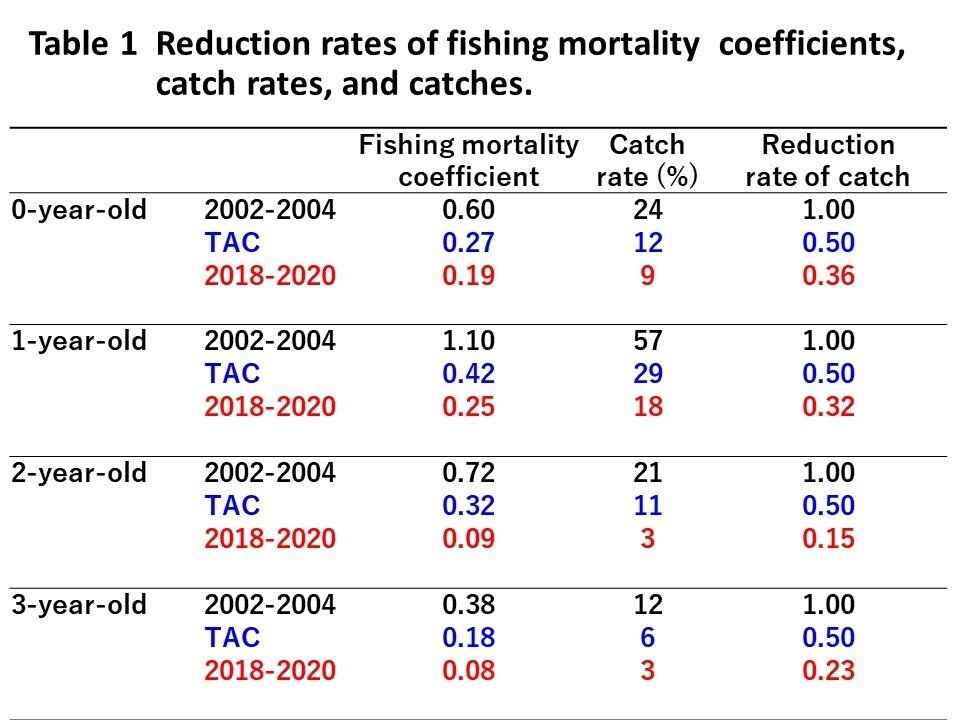
In other words, although the TAC was set to 50% of the average catch from the reference years 2002-2004, by the time we reach the 2018-2020 period, it turns out that the TAC was not halved, but rather reduced to 36% (a third) of the 2002-2004 average catch. Similarly, for age 1 fish, the TAC value for 2018-2020 was reduced to one-third of the 2002-2004 average catch; for age 2 fish, it was reduced to one-seventh; and for age 3 fish, it was reduced to one-quarter.
This drastic reduction in catch is essentially the same as saying "do not catch" the fish, leading to significant confusion in coastal fixed-net fisheries and others. It is no exaggeration to say that the large-scale confusion that occurred in coastal fixed-net fisheries was a "man-made disaster" caused by such abrupt reductions in catch. I would like to ask the WCPFC for their thoughts on this.
(7) Why was it necessary to halve the average catch of small-sized fish? I would like to hear the rationale and scientific basis for this decision.
Figure 11 presents the results of a simulation conducted to assess the effects of fishing regulations [5, 6]. This simulation, carried out in 2015, assumes that fishing regulations were implemented from 2004 to 2012. The actual fishing regulations applied used the average catch from 2002-2004, with the TAC for small-sized fish set at 50% of the average catch, and the TAC for large-sized fish set at the average catch itself. This is significantly different from the simulation, which uses fishing mortality coefficients to implement the regulations.
In the simulation, it is assumed that the actual fishing mortality coefficients for small-sized fish (age 0-3) in 2004 are, for example, reduced by 50%. Since the fishing regulations in the simulation are based on fishing mortality coefficients, if the resource quantity of age 0 fish doubles, the TAC for age 0 fish also doubles, and similarly for age 1 and age 2 fish. This creates a more flexible and "looser" fishing regulation compared to the fixed TACs actually applied. If the Pacific bluefin tuna fishing regulations had used this type of TAC setting, some of the confusion that occurred might have been avoided.
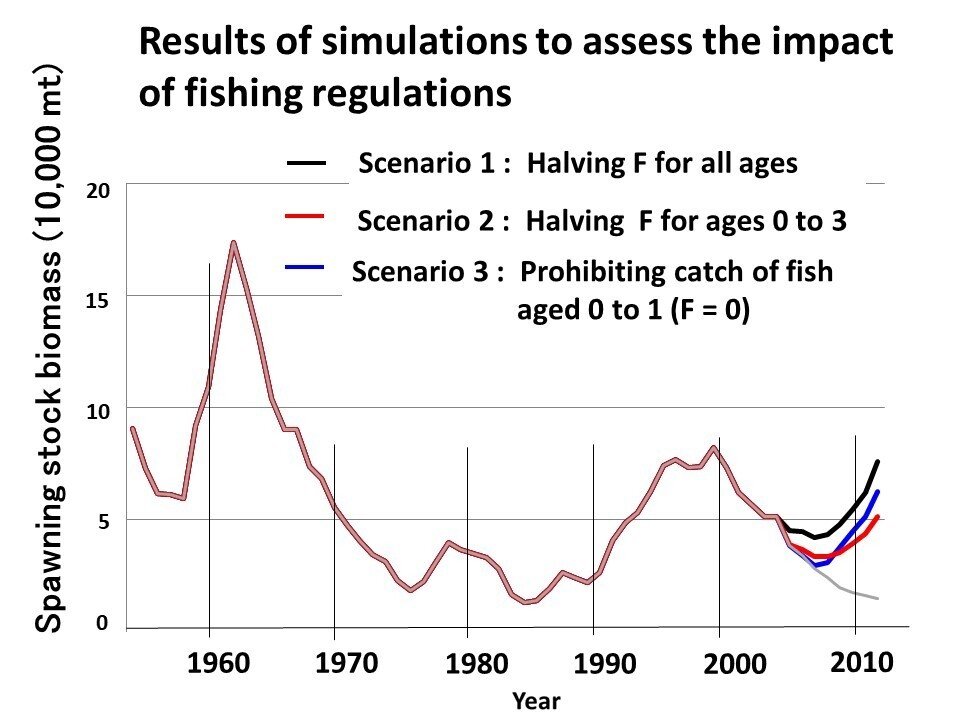
That said, the simulation assumes three scenarios:
Scenario 1: If the fishing mortality coefficient F for all age groups is halved,
Scenario 2: If the fishing mortality coefficient F for small-sized fish (0-3 years old) is halved,
Scenario 3: If fishing for age 0 and age 1 fish is prohibited (i.e., the fishing mortality coefficient F for age 0-1 is set to 0).
Looking at Figure 11, it is clear that the most effective fishing regulation is when the fishing mortality coefficient F is halved for all age groups (Scenario 1). It is also evident that prohibiting fishing for age 0 and 1 fish (Scenario 3) would result in substantial regulation effects. As mentioned in (5), the Fisheries Agency argues that the regulation of large-sized fish has no effect and actually reduces the resource, but this simulation clearly shows that this claim is incorrect. If the Fisheries Agency's explanation were correct, then Scenario 2 (halving F for 0-3 year-olds) would result in greater regulatory effects than Scenario 1 (halving F for all ages).
Moreover, the actual fishing regulations imposed by the WCPFC for Pacific bluefin tuna appear to resemble those of Scenario 3. The proportion of fishing for age 0-1 fish is extremely high, and reducing this proportion is clearly beneficial for resource management, as this simulation demonstrates. However, such measures reducing the fishing intensity for ages 0 and 1 should have been implemented more gradually over time. Therefore, considering the higher regulatory effect of applying restrictions to all ages and the undue burden placed only on fisheries targeting small-sized fish, the current fishing regulations cannot necessarily be said to be appropriate. From the perspective of fairness in the distribution of burdens and the effectiveness of the regulation, other regulatory methods should have been considered.
The simulation was conducted in the case of a decrease in spawning biomass (2004-20012), reducing the fishing mortality coefficient by 50% for the most recent years yields extremely high regulatory effects. Considering that the spawning biomass has been increasing since 2010 (see Figure 12), it is reasonable to assume that resources could have been restored by reducing the fishing mortality coefficient by 10-20% in recent years and recalculating the TAC based on current resource levels, including both small and large tuna.
In fact, due to the extreme reduction in catch levels, the resource of Pacific bluefin tuna is rapidly recovering. This has been reported at the ISC (International Scientific Committee for Tuna and Tuna-like Species in the North Pacific Ocean) annual meeting in June 2024, held in Canada, where it was announced that the resource level for Pacific bluefin tuna had reached the recovery target of 20% of B0 (the estimated resource level before fishing began) in 2022, 13 years ahead of schedule [7]. The timeline for resource recovery involves a trade-off between burden and benefit, and it is not necessarily the case that the recovery period should be shortened arbitrarily. The fact that the recovery target was achieved 13 years earlier than expected suggests that the reduction in catch was excessively large. I would like to hear the WCPFC's views on this.
(8) Why has the WCPFC not conducted the type of simulations described in (7)?
Conducting the kind of simulation outlined in (7) would have revealed that the claim by the Fisheries Agency that regulations on large-sized fish are ineffective and actually reduce resources is incorrect. Additionally, such simulations could help determine which fishing regulations would yield the greatest effects, and how the timing of regulations (which varies with environmental conditions) affects those results.
For instance, in the simulation of implementing catch regulations using fishing mortality coefficients from 1987 to 1991, Scenario 2 showed the highest regulatory effectiveness [6]. The reason for this is attributed to the exceptionally large recruitment of age-0 fish in 1990 (see Figure 3). It is important to note that even with the same catch regulations, the outcome may vary depending on the recruitment conditions (environmental factors) at the time.
The simulations conducted by the WCPFC do not consider how the effectiveness of regulations changes depending on when they are implemented. This is because actual environmental fluctuations are not considered, and random fluctuations are simply introduced. Therefore, it is expected that the WCPFC should conduct simulations like those presented in (7) to explore more detailed and effective fishing regulations. Does the WCPFC plan to conduct such simulations in the future?
However, as long as MSY theory is the basis, such simulations cannot be conducted, as I will explain later in (9). This is because the stock-recruitment relationship under MSY theory are unclear, and without a clear understanding of reproduction mechanism, it is impossible to perform such simulations.
(9) Does the year-on-year variation in spawning biomass indicate that the MSY theory is wrong?
Figure 12 presents estimated results for spawning biomass [7]. Figure 13 shows the trend in tuna catch by country [1], with Japan's catch shown in blue.
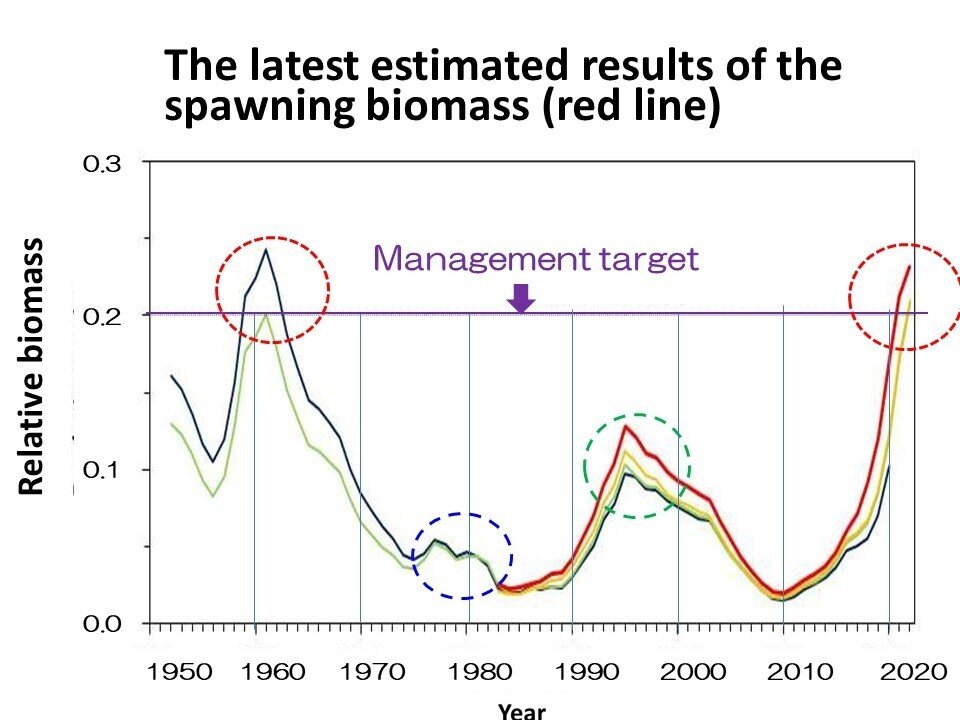
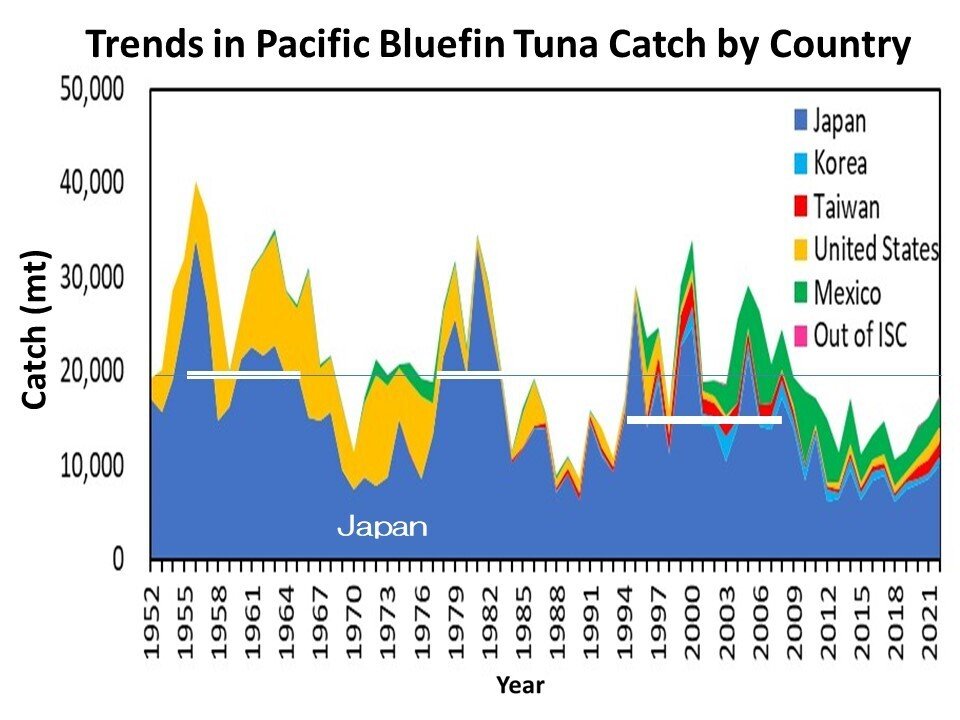
Figure 12 shows that around 1960, the spawning biomass was about 20% of B0 (the spawning biomass if there were no fishing), which is relatively high. Around 1980, the spawning biomass was only about 5% of B0, which is extremely low. On the other hand, Figure 13 shows that Japan's catch around 1960 was approximately 20,000 tons, and even though the spawning biomass around 1980 was only about 5% of B0, the catch was still more than 20,000 tons. This shows that fishing pressure was extremely high during this period.
Due to this high fishing pressure, the spawning biomass dropped to a historic low of 11,000 tons by 1982, according to the WCPFC. However, despite no specific fishing regulations being implemented, the spawning biomass began to increase after 1982 and reached 79,269 tons by 1995. Why did the spawning biomass begin to increase around 1982? I would like an explanation of the mechanism for this increase based on the MSY theory.
Additionally, Figure 12 shows that around 1995, the spawning biomass was around 10% of B0, which was relatively high. However, Figure 13 indicates that Japan's catch of Pacific bluefin tuna was around 15,000 tons or more from 1995 onwards, which was quite high. Considering that the spawning biomass in the 1960s was at a much higher level, with catches of around 20,000 tons, it is notable that even though the spawning biomass in the 1990s was only about half of the 1960s level, the catch levels were only about 25% lower than in the 1960s. This means that during this period, fishing pressure was relatively high compared to the spawning biomass.
Due to this strong fishing pressure, the spawning biomass dropped to a near-record low of 12,275 tons in 2010, according to the WCPFC. However, as with the earlier example, the spawning biomass began to increase after 2010. The TAC-based fishing regulations were implemented in 2015, so the effects of these regulations would take several years to manifest, meaning that the spawning biomass would not have started to increase until a few years after 2015. As previously mentioned, voluntary regulations by the large and medium-sized purse seine fisheries regarding the capture of small-sized fish have not significantly contributed to increasing the spawning biomass. Therefore, the increase in spawning biomass after 2010 cannot be attributed to the effects of fishing regulations.
The two phenomena mentioned above—(1) the spawning biomass increasing after 1982, even though fishing pressure remained high and the absence of fishing regulations, and (2) the spawning biomass increasing after 2010, despite high fishing pressure and the absence of fishing regulations—pose a challenge to the MSY theory. How can these phenomena be explained based on the MSY theory? If these phenomena cannot be explained by MSY theory, then the scientific validity of using MSY-based fishing regulations must be questioned.
We believe that “it is impossible to explain these phenomena under the MSY theory, and that the occurrence of such phenomena itself is an 'inconvenient truth' that demonstrates the MSY theory is flawed.” I would like to ask the WCPFC to present reasons or evidence for why they continue to believe that the MSY theory is not incorrect.
(10) Isn’t the fact that “stock-recruitment relationship are unclear” also evidence that the MSY theory is flawed?
Figure 14 is a stock-recruitment relationship for Pacific bluefin tuna published by the Fisheries Agency [1]. In this document, the Fisheries Agency states that "there is no clear correlation between spawning biomass and recruitment (number of offspring)."
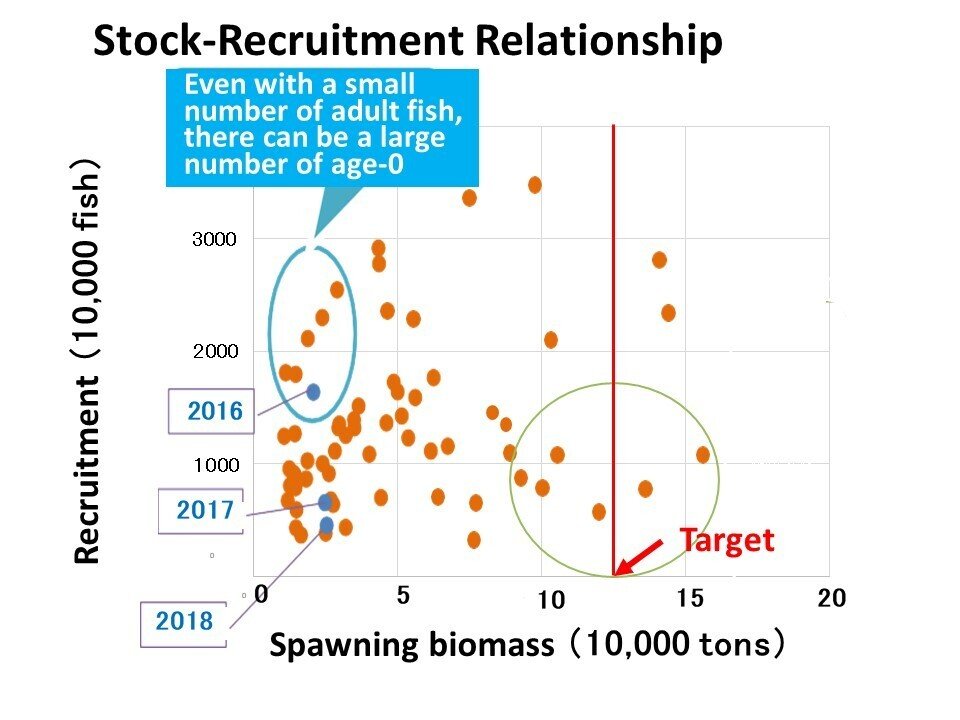
Despite the fact that "there is no clear correlation between spawning biomass and recruitment," the WCPFC advocates for setting spawning biomass at a certain level and imposes fishing regulations to achieve this. Could you explain the scientific justification for this?
Additionally, "there is no clear correlation between spawning biomass and recruitment." Does WCPFC believes that, as data accumulates in the future, a clear correlation between spawning biomass and recruitment will emerge? I would like to hear their interpretation on this matter.
We predict that 50 or 100 years from now, and for the foreseeable future, there will never be a clear correlation between spawning biomass and recruitment. The reason is simple: it is unimaginable that the scattered points shown in Figure 14, which appear to have no correlation, could ever be explained solely by spawning biomass. The lack of a clear correlation between spawning biomass and recruitment is also an "inconvenient truth" that demonstrates the MSY theory is flawed. We would like to hear the WCPFC's perspective on this.
(11) How can management targets be determined when the stock-recruitment relationship are unclear?
Related to the previous point, despite the fact that "there is no clear correlation between spawning biomass and recruitment," could you provide the scientific justification for setting B0 spawning biomass at 20% (124,000 tons) as a management target? Why is 10% B0 spawning biomass (62,000 tons) not sufficient, or 5% B0 spawning biomass (31,000 tons), or any other percentage? Figure 14 does not make it clear why 20% of B0 spawning biomass (124,000 tons) is the target.
(12) Is B0 spawning biomass the same as the initial resource level?
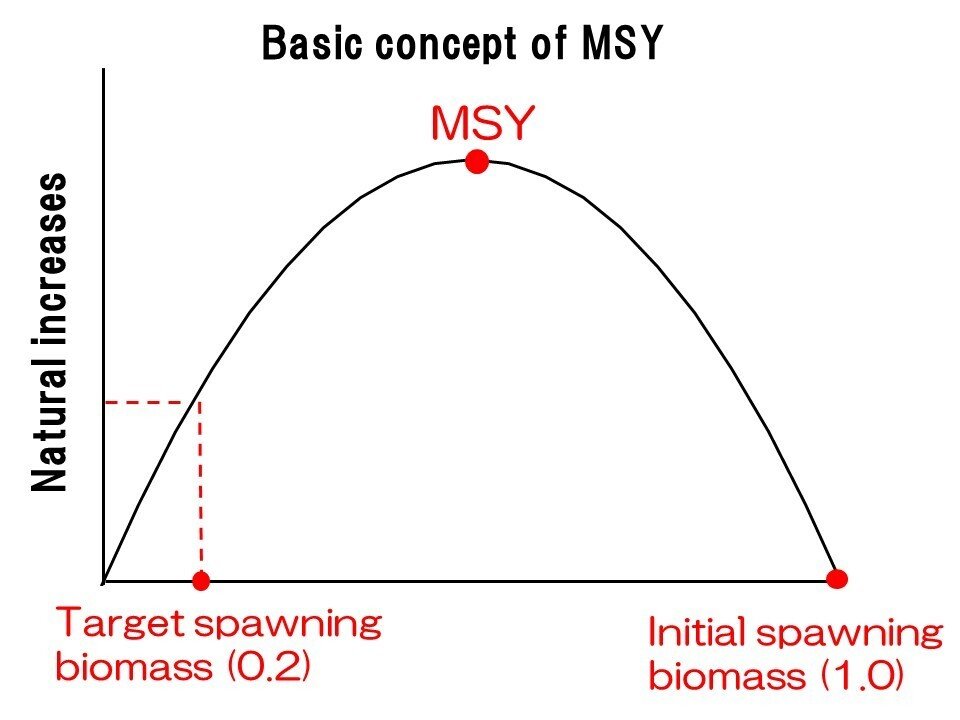
The initial resource level defined by the MSY theory and B0 spawning biomass are entirely different concepts. The initial resource level under MSY theory is defined by the surplus production model, as shown in Figure 15, where the surplus production reaches zero. This implies that the surplus production can only reach zero if density-dependent effects are assumed. However, B0 spawning biomass is the level of spawning biomass in the absence of fishing, and no density-dependent effects are included in this figure. Thus, B0 spawning biomass and the initial resource level defined by MSY theory are derived from completely different concepts. Therefore, we believe it is scientifically unjustifiable to consider B0 spawning biomass as the initial resource level, and we would like to hear the WCPFC's interpretation on this matter.
(13) Are you aware of any studies that have replicated the stock-recruitment relationship of Pacific bluefin tuna?
Figure 16 presents a reproduction of the stock-recruitment relationship of Pacific bluefin tuna using a resource fluctuation theory different from MSY [5 and 6].
The black line represents the data, the red line shows the reproduced results, and the numbers within the figure indicate the corresponding years. Additionally, the circles highlight notable years to facilitate comparison.
Figure 16 demonstrates that the stock-recruitment relationship of Pacific bluefin tuna is not unknown, and reproduction at this level is possible. If the reproductive relationship can be understood, simulations such as those in (7) can be performed. With these simulations, a more detailed examination of the effectiveness of fishing regulations becomes possible.
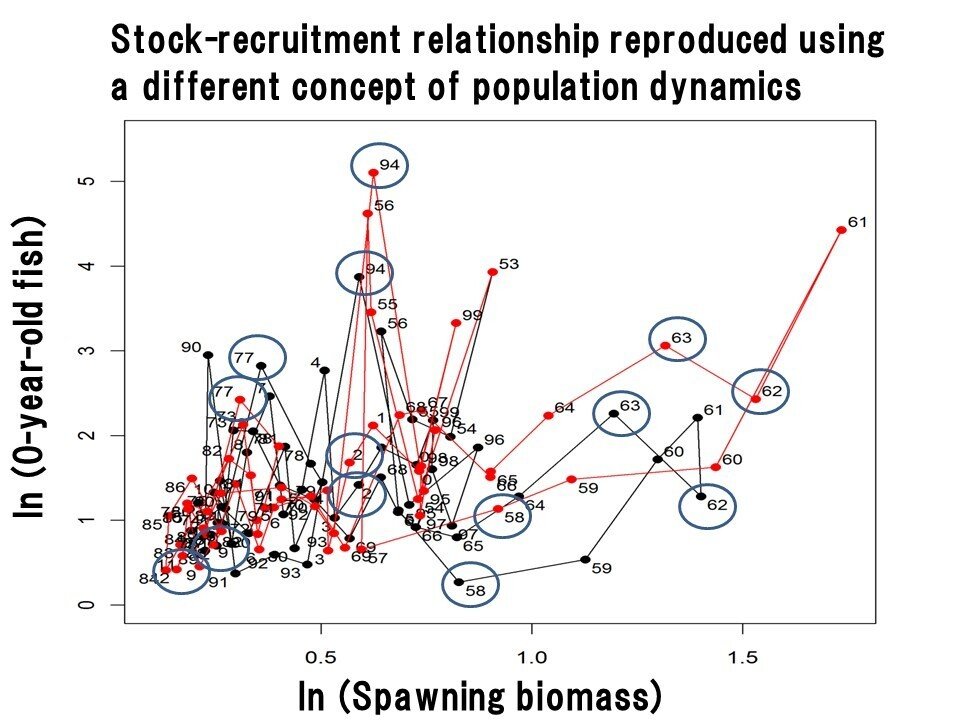
Therefore, we believe the WCPFC should attempt such reproduction efforts to undertake similar efforts. Do you not intend to take such measures? If not, could you explain the reason why such an examination is not being pursued?
(14) Why is resource analysis that incorporates environmental factors not conducted?
Figure 17 uses a resource fluctuation theory different from MSY to replicate the recruitment per spawning biomass of Pacific bluefin tuna [5, 6]. The recruitment per spawning biomass refers to the number of 0-year-old fish (juveniles) per ton of spawning biomass. The red line in Figure 17 shows the result of a simulation, while the black line represents the data from ISC's report, which calculates the recruitment per spawning biomass based on spawning biomass and the number of 0-year-olds. By the way, the WCPFC does not calculate the recruitment success rate, nor is it analyzed.
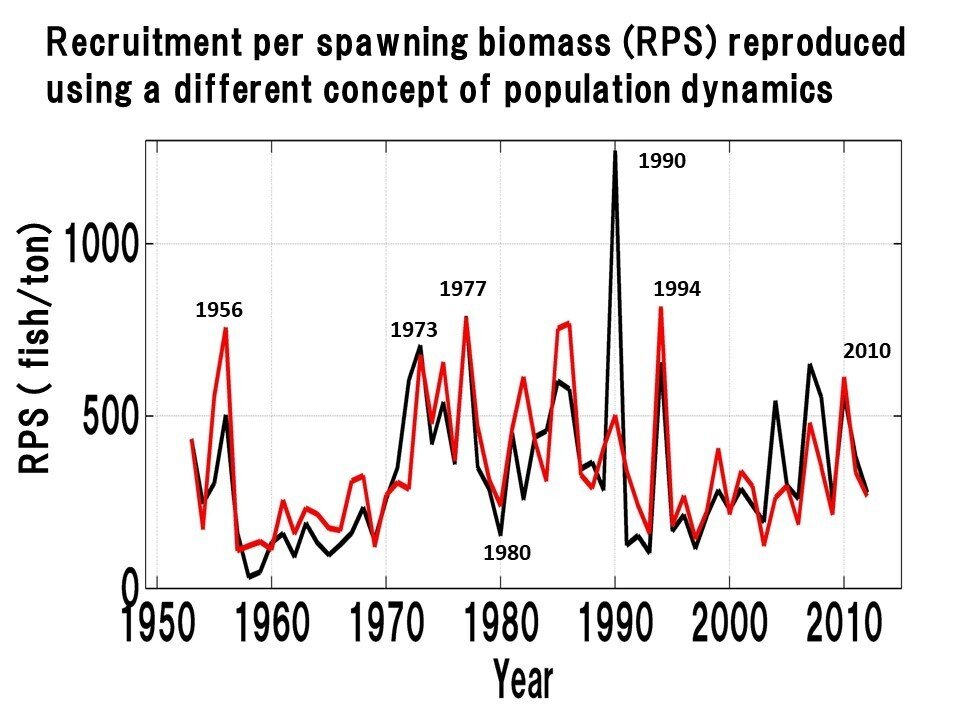
The recruitment per spawning biomass fluctuates significantly from year to year, with some years like 1990 showing major deviations. However, in most other years, the fluctuations in the peaks and troughs align quite well. If the recruitment per spawning biomass can be partially explained by environmental factors, then multiplying the recruitment per spawning biomass by the spawning biomass would allow for the calculation of the number of 0-year-old fish, and as shown in Figure 16, the reproduction relationship can also be replicated.
(14) Why does the WCPFC not conduct resource analysis incorporating environmental factors?
The simulation shown in (7) should be conducted by the WCPFC to examine the effects of various fishing regulations. However, for such an analysis, the recruitment per spawning biomass must be analyzed, and to do that, the incorporation of environmental factors is indispensable. Why does the WCPFC not conduct analysis on the recruitment per spawning biomass incorporating environmental factors? We would like to hear your reasons.
(15) Request for Data Publication
To carry out the simulation shown in (7), we need various data such as age-specific catch numbers, age-specific fishing mortalitycoefficients, and other data. When the simulation was conducted in 2015, the WCPFC report included age-specific catch numbers, age-specific fishing mortality coefficients and other data up to 2012. The data obtained at that time was used to create Figures 2-4 (therefore, the numbers may differ slightly from the most recent values, but please bear with us on that point). However, in recent years, such detailed data has not been published in WCPFC reports.
Although data can be obtained by requesting it from the WCPFC Secretariat (in practice, from the Fisheries Research and Education Agency of Japan), it is updated every two years. Therefore, to use the most recent data, one has to request it from the Fisheries Research and Education Agency every two years. However, it is quite difficult to frequently ask the Fisheries Research and Education Agency for data, especially when, even unintentionally, the analysis results end up criticizing the Fisheries Agency, which makes one feel apologetic and hesitant to make such requests.
We sincerely hope that the following data be made publicly available in EXCEL format on the WCPFC's website or WCPFC reports, so that we can access it freely. We would like to hear your views on this request for data publication.
Requested data:
Age-specific stock numbers
Age-specific spawning biomass numbers
Age-specific catch numbers
Age-specific fishing morttality coefficients
Age-specific maturation rates
Age-specific weights
(16) Summary of the Analysis Results
Summarizing the results of the above analysis, the following conclusions can be drawn:
In 1982, spawning biomass fell to its lowest point at 11,000 tons, but despite this, without any specific fishing regulations, the biomass began to increase after 1982 and reached 79,269 tons by 1995.
Similarly, in 2010, the spawning biomass dropped to a near-record low of 12,275 tons, but despite this, without any fishing regulations, the biomass began to increase again after 2010, continuing to increase at a similar or faster pace than after 1982 until the fishing regulations were introduced in 2015 (Figure 12).
This does not mean that the fishing regulations introduced in 2015 were unnecessary, but it raises the question of whether such a strict reduction in fishing quotas was really needed. The Pacific bluefin tuna resource reportedly reached the recovery target of 20% B0 (initial biomass) 13 years earlier than planned [7], but it seems hard to believe that such a significant sacrifice was necessary just to reach the target 13 years early.
At the same time, the fact that the recovery target was reached 13 years earlier also indicates that the future projections made by the WCPFC simulations were completely off the mark.
Thus, the answer to the question (1): Was such a severe reduction in fishing necessary? is that there was no need for such drastic reductions. If milder fishing regulations had been applied, such as reducing the recent years' fishing mortality coefficients by 10% to 20%, resource recovery would have been fully expected. Of course, even in this case, it goes without saying that simulations and checks would be necessary in advance to verify the effectiveness of such measures.
Why, then, did we end up reducing the average catch of small fish by 50%, based on the average catch during the fishing "trough" of 2002-2004? Was there sufficient simulation or analysis conducted to assess the effects of reducing the average catch of small fish by 50%? The WCPFC's future predictions based on simulations were drastically wrong and ineffective. Was there really any scientific basis for reducing the average catch of small fish by 50%? These questions leave major doubts about the scientific legitimacy of the measures.
Although the WCPFC has conducted simulations, they seem to be simply adjusting values randomly based on the MSY theory and predicting future outcomes. They appear to treat random fluctuations as a way to incorporate environmental variations, but no matter how many times such simulations are run, whether 10,000 or 100,000 times, they only increase the range of variability, offering no meaningful results. Even if these simulations claim "there is a XX% probability of exceeding the target value by a certain year," they are based on random environmental variations and are unlikely to be accurate.
Since it has been 10 years since fishing regulations began in 2015, and the recovery target was achieved 13 years earlier, this means that the original forecast by the WCPFC simulations expected the target to be reached in 23 years. However, in reality, the target was achieved in less than half that time, showing that the WCPFC's projections were completely off. Why was there such a large discrepancy? It can only be explained by the fact that the simulations were based on the wrong resource fluctuation theory - MSY theory.
Based on the above, the answer to questions (2): Was there sufficient scientific basis for implementing such strict reductions in catch limits? is that there was not sufficient scientific evidence to justify enforcing strict reductions in catch limits. As discussed previously, the evidence of errors in the MSY theory is clear from the inconvenient truths about spawning biomass fluctuations, the unknown stock-recruitment relationship, and the inaccurate future predictions made by simulations.
Therefore, the answer to the next question (3): Is the resource management theory that forms the basis of this management correct? is that the resource management theory underpinning this policy is incorrect and completely ineffective for resource management. Unless there is a shift to a new theory of resource dynamics, it will be impossible to implement scientific management effectively.
As mentioned earlier, the choice of the baseline years from 2002 to 2004, which favored purse seine fishing, the imposition of a 50% reduction in small fish catches alone, and the actual reductions, which were as high as 64% to 85% (as shown in Table 1), indicate that: the answer to questions (4): Was there a prioritization of large-scale fisheries and neglect of small-scale coastal fisheries? is that there was a clear prioritization of large-scale fisheries while neglecting small-scale coastal fisheries.
Although it is difficult to determine the exact number of Pacific bluefin tuna released from set nets, there is a valuable study conducted by the Kyoto Prefecture Fisheries Technology Center [3], which provides some insights. Part of the study shows that the final allocation for small fish in the fiscal year 2021 was 10.8 times the TAC of 68.4 tons for Kyoto Prefecture (compared to 44.7 times the initial allocation of 16.5 tons), and for large fish, it was 3.2 times the TAC of 41.5 tons (compared to 6.1 times the initial allocation of 21.9 tons).
It is also said that a significant percentage of the released tuna ended up dying. It is clear that a substantial amount of resources were wasted. Not only was the tuna resource itself wasted, but the labor and time spent on the release efforts, the loss of other catchable fish, the inability of distributors to handle tuna that would have otherwise been circulated, and the impact on consumers all resulted in significant waste for numerous stakeholders. This inconsistency—reaching the management target 13 years earlier while incurring such waste—illustrates the ineffectiveness of the fishing regulations.
Therefore, the answer to the question (5): Did excessive reductions in catch limits result in inefficient use of resources? is that yes, the excessive and scientifically unjustified reductions in catch limits led to highly inefficient resource use.
From (1) to (15), the questions circle back to the key point: we seek the WCPFC's views on the conclusions drawn in (16).
Acknowledgments
I would like to express my sincere gratitude to Dr. Akira Nihira, Secretary General of the JCFU Japan Coastal Fishermen's Union, for providing the opportunity to write this article and for offering valuable advice. I also thank the members of the JCFU for the fruitful exchange of information during symposia. Additionally, I would like to extend my thanks to Mr. Yasuji Tamaki, Executive Director of the Japan Set-net Fisheries Association, for introducing useful materials while writing this article.
References
Fisheries Agency. Resource Management of Pacific Bluefin Tuna (Document 12). September 2024. (in Japanese).
WCPFC. Assessment of Pacific Bluefin Tuna in the Pacific Ocean in 2024. WCPFC-SC20-2024/SA-WP08, 2024.
Noguchi, S., Kinoshita, N., Funakoshi, H., Iwao, A.. Tracking Pacific Bluefin Tuna with Real-Time Operations Logbook in Set Nets. Teichi, No. 145, 2024. (in Japanese).
Fisheries Agency. Explanation Meeting on the Status of Pacific Bluefin Tuna Resources for WCPFC Northern Committee. Fisheries Research and Education Organization, Wide-Area Resource Division. 2024. (in Japanese).
Sakuramoto, K., The Problems of New Fisheries Resource Management: A New Resource Fluctuation Theory Beyond MSY. Design Egg Co., Ltd., 2020, 276pp. (in Japanese).
Sakuramoto, K. Case Study: A Simulation Model of the Spawning Stock Biomass of Pacific Bluefin Tuna and Evaluation of Fisheries Regulations. American Journal of Climate Change, 5, 245-260, 2016.
WWF Japan. WCPFC Northern Committee Meeting 2024 concludes: Pacific Bluefin Tuna Resources Reach Safe Levels. Nature Positive Positive Example, September 3, 2024. (in Japanese).
