
Wyckoff 2.0: Structures, Volume Profile and Order Flow
Rubén Villahermosa Chaves
Wyckoff 2.0: Structures, Volume Profile and Order Flow
Combining the logic of the Wyckoff Methodology and the objectivity of the Volume Profile (2021)
Regardless of how markets and their traders have changed, everything is still governed by the universal law of supply and demand.
If Richard Wyckoff were alive today, he himself would have taken care to evolve his own teachings to adapt to new markets. As he was at the time, he would have remained a student of volume and this would have led him to delve deeper into tools such as the Volume Profile.
By the very nature of the market, it is practically impossible for any two structures to be completely the same.
The important thing about the methodology is the logic behind it: that for the price to go up there must first be an accumulation; and for it to go down there must be a distribution.
Theory and practice in real time often do not go hand in hand and it is necessary to have a sufficiently open mind.
Theory is all very well for generalizing events, but real time trading and analysis will require a much more open mind.
Once the trader reaches a certain degree of understanding of the methodology, he should focus on seeing the market in terms of price dynamics and not in terms of labels.
The market does not care how many lines you have drawn on the chart, nor if they are of greater or lesser thickness or color. It is not recommended to buy or sell simply because the price has touched a certain line.
As market control may change during the development of a structure, we need to make a continuous assessment of price action and volume as new information is coming into the market and being displayed on the chart.
The present moment is the most important thing, and the second most important thing is what immediately precedes it.
The reality is that the market is not static and that every moment is unique where new data keeps coming in uninterruptedly.
What is important is what the movement suggests to us and it is determined by the action that follows it.
It is also important to keep in mind that we can only pose solid scenarios on the next move and never beyond. Based on what the price has been doing, we will give probability that a certain move will develop later.
When we pose a scenario we always speak in conditional terms using the word "potential" as there is no certainty about anything.
The market is an environment of total uncertainty and our focus should be on analyzing the traces we are observing up to the present moment as objectively as possible.
The most important thing when analyzing a chart is the present, what the price is doing right now in relation to what it has been doing. And the second most important thing is the immediate prior to the present.
And herein lies one of the advantages of the Wyckoff methodology, in the fact that it provides us with a clear roadmap, a context on which to wait for price movements. When the price is in a position of potential bearish shock (Spring) and our analysis confirms it, we will wait for the subsequent bullish breakout move. And when this develops in the way and form that we expect (with increasing price and volume), we will be able to pose the next pullback move to the level of the broken structure. And when we are in such a BUEC position, we will be able to evaluate to raise the subsequent trend movement out of the range.
This is the dynamic, it is not a question of inventing anything but simply to follow and evaluate in real time the price action and the volume in order to propose the most probable next move.

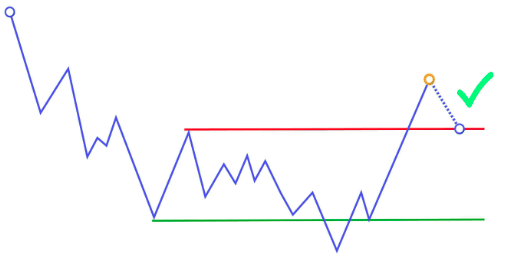

❖ Accumulation processes will be accompanied by a decreasing volume during the development of the structure.
❖ In distribution processes, high or unusual volumes can be identified during the development of the range.

Weis Wave
The Weis Wave indicator collects and analyzes volume data to graphically represent the accumulation of transactions made by price movements. In other words, depending on the configuration we assign to it, the first thing the code does is to identify the start and end points of a price movement. Once this is determined, it adds up all the volume traded during the development of that movement and represents it in the form of waves.
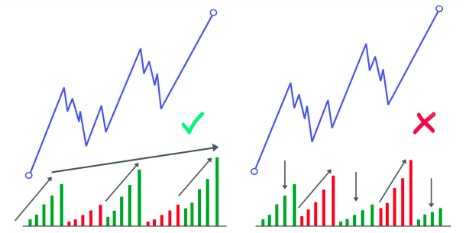
As can be seen in the graph, all waves start from a base set at 0 (the same as the classic vertical volume). This tool is basically used to perform analysis under the Law of Effort and Result. When developing such analysis we can approach it in different ways:
❖ In the development of movements. The basic rule when looking for harmony and divergence is that the movements that we initially treat of impulsive character should be accompanied by big waves, increasing waves with respect to the previous ones, which would suggest an increase of interest in the direction of that movement. On the other hand, corrective movements should be shown with small and decreasing waves in comparative terms, suggesting a certain lack of interest in that direction.

❖ Upon reaching trading zones. Similarly, a harmony analysis would be obtained by identifying a large bullish wave whose price movement manages to break a resistance zone. The reading we make is that this movement of impulsive character has achieved the effective break. With respect to an analysis that would suggest divergence would be to visualize the same bullish move that breaks a previous resistance but does so with a very small Weis wave, denoting that very little volume has been traded and therefore suggesting that the large professional is not supporting the move.

We must again be mindful of the importance of continuous analysis. We may see a potential Spring which is followed by a bullish move accompanied by a large Weis wave that manages to break the Creek of the structure (so much for the ideal scenario). At that point we will be favoring bullish continuation (potential BUEC); but strong volume may come in and push the price back into the range and a large bearish wave is observed, now suggesting the possibility of potential Upthrust.

The idea is that just because we see that the footprints are in favor of the initial approach it does not necessarily have to develop. As previously discussed, new information is continually entering the market and we must be aware of this. In the example above, in a potential BUEC situation, we will need to see bearish waves that denote lack of interest in order to more confidently propose a bullish scenario.
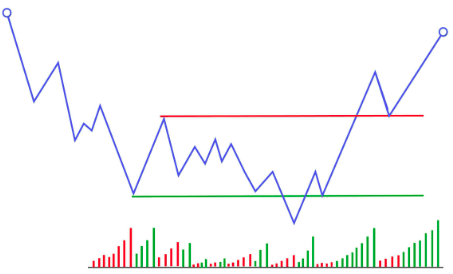
The first thing that should be made clear is that a chart, the cleaner the better. It is no use having a hundred thousand objects drawn on it. The only thing we get with this is to hide the information that is really important: the price.
In this type of analysis where what we seek is to understand what the context of the market is, it is essential to start the analysis from higher time frames to go down in time from there.
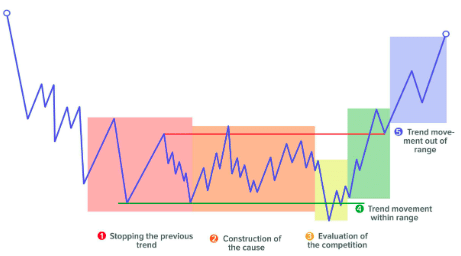
Once the chart is open, the first thing we are going to look for are the stop events of any trend movement and the subsequent sideways movement of the price. Operationally what we are interested in is to see that the market is building the cause of the subsequent move; that is, that it is in Phase B.
Obviously on many occasions you will open the chart of an asset and see absolutely nothing clear, or it may still be in the development of a trend movement that has been preceded by an equilibrium range. In these cases there is nothing to do but wait to see that change in character that determines the appearance of Phase A.
At other times you will identify those stop events plus the generation of some cause in Phase B and the market may find itself in a potential breakout/shakeout situation. This is the ideal context to move down the time frame.
It is a matter of identifying in this higher time frame the general context to determine which scenario would be more interesting to work on, whether to propose a long or short entry. In short, effectively positioning ourselves on the longer-term chart helps us to bias the directionality of our future scenarios. Until we are clear about the context of the upper chart, we will not be able to go down in time.
By context we mean the combination of structures and operating zones.
One of the biggest mistakes that some traders make when deciding to trade only one asset is that this leads them to want to control every single price movement, which can be disastrous for the account.
The word, control, may be one of the most damaging words in the world of trading. You can control absolutely nothing. Our focus should be on trading only the clearest setups with the best possible risk/reward ratio.
We keep forgetting that a large part of market movements are random in nature; and this simply means that they do not have a directional intention behind them.
Some of the ranges fluctuate up and down without any intentionality behind them, without constructing any kind of cause. They are those ranges where you see absolutely no clear footprint and you cannot make a judicious analysis of who might be in control of the market.
A Dark Pool is a private market that puts institutional investors in contact and facilitates the exchange of financial assets with the peculiarity that its transactions are not reported immediately, the amount traded (the volume) not being known until 24 hours later.
Trading in non-centralized stock markets in the U.S. is approximately 35%, with Dark Pools accounting for 16 to 18%. And according to a Bloomberg study, overall Dark Pools trading already accounts for over 30% of total trading volume.
The CME (Chicago Mercantile Exchange), which is the market with the largest number of options and futures contracts in the world, also has its own Dark Pool and offers this opaque trading service through what they have called "Block Trades".
A Block Trade is a privately traded futures, options or combinations transaction that is allowed to be executed apart from the public auction market.
These transactions, not being determined by the supply and demand of the public market, do not have an immediate impact on the price formation.
THE ADAPTIVE MARKETS HYPOTHESIS
We therefore conclude that financial markets are composed of a percentage of randomness and another percentage of determinism, without knowing how much weight each has. This theory would be supported by the Adaptive Markets Hypothesis (AMH) which shows the efficiency of financial markets not as a present or absent characteristic, but as a quality that varies according to the market conditions (the environment, context), which are determined by the interactions between its agents.
This hypothesis has been presented by the American financial economist Andrew W. Lo in his book Adaptive Markets published in 2017 and is mainly supported by:
1. The efficiency of the market depends on its conditions. This changing characteristic is the result of participants' interactions which in turn depend on market conditions.
2. The agent is not totally rational and is subject to cognitive biases. A purely rational model cannot be applied since participants form expectations based on different factors. Moreover, different expectations can be created with the same information, not to mention the fact that each agent has different degrees of risk aversion.
The HMA does not focus on discrediting the Efficient Markets Hypothesis, it simply treats it as incomplete. It places more value on changing market conditions (due to the arrival of new information) and how participants may react to them. It focuses on the fact that rationality and irrationality (efficiency and inefficiency) can coexist at the same time in the market depending on the condition.
The reading of the market under the principles of the Wyckoff methodology is based on a deterministic market event: the law of Cause and Effect and for the market to develop an effect (trend) there must first be a cause (accumulation/distribution).
At the beginning of the 20th century, the markets, operated entirely manually, were guided mainly by the cognitive biases of their participants. Emotions such as fear and greed were present and caused a large part of the decisions made by their participants. This irrationality of the individual led to very profitable situations for the well-informed traders of the time.
The vast majority of traded volume is done electronically and huge amounts of volume are moved on a daily basis. In order for all these orders to be filled, it is necessary to highlight the concepts of counterparty, liquidity and order matching; the importance of volume.
AUCTION THEORY
Auction theory was born mainly from the studies by J.P. Steidlmayer on the Market Profile. Subsequently, together with other authors such as James Dalton and Donald L. Jones, he defined a series of concepts that constitute this theory.
It is based on the fact that the market, with the priority objective of facilitating negotiation among its participants and under the principles of the law of supply and demand, will always move in search of efficiency, also known as equilibrium or fair value.
Efficiency means that buyers and sellers are comfortable negotiating and neither has clear control. That comfort comes because, based on current market conditions, the valuations of both are very similar. The way this equilibrium is visually observed on a price chart is with a continuous rotation (price ranges). This price lateralization represents this equilibrium. It is evidence of the facilitation of trading and is the state in which the market is always looking to be.
On the other hand, we have the moments of inefficiency or imbalance and these are represented in the trend movements. When new information reaches the market, it can cause the value perceived by both buyers and sellers of the asset to change, generating a disagreement between them. One of the two will take control and move the price away from the previous equilibrium zone, offering a profitable trading opportunity. What is evident in this context is that the market is not facilitating trading and is therefore considered an inefficient condition.
The market will be constantly moving in search and confirmation of value; in situations where buyers and sellers are in a position to exchange stock. When this happens it is because the valuations that these participants have on the price are very similar. At that moment the negotiation will again generate a new equilibrium zone. This cycle will repeat itself over and over again in an uninterrupted manner.
The general idea is that the market will move from one equilibrium area to another through trend movements and that these will be initiated when the market sentiment of both buyers and sellers about the current value differs causing the imbalance. The market will now begin the search for the next area that generates consensus among the majority of participants about the security.
It should be noted that the market spends most of its time during periods of equilibrium, which is logical due to the nature of the market based on avoring negotiation among its participants. This is where the accumulation and distribution processes take place, which as we all know is where the Wyckoff methodology focuse.

In the auction mechanism price is used as a discovery tool. The facilitation of trading is carried out by price movement, which fluctuates up and down exploring different levels with the objective of seeing how participants react to such exploration.
The price will spend very little time in those zones that are advantageous to one of the two sides (buyers or sellers).
A zone of efficiency or equilibrium will be characterized by a higher consumption of time; while a zone of inefficiency or imbalance will be represented by a short consumption of time.
Volume represents the activity, the amount of an asset that has been exchanged. This quantity suggests the interest or disinterest at certain level.
Price + Time + Volume = Value
Through price the market discovers new levels, time consumption suggests that there is some acceptance in that new area and finally volume generation confirms that participants have created a new value zone where they trade comfortably.
The market is constantly rotating between two phases: horizontal development (equilibrium) or vertical development (imbalance). Horizontal development suggests agreement among participants while vertical development is a market in search of value, in search of participants to negotiate with.
It is important to emphasize that this auction theory is universal and can therefore be used to evaluate any type of financial market, regardless of the time frame used.

The Four Phases of Steidlmayer:
1. Trend phase. Vertical development, price in imbalance in favor of one direction.
2. Stopping phase. Traders begin to appear in the opposite direction and the stop of the previous trend movement occurs. The limits of the upper and lower range are established.
3. Lateralization phase. Horizontal development. Trading around the stop price and within the limits of the new equilibrium range.
4. Transition phase. The price leaves the range and a new imbalance begins in search of value. This movement may be a reversal or a continuation of the previous trend movement.

Once the transition phase is over, the market is in a position to start a new cycle. This protocol will run uninterrupted and is observable in all time frames.
Visually up to step three a P or b-shaped profile would be observed.
It is essentially exactly the development from Phase A to Phase E proposed by the Wyckoff methodology:
1. Stop the previous trend
2. Build the cause
3. Assess the opposition
4. Initiate the trend movement
5. Confirm directionality

Error No. 1: Prices rise because there are more buyers than sellers or fall because there are more sellers than buyers.
In the market there are always the same number of buyers and
sellers; since for someone to buy, there must be someone to sell to him.
The key lies in the attitude (aggressive or passive) that traders take when participating in the market.
Error No. 2: Prices go up because there is more demand than supply or they go down because there is more supply than demand.
Supply and Demand are the limit orders that both buyers and sellers place in the BID and ASK columns pending execution, which is known as liquidity.
The BID column is the part of the order book where buyers come to place their bid (limit buy orders) and where sellers come to match their ask orders.
The highest price level within the BID column is known as the Best BID and represents the best price at which to sell.
The ASK column is the part of the order book where sellers go to place their pending sell (bid) orders and where buyers go to find the counterpart for their purchases. The lowest price level within the ASK column is known as the Best ASK and represents the best price at which to buy.

The difference between the BID and the ASK is called the Spread. The lower the Spread, the more liquid it is.
Liquidity is the amount of volume that an asset trades.
❖ Aggressive Participants
Liquidity takers through the use of "at market" orders. They have urgency to enter and attack the Best BID and Best ASK where the limit orders remain located. This type of aggressive orders is the real engine of the market since they are the ones that initiate the transactions.
❖ Passive Participants
Liquidity creators through the use of "limit" orders. Sellers create supply by leaving their orders pending execution in the ASK column; and buyers create demand by leaving their orders placed in the BID column.

It takes the aggressive participation of traders to produce a change in price. Passive orders represent intent in the first instance, and if executed they have the ability to stop a move, but not the ability to make the price move.
INITIATIVE
For the price to move upwards, buyers have to buy all the sell (bid) orders that are available at that price level and also continue to buy aggressively to force the price up one level to find new sellers to trade with.
Passive buy orders cause the downward movement to slow down, but by themselves cannot drive the price up. The only orders that have the ability to move the price upwards are buy-to-market orders or those whose crossing orders become buy-to-market orders (such as stop losses on short positions).
For the price to move downward, sellers have to acquire all the buy (demand) orders that are available at that price level and continue to push downward forcing the price to go in search of buyers at lower levels.
Passive sell orders cause the upward movement to slow down, but
do not have the ability to drive the price down on their own. The only orders that have the ability to move the price downward are market sells or those whose crossing orders become market sells (Stop Loss of long positions).

EXHAUSTION
The lack of interest from the opposite side can facilitate this task. An absence of supply can facilitate the price rise just as an absence of demand can facilitate its fall.
As supply withdraws, this lack of interest will be represented as fewer contracts placed in the ASK column and therefore the price can more easily move upward with very little buying power.
Conversely, if it is demand that withdraws, it will be visualized with a reduction in the contracts that buyers have placed in the BID and this will cause the price to be able to move lower with very little selling initiative.

In order to facilitate trading, the market will go up in search of sellers and down in search of buyers; in other words, it will always move towards the equilibrium point where supply and demand will be equalized.
At the moment of a market turn, we will normally always have a three-step process. To reverse an upward movement, these three will be combined.
1. Exhaustion: the lack of interest (exhaustion) of the buyers to continue buying
2. Absorption: the first entry of sale by the big operators in a passive way
3. Initiative: the aggressiveness of the sellers
Oppositely for the bullish turn example: sellers' exhaustion, passive positioning through absorption of sales and buying initiative with aggression in the ASK.

❖ Analysis of pending orders: Order Book, also called Depth of
Market (DOM)
❖ Analysis of executed orders: Time & Sales and Footprint

We will not know the origin/intention behind a cross order:

The use of Order Flow independently could be totally meaningless since in no case can it offer us what is the most important aspect to determine in the market: the context; knowing exactly where we are going to look for trades and in which direction. Trying to understand this is vital in order to be able to perform solid analysis and scenario planning.
The Volume Profile is a variant of the Market Profile®, a tool designed by J. Peter Steidlmayer in 1985 for the Chicago Board of Trade (CBOT®).
Unlike the Order Flow analysis, the Volume Profile is totally objective as it does not require any interpretation and therefore provides us with very useful information for our analysis and scenario approaches.
The Volume Profile is not an indicator. It is simply another way of representing volume data. It identifies very clearly and precisely the number of contracts traded at different price levels.
Volume Profile
The Volume Profile uses the principles of auction theory to put it into practice and to visualize the areas of interest on the chart. Interest is simply measured by the activity that has been generated in a particular zone; and this activity is identified by the volume traded.
Keep in mind that the market's memory is primarily short term. This means that more recent trading zones are more important than older ones. If the price initiates an imbalance, the first zone to be taken into account will be the most immediate previous balance zone. The longer the price has been away from a certain acceptance area, the less significant it will be.
A wide Value Area suggests that there is a large participation of all traders, everyone is buying and selling at the prices they want; while a narrow Value Area is a sign of low activity.
Finished auction
It is visually observed with a decreasing negotiation towards the end. It represents a lack of interest as the price reaches price levels further away from the value zone, finally suggesting a clear rejection of the market to trade in that zone. By its very nature it is a Low Volume Node.
Prices have reached a point where some traders have considered it as an advantageous opportunity and have entered causing this rejection. The lack of participation from the opposite side is represented by this decrease in volume.
Unfinished Auction
It appears as a High Volume Node on the end of the profile. Implicitly it represents interest to negotiate in this zone and therefore suggests a later visit of the price in case it has previously moved away from it. In the future visit it will be necessary to evaluate the intention behind it since it could develop with the objective of finishing the auction and turning around, or with the objective of continuing trading and continuing in that direction.
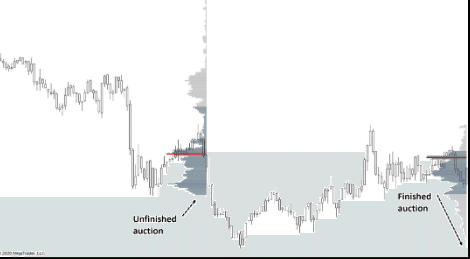
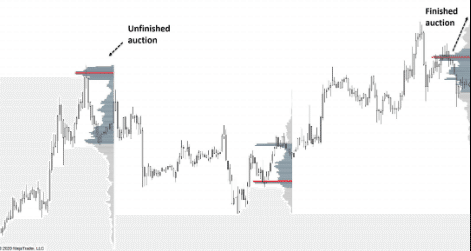
In Market Profile this concept is totally objective: an unfinished auction (Poor High & Poor Low) appears at one end where at least two TPOs are observed; in other words, a finished auction will be represented with a single TPO at the price level (Single Print).
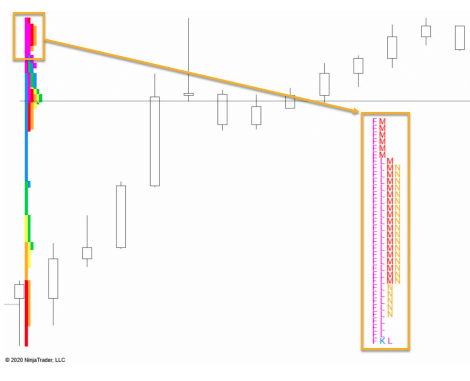
If we are assessing the possibility of the price leaving an equilibrium zone upwards, we will want to see that at the bottom of that zone there is a finished auction that would suggest a lack of interest in trading there. In case of observing a possible unfinished auction it would be convenient to quarantine the scenario since it is most likely that before starting the upward movement there will be a visit of the price in that low part with the objective of testing the interest in that zone.
When in doubt as to whether we are in a possible finished or unfinished auction, it is advisable to treat it as finished. Unfinished auctions should be very visual and should not be involved in much subjectivity. Generally we are going to observe them as an abnormal cut in the distribution of the profile and in many occasions it will coincide with one of the two limits of Value Area.
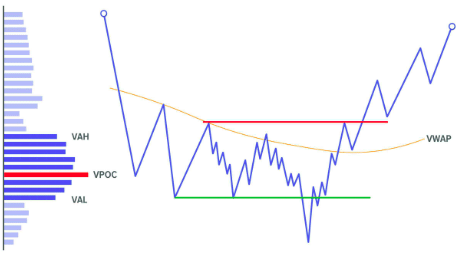
The POC allows us to establish who is in control of the market. If the price is above it, we will determine that the buyers will be in control, so it would make more sense to trade long; if it is below it, the sellers will be in control, so trading short would be a better option.
Above the VWAP there is the same volume traded as below it, i.e. it represents an important equilibrium level. This equilibrium means that when the price reaches the VWAP there is the same probability that the price will go up or down.
HIGH VOLUME NODES (HVN)
These are zones that represent balance and high level of interest by all market participants as both buyers and sellers have been comfortable trading there.
Past balance zones act as magnets attracting the price and keeping it there. As in the past there was some consensus between buyers and sellers, in the future exactly the same is expected to happen. That is why they are very interesting areas for target setting.
LOW VOLUME NODES (LVN)
These are areas that represent imbalance/rejection. Neither buyers nor sellers have been comfortable trading and therefore are considered in some way "unfair" prices.
As in the past there was no consensus, it is expected that in the future there will be no consensus either and cause some rejection, so they are interesting areas of support and resistance where to look for potential entries.
Rejection can be represented by the price in two ways:
V-TURN
Visually it may be observed in the price as prominent wicks at the ends of the candlesticks which will suggest such rejection.
RAPID MOVEMENT
Visually, it will be observed on the chart with wide range candlesticks generally accompanied with high volume.
PROFILES SHAPES
It is not possible to consistently predict what type of day we are most likely to have based solely on the previous day's categorization. Unsurprisingly, it is impossible to know what shape the current session profile will have until the session has ended.
It would therefore seem more sensible, for the purpose of setting up trading scenarios, to focus on identifying the creation of a value zone (range) and to evaluate the price continuously as it interacts at its extremes in order to identify acceptance or rejection.
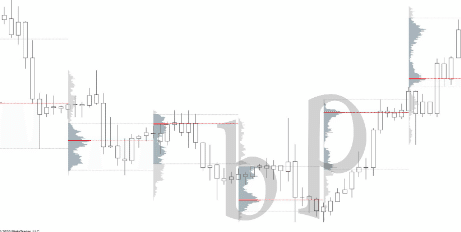
The b and P patterns represent the first three phases of Steidlmayer and Phases A and B of Wyckoff methodology.

P-SHAPE PROFILE
This type of profile suggests strength on the part of buyers who have had the ability to push the price up with relative ease until it reaches a point where sellers begin to appear.
In case this type of profile appears after a prolonged downtrend, it could alert us to the imminent end of the downtrend at least temporarily.
b-SHAPE PROFILE
This type of profile signals an imbalance in favor of sellers. Sellers are in control and have pushed the price strongly downwards until finally some participants appear buying and a new rotation process is generated.
In case of observing a b-shaped profile after a prolonged bullish movement, it could signal the end of such movement and sometimes the beginning of a new one towards the bearish side.
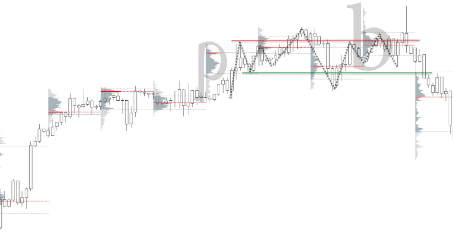
❖ A bearish turn with pattern Pb is nothing more than a distribution that will have a greater or lesser duration which has been confirmed with the generation of value in b and it is possible that lower prices will follow.
❖ A bullish turn with bP pattern tacitly is an accumulation whose change in the perception of value possibly gives rise to higher prices.
The scope of the profile should include all the price action from the time the rotation starts until just before the imbalance occurs.
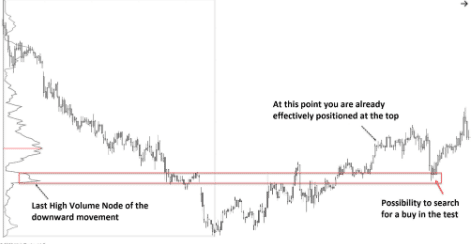
We will always favor trading in the direction of the last high trading node generated. And a scenario against this direction would only arise when the price has broken the zone that supported the last move.
If the price is above a high volume node (HVN) we will determine that the control is in the hands of the buyers and we will only raise a short scenario when the price crosses this zone from below, which will suggest that the control has changed in favor of the sellers.
The logic is that at these nodes the price returns to a state of
equilibrium and we will not be able to determine in which direction it will
move subsequently. Only after confirming the effective breakout of this
zone would we be in a position to propose a scenario with some robustness.

❖ Entry
The VWAP, VPOC and high and low zones of the value area (VAH and VAL) will be extremely useful for us to wait on them the development of our market entry trigger.
❖ Stop Loss
For the establishment of the stop loss we want to identify areas where there has been a previous rejection; and these are the areas of low trading or Low Volume Nodes. It is an excellent area to place our stop protection. In addition to the LVN.
❖ Take Profit
High volume nodes (HVN) produce certain magnetism in the price and therefore are excellent areas for the location of targets.
TRADING RANGE
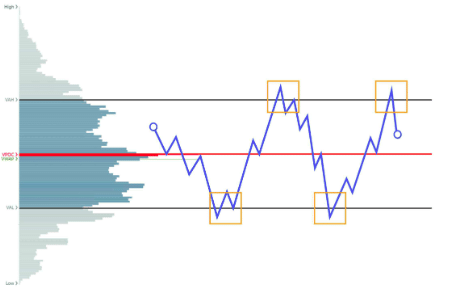
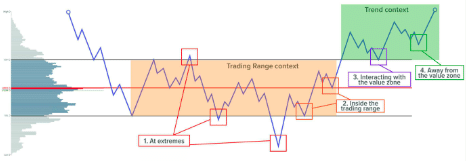
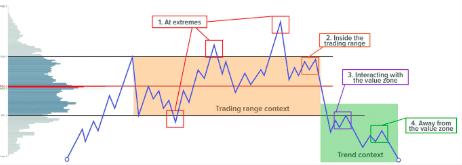
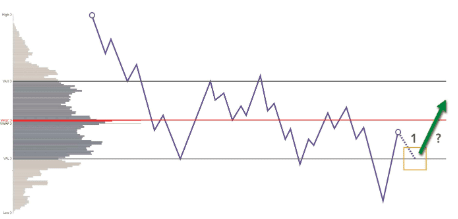
If the price is within a value area, as long as the market condition does not change the market is likely to continue to generate value around the center point so the price will most likely be rejected when the extremes are reached. Buy low and sell high.
The minimum target for this reversal at extremes is a test to the control zone (VPOC), with the most ambitious target being a move that completely traverses the value area and reaches the opposite extreme.
REVERSION
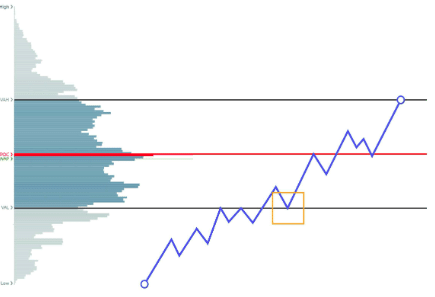
If price attempts to enter a value area and succeeds, it will most likely go to visit the opposite end of that value area. The market has refused to trade at those price levels so it returns to the previous value area. Adaptation of Market Profile's 80% rule.

CONTINUATION
If the price tries to enter a value area and fails to do so by being rejected at the VA end or elsewhere, it will most likely initiate an imbalance in favor of that direction.
This is the test trade after a breakout. Price leaves a value zone and generates acceptance. This acceptance puts the direction in favor of the previous breakout as the most probable direction.
It should be noted that the price can come from outside that value area or from inside. The operating logic would be exactly the same.


FAILED REVERSION
If the price tries to enter a value area and succeeds, but is strongly rejected at the VPOC of that range, the reversal trade would be cancelled until further price action is seen.


SUMMARY OF VALUE AREA TRADING


WYCKOFF 2.0
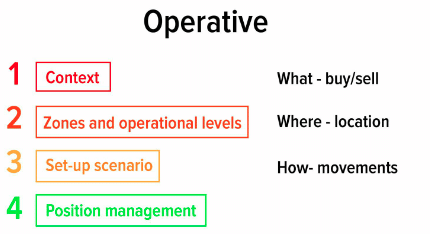
1️⃣ Analysis of the Context (Directional Bias)
◻ Range
In extremes
In the interior
◻ Trend
Interacting with the value zone
Away from the value zone
2️⃣ Identification of Zones and Trading Levels
◻ Trading zones of structures under Wyckoff methodology
◻ Trading zones: HVN and LVN
◻Trading levels: VAH, VAL, POC and VWAP
3️⃣ Scenario Approach
◻ Continuation
◻ Reversal
4️⃣ Position Management


❖ Sign of Strength bar (SOSbar)
Wide range bullish candlestick with close in the upper third and relatively high volume.
❖ Sign of Weakness bar (SOWbar)
Wide range bearish candlestick with close in the lower third and relatively high volume.
For a more intraday trading it can be extremely useful to have identified the Developing Volume Point of Control. These are price levels that were at one point in time the POC for a session, whether or not they were the final POC for that session. As we know, the POC of the session is changing based on the negotiations that take place, and this level represents that footprint of change. In short, what we are dealing with is a level of high trading and therefore most likely to have some magnetic behavior.
Naked POCs are POCs from previous sessions that have not been tested. There are statistics that claim that POCs from previous sessions are tested in the following days with a high probability.

Ruben Villahermosa Chaves has been an independent analyst and trader
in the financial markets since 2016. He has extensive knowledge of technical analysis as well as development of trading strategies based on quantitative analysis. His passion for the world of investment has led him to devour a large amount of training on this subject which he tries to disseminate from principles of honesty, transparency and responsibility.
