
Andrews' Pitchfork

Patric Mikula
The Best Trendline Method of Alan Andrews and Five Trendline Techniques (2012)
📺「Andrews Pitchfork Definition and Applications」
[ケメコ注]
Alan H. Andrewsは、物理学や数学に精通しており、特に「ニュートンの運動法則」や「振り子の動き」からインスピレーションを得て、市場の価格の動きを分析しました。彼は価格を「自然界の動き」として捉え、サポートやレジスタンスが価格をどのように抑制・反発させるかを視覚的に示しました。
1970年代、Andrewsは自身のトレード理論を広める中で、Pitchforkを開発。この手法は、トレンドの中心軸(Median Line)を起点として、価格の動きを予測するシンプルかつ強力なツールとして評判になりました。
自身の理論を普及させるため、多くの講演やセミナーを開催。また、「Andrews Course」と呼ばれる商材を通じて、トレーダーに価格動向の予測手法を伝授。数多くの弟子を輩出。
Alan Andrewsの相場哲学
「価格は自然の法則に従い、特定の軸に戻ろうとする力を持つ」
「シンプルな法則を見つけ、それに従うことが勝利への鍵である」
Alan Andrewsの Pitchfork
Trading Viewの「描画ツール-ライン」に格納されているよ
3つの点(Pivot)を選び、それをもとに描かれるテクニカル分析ツールの一つ。トレンドラインと似ているけれど、真ん中のMedian Lineを中心に、上下に並行するUpper LineとLower Lineが引かれるのが特徴。
価格がトレンド内でどのように動くかを予測したり、エントリーやエグジットのタイミングを探るのに使われる。「価格は通常、中央のラインに戻りやすい」という考えに基づいている。
ピッチフォークの基本的な描き方
3つのPivotポイントを選ぶ
最初のポイントA:トレンドの始点(高値 or 安値)
次の2つのポイントBとC:最初の波の高値と安値
強み
視覚的にわかりやすい
トレンドの方向性や価格がどこで反発・ブレイクしそうかを一目で判断できる。
トレンドフォローに最適
価格がミドルラインに戻る性質を活かして、効率よくエントリーやエグジットが可能。
サポート&レジスタンスの代用に使える
トレンドラインを引くのが苦手な人でも、ピッチフォークなら簡単にチャネルを作れる。
調整波の確認に便利
修正波(調整)やトレンドの継続を見極める助けになる。
弱み
ポイントの選択が主観的
どの高値・安値を選ぶかで結果が変わるため、慣れるまで再現性が低くなることも。
レンジ相場には不向き
トレンドが明確でないときは、ラインが意味を成さないことが多い。
価格がラインを無視することも
実際の市場ではピッチフォーク通りに動かないこともあり、過信すると損失に繋がる。
[ケメコ注ここまで]
In his seminars, Andrews said his trendline methods were based on the work of Roger Babson. In the 1930’s, Roger Babson was publicly credited with forecasting the crash of 1929 more accurately than any other person. The exact nature of what Roger Babson showed Andrews no one can know. My research leads me to believe Roger Babson gave Andrews the concept of financial action and reaction. Then Andrews developed his trendline methods based on this idea.
A pivot is a point where the price bars change direction.
Three pivots are needed to draw a Median Line.

Median Line is based on the laws of physics. These principles are that natural cycles return to their centers, and for every action there is a reaction.

Median Line Trading Principle 1:
When a Median Line is drawn from the most recent swings the price should return to the Median Line approximately 80 percent of the time.
Median Line Trading Principle 2:
When the price returns to the Median Line there often will be a pivot made on the Median Line.
Median Line Trading Principle 3:
When the price returns to the Median Line the price often will form several small swings around the Median Line and touch the Median Line more than once before moving on.


Median Line Trading Principle 4:
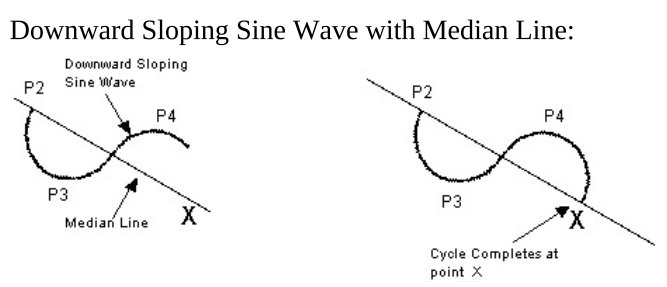
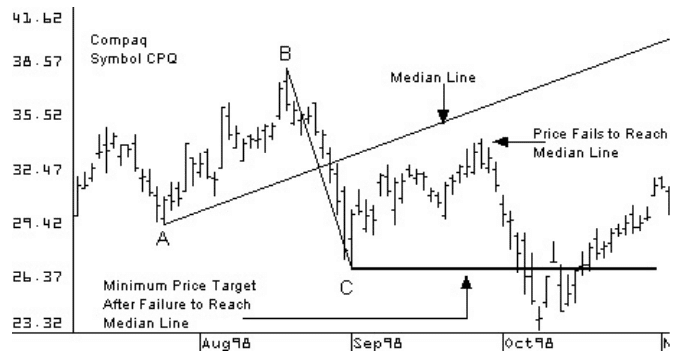
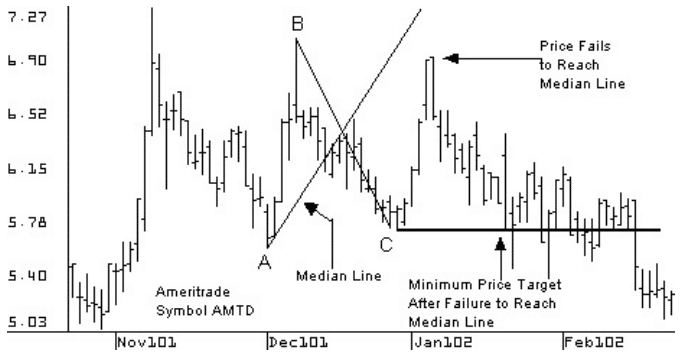
If the price does not reach the Median Line, the price moves in the opposite direction more than the previous swing size.


After drawing the Median Line, Andrews added 2 parallel lines starting from B and C. This creates an upper parallel line and a lower parallel line. The three lines on the chart below make what is now known as the Alan Andrews Pitchfork.


Buy Rule 1:
When the price breaks above a downward sloping upper parallel line it is an indication of market strength and can be considered a buy signal.
Sell Rule 1:
When the price breaks below an upward sloping lower parallel line it is an indication of market weakness and can be considered a sell signal.
Buy Rule 2:
On a downward sloping Pitchfork and an upper Trigger Line, if the price does not fall to the Median Line and then rallies and breaks above the upper Trigger Line, this is a signal to buy.


Sell Rule 2:
On an upward sloping Pitchfork and a lower Trigger Line, if the price fails to rise to the Median Line and then falls and breaks below the lower Trigger Line, it is a signal to sell.


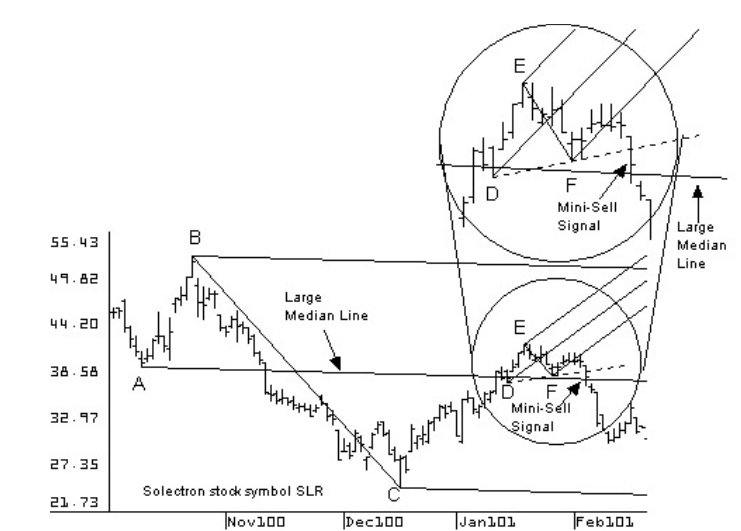
The total number of bars used to draw this Mini-Median Line is only seven bars. The size of a price swing used to draw a Mini-Median Line is about two to five bars.


Andrews added additional parallel lines above and below the Pitchfork. These lines are named Warning Lines.


There was only one pattern which Andrews considered important enough to include as part of his course. This is the expanding swings pattern which is shown in the diagram below. This pattern occurs when a series of price swings become increasingly larger. On the diagram below, the swing from B to C is larger than the swing from A to B. The swing from C to D is larger than the swings that precede it and the swing from D to E is the largest. Andrews believed that this pattern is formed in a market that is becoming unstable and would soon have a sharp break to the down side.


In Andrews seminars and in his Action Reaction course, Andrews said if traders understood this one method they could make a million dollars.
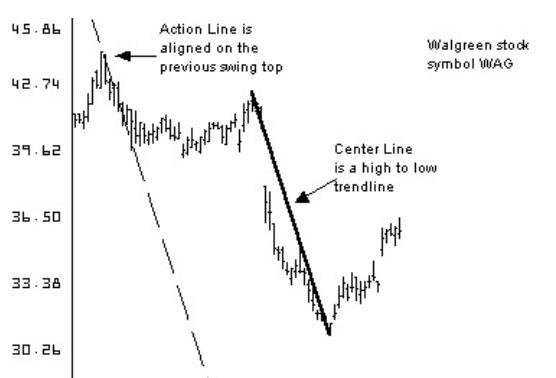
Action Reaction Method 1 uses three different types of lines, the Center Line, the Action Lines, and the Reaction Lines. The first step in applying this method is to select a Center Line. A Center Line can be Median Line, a trendline or Multi-Pivot Line.


Action Reaction Method 2 uses only one Action Line.

The Action Line must be drawn to the left of the Center Line and must use the same slope as the Center Line. The Action Line must be aligned with a previous swing top or bottom.
Reaction Line 1 is drawn an equal distance from the Center Line as the Action Line.
Reaction Line 2 is drawn twice as far from the Center Line as the Action Line.
Reaction Line 3 is drawn three time as far from the Center Line as the Action Line.


The sliding trendline is unique among Andrews’ trendline methods because it is not drawn based on a fixed pivot but rather is a movable trendline.


The strategy Andrews showed for trading Elliott’s five wave pattern is to draw a trendline connecting pivots 0 and 4.


[ケメコ注]
[ケメコ注ここまで]
Mikula Rules
New Pitchfork Trading Rules
Pitchfork Buy Rule 1:
Draw a downward sloping Pitchfork. If the price moves along the Pitchfork upper parallel and never dips very much into the Pitchfork, it is a sign of market strength. When a full price bar moves above the upper parallel, it is an sign to buy.

Pitchfork Sell Rule 1:
Draw an upward sloping Pitchfork. If the price moves along the Pitchfork lower parallel, never rising very much into the Pitchfork, it is a sign of market weakness. When a full price bar moves below the lower parallel, it is an indication to sell.


Rule 2 and Rule 3 are both based on price action around the Median Line.
Pitchfork Buy Rule 2:
If the price moves down to the Median Line, and then makes a gap up or a long range day up away from the Median Line, it is a signal to buy.
Pitchfork Sell Rule 2:
If the price moves up to the Median Line, and then makes a gap down or long range day down away from the Median Line, there is a signal to sell.

Pitchfork Buy Rule 3:
Draw an downward sloping Median Line. If the price makes a spike bottom against the Median Line, it is a signal to buy.
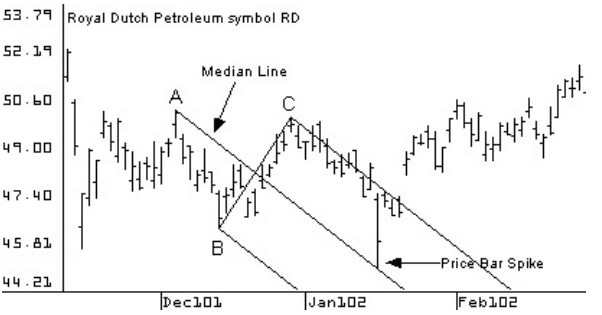
Pitchfork Sell Rule 3:
Draw an upward sloping Median Line. If the price makes a spike top against the Median Line, it is a signal to sell. This is an indication that the move to touch the Median Line is a price exhaustion. When this type of contact occurs, it is an indication that the price is moving lower and is a signal to sell.

The Median Line Momentum Swing Trading Strategy
This method combines the Median Line and the Slow Stochastic indicator. The settings for the Slow Stochastic indicator used with this method are a 14 bar look-back period, an oversold level of 20 and an overbought level of 80. Median Line theory states that a Median Line drawn from the most recent pivots will see the price reach the Median Line about 80% of the time. It is possible to find high probability pivots to trade by watching for the price to reach the Median Line when the Stochastic is oversold or overbought.
The Buy Setup
1: Draw a downward sloping Median Line from the most recent pivots.
2: Apply a Slow Stochastic to the chart.
3: Watch for the price to move down to the Median Line and the Slow Stochastic to become oversold at the same time.
4: If the conditions in Step 3 are met, buy long on any observation that the market has turned upward.


The Sell Setup
1: Draw an upward sloping Median Line from the most recent pivots.
2: Apply a Slow Stochastic to the chart.
3: Watch for the price to move up to the Median Line and the SlowStochastic to become overbought at the same time.
4: If the conditions in Step 3 are met, sell short on any observation that the market has turned downward.


The 50 Percent Pitchfork
Under some conditions, the Pitchfork is too steep to be of any trading value. This problem is addressed by the 50% Pitchfork which I developed here at Mikula Forecasting Company. This innovative Pitchfork is drawn using the same three starting pivots as the standard Pitchfork, but with a new set of drawing rules. On the first diagram below, points A, B, and C represent three pivots used to draw a standard Pitchfork. The horizontal line, marked by the letter D, is the B-C midpoint. If pivot A is below D as seen on the diagram, the 50% Pitchfork is drawn with the 50% point between A and B instead of A. This 50% point between A and B is marked by the X.


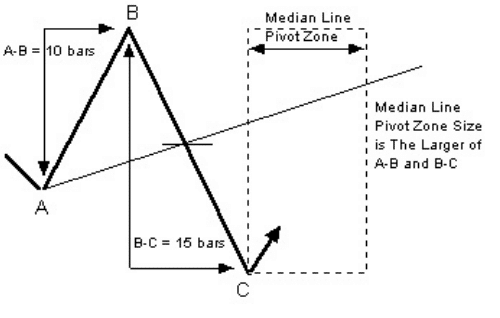
The Median Line Pivot Zone
I developed a technique named the, “Median Line Pivot Zone,” to estimate how long it should take for the price to reach the Median Line. The diagram below shows a Median Line drawn using pivots A, B, and C. The first step to calculate the Median Line Pivot Zone is to draw a Median Line and count the bar size of the two swings from A to B and B to C. On the diagram below the size of swing A to B is shown as 10 bars and size of swing B to C is shown as 15 bars. Starting from the newest pivot used to draw the Median Line, in this case pivot C, count forward the number of bars in the larger of the two swing counts and mark this bar on the Median Line.

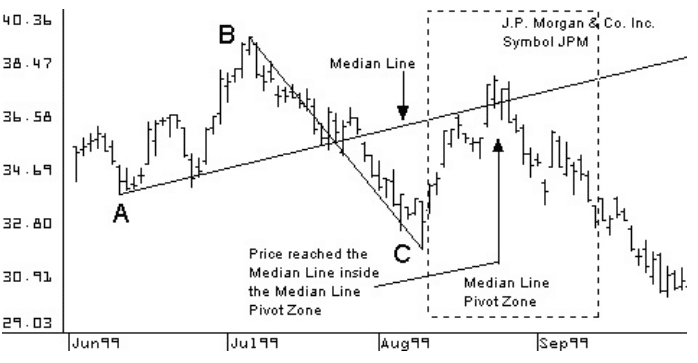
Median Line Pivot Zone Rule 1:
If the price does not reach the Median Line inside the Median Line Pivot Zone, this indicates the market may not be in the appropriate position for swing trading at that time. In this situation, the swing trader takes extra caution or waits for the next swing.
Median Line Pivot Zone Rule 2:
If the price does reach the Median Line in the Median Line Pivot Zone, this indicates the market is most likely suitable for swing trading. A trader starts watching for a pivot.
Median Line Pivot Zone Rule 3:
When the price reaches the Median Line in the Median Line Pivot Zone, it will often end up touching the Median Line more than once before forming a pivot. This means a trader watches for a pivot but does not blindly enter the market expecting an immediate swing reversal.


The Action Reaction Method
Here is a variation of the Action Reaction Method which I developed while research was conducted on support and resistance levels. This is a very specific application of horizontal action reaction lines.


The Super-Pitchfork
While I was using the Action Reaction Methods here at Mikula Forecasting Company, it was noticed that some historical pivots used to align the Action Lines, worked better than others. Reaction Lines from the recent past, worked best. To say this another way, the greatest correlation with the near future is the recent past. Based on this observation the Pitchfork and the Action Reaction Methods were combined to created the Super-Pitchfork.
Utilization of this technique begins with drawing a Pitchfork involving pivots A, B, and C. Next, the line from pivots B to C is used as the Action Reaction Method Center Line. Pivot A is then used as the alignment point for the Action Line. The next step applies the distance from pivot A to the Center Line as a measurement for drawing Reaction Lines at equal increments into the future. The chart below exhibits three Reaction Lines which are equal distances apart. This integrates the Pitchfork and the Action Reaction Method by using the same three pivots A, B, and C for both methods. This is the Super-Pitchfork. Point D on the chart below is important. At this point, the price reaches the Super-Pitchfork Median Line and Reaction Line 1 at the same time. A trader wants to see the market make a pivot where two lines intersect. It is very common to see pivots form just before or just after two lines intersect on the Super-Pitchfork.


【追記】2024年12月20日
上位足キャンドル(ローソク足)の四角形を使つて
Pitchforkを引くのがとつてもわかりやすい

