
統計グラフGPTsを見直し外部APIを使う路線に変更
まだ続く
制作中の統計データグラフ作成・解析用のGPTs。
ようやくAPIからデータを取得することが確認でき、より精度の高い動作を実装巣るためのフェーズに入れました。
見直しのヒントは以下投稿からもらいました。
鍵は「Actions」&「Schema」
「Create a GPT」から移動したGPTsの作成画面の「Configure」タブ。
「Capabilities」の設定「Web Browsing」をOFFにし、「Actions」の設定を加えることでインターネットのアクセスができること。
公開中のGPTSの「GPT Customizer」(GPT Customizer, File Finder & JSON Action Creator)や「ActionsGPT」から教えてもらう情報を使い、「Actions」を有効にすることで外部APIにアクセスできること。
「Actions」を使えば外部からデータを取得できることを知りました。
「Actions」の設定は「Schema」に記述します。

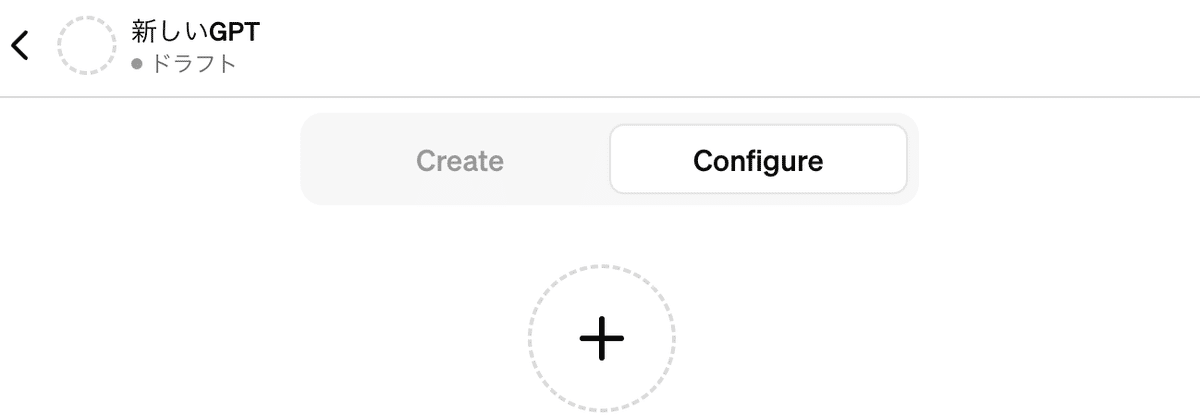

その下のActions「新しいアクションを作成」を選択
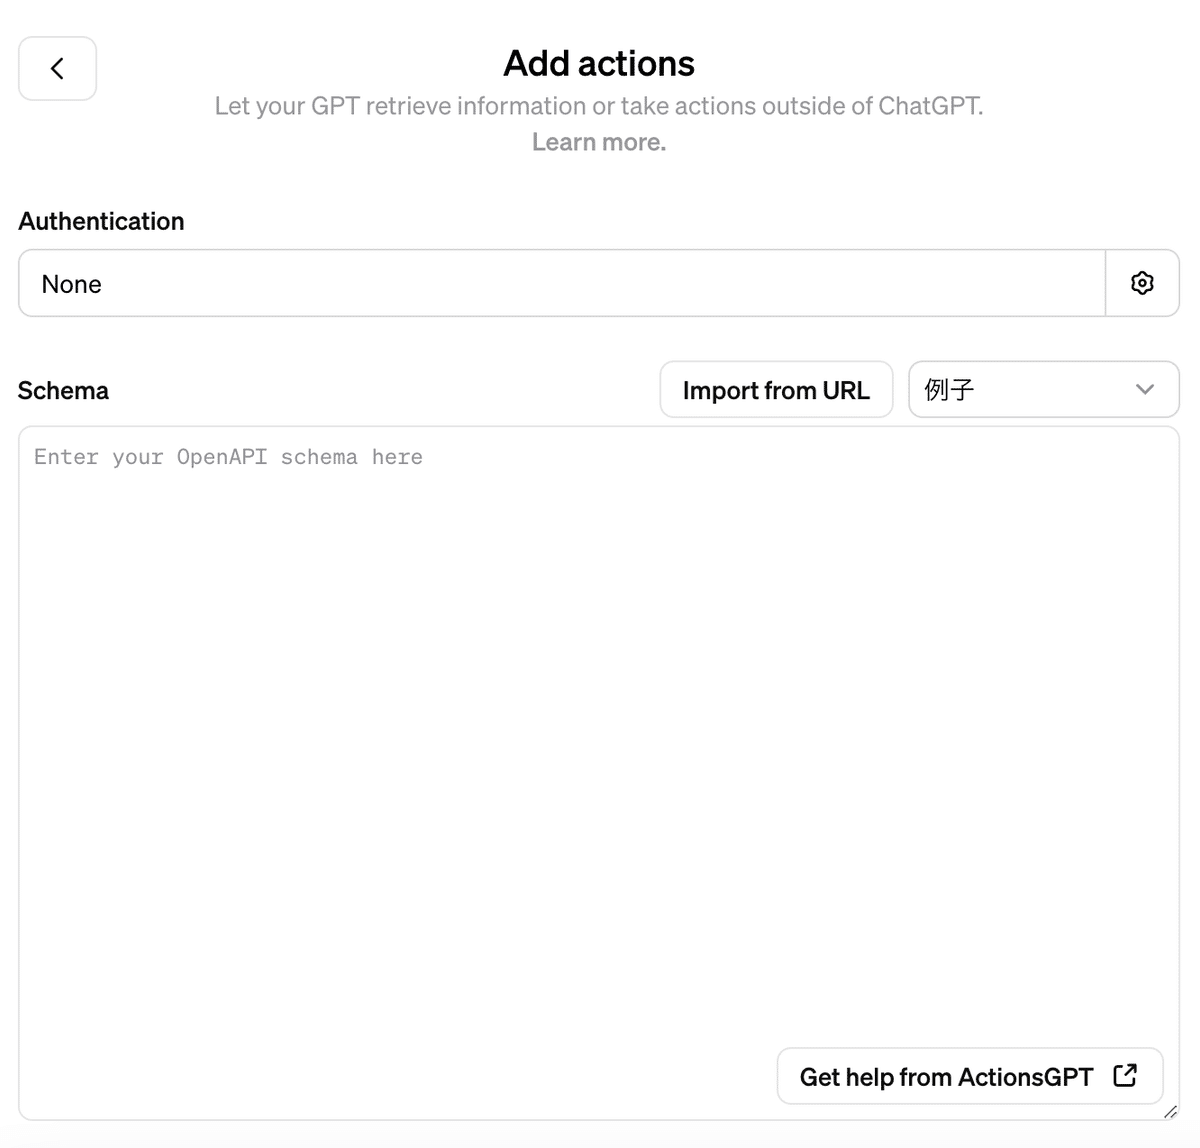
なお、上記の「ActionsGPT」は「Schema」の下の画面にリンクがあります。
GPT Customizerに教えてもらうSchema
「GPT Customizer」から上記画面の「Actions」にある「Schema」の記述を教えてもらいます。
あなた
https://api.e-stat.go.jp/rest/3.0/app/getSimpleStatsData?cdCat01=059&cdCat02=03&cdArea=00000&appId=<自分のアプリケーションID>&lang=J&statsDataId=0002070001&metaGetFlg=Y& cntGetFlg=N& explanationGetFlg=Y&annotationGetFlg=Y& sectionHeaderFlg=1&replaceSpChars=0
はCSVを取得するためのクエリーです。 JSONコードを返してくれますか。
GPT Customizer, File Finder & JSON Action Creator
「提供されたクエリは、e-StatのAPIを使用して特定の統計データをCSV形式で取得するためのものです。このクエリを利用するためのJSONコード(OpenAPI 3.0.0形式)を以下に提供します。このコードは、APIのエンドポイント、必要なパラメータ、および期待されるレスポンスタイプを定義します。」
{
  "openapi": "3.0.0",
  "info": {
    "title": "e-Stat API for CSV Retrieval",
    "version": "1.0.0",
    "description": "API for retrieving statistical data in CSV format from e-Stat."
  },
  "servers": [
    {
      "url": "https://api.e-stat.go.jp/rest/3.0/app"
    }
  ],
  "paths": {
    "/getSimpleStatsData": {
      "get": {
        "operationId": "getSimpleStatsDataCSV",
        "summary": "Retrieve Statistical Data as CSV",
        "parameters": [
          {
            "name": "cdCat01",
            "in": "query",
            "required": true,
            "schema": {
              "type": "string"
            }
          },
          {
            "name": "cdCat02",
            "in": "query",
            "required": true,
            "schema": {
              "type": "string"
            }
          },
          {
            "name": "cdArea",
            "in": "query",
            "required": true,
            "schema": {
              "type": "string"
            }
          },
          {
            "name": "appId",
            "in": "query",
            "required": true,
            "schema": {
              "type": "string"
            }
          },
          {
            "name": "lang",
            "in": "query",
            "required": true,
            "schema": {
              "type": "string"
            }
          },
          {
            "name": "statsDataId",
            "in": "query",
            "required": true,
            "schema": {
              "type": "string"
            }
          },
          {
            "name": "metaGetFlg",
            "in": "query",
            "required": false,
            "schema": {
              "type": "string"
            }
          },
          {
            "name": "cntGetFlg",
            "in": "query",
            "required": false,
            "schema": {
              "type": "string"
            }
          },
          {
            "name": "explanationGetFlg",
            "in": "query",
            "required": false,
            "schema": {
              "type": "string"
            }
          },
          {
            "name": "annotationGetFlg",
            "in": "query",
            "required": false,
            "schema": {
              "type": "string"
            }
          },
          {
            "name": "sectionHeaderFlg",
            "in": "query",
            "required": false,
            "schema": {
              "type": "string"
            }
          },
          {
            "name": "replaceSpChars",
            "in": "query",
            "required": false,
            "schema": {
              "type": "string"
            }
          }
        ],
        "responses": {
          "200": {
            "description": "Successful response with CSV data",
            "content": {
              "text/csv": {
                "schema": {
                  "type": "string"
                }
              }
            }
          }
        }
      }
    }
  }
}
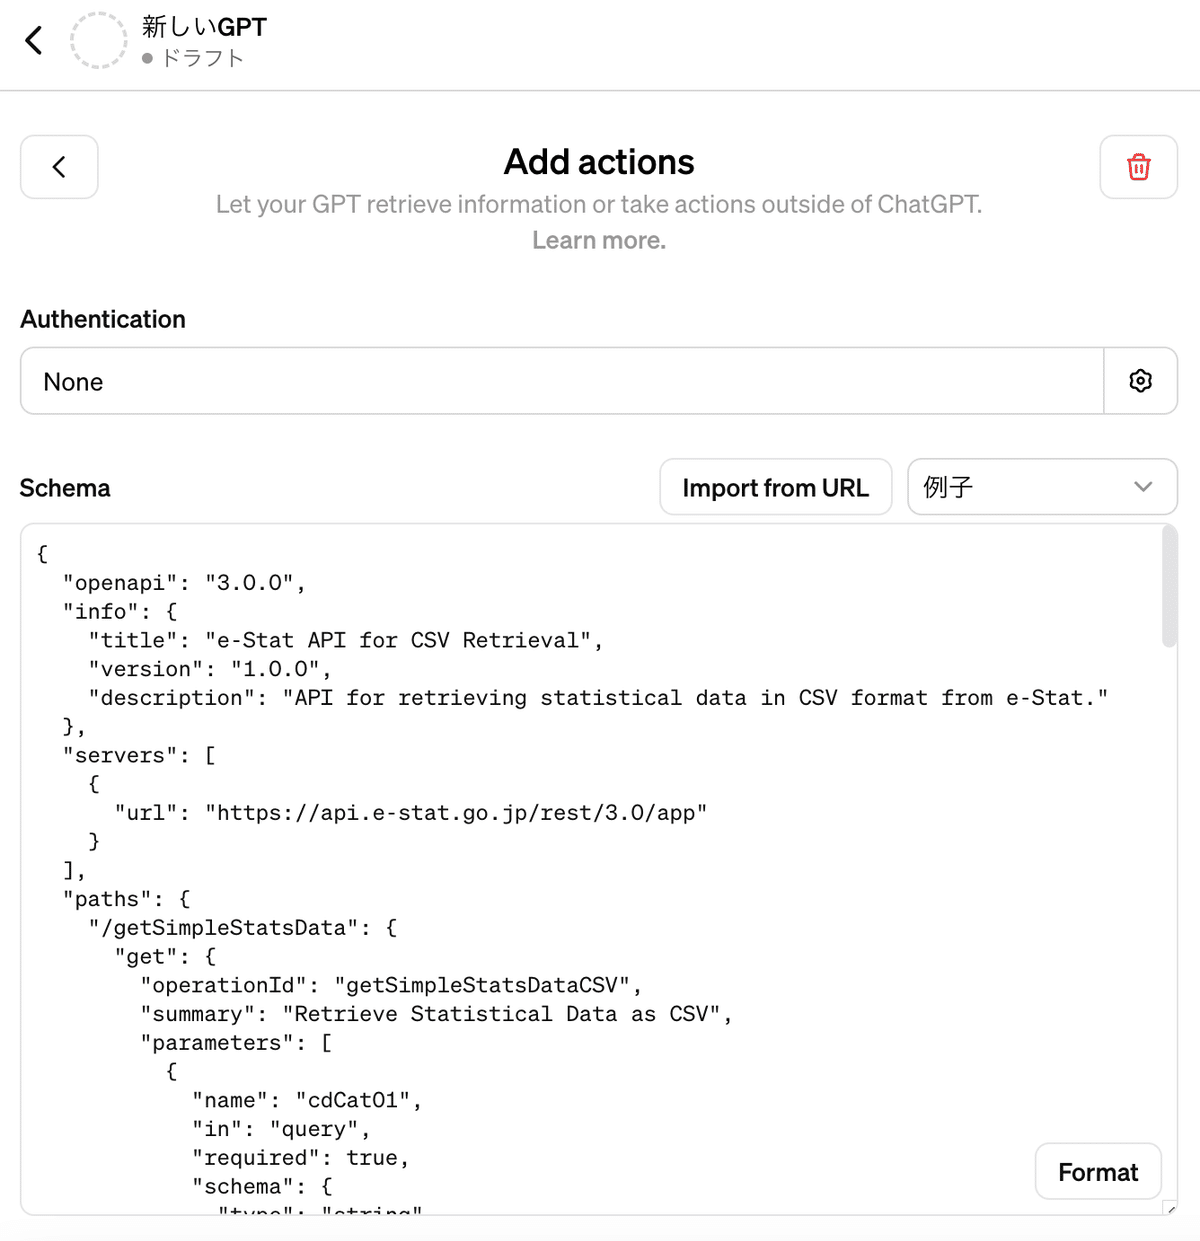
この記述を「Schema」欄にコピペします。
AuthenticationとSchema
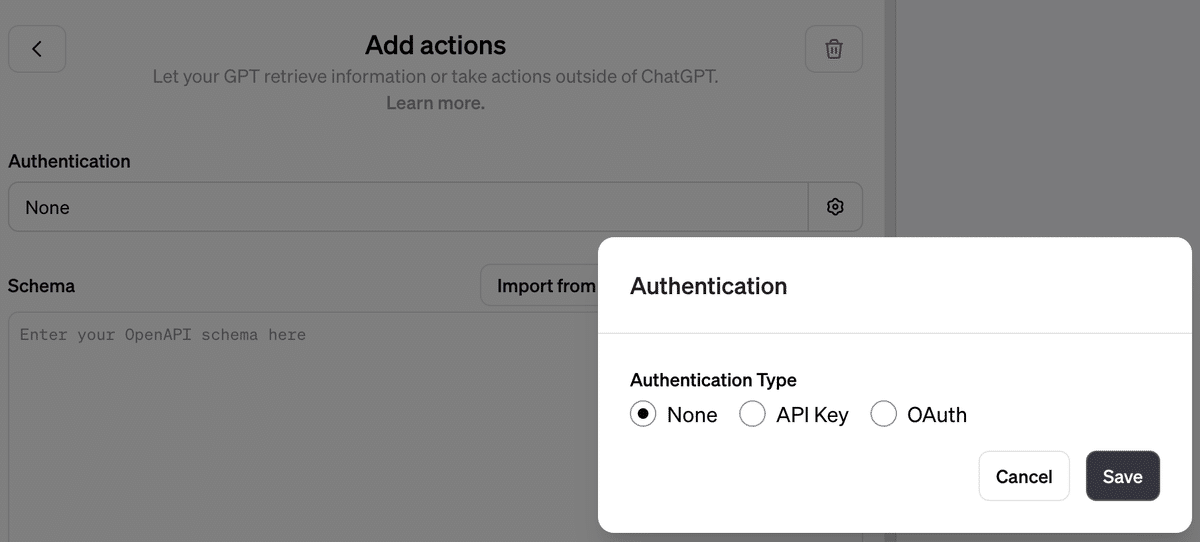
「Authentication」を「None」にします。
先ほどのGPT Customizerの返事をコピペします。
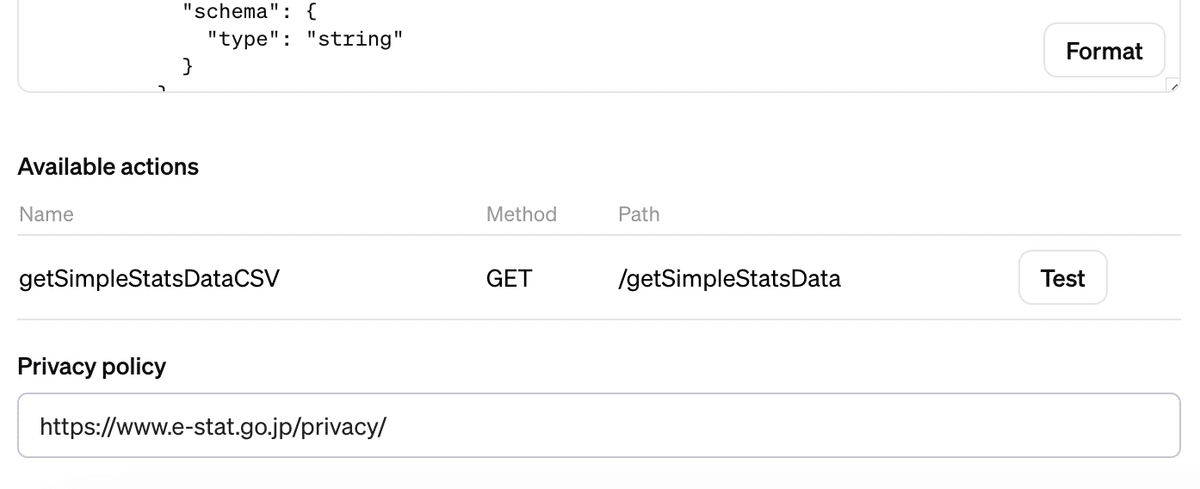
Privacy policy
「Privacy policy」には「e-Stat」のAPI機能利用規約から貼られているリンクを記述します。
(いくつかのサイトを参考にしたところ、使用するAPIのプライバイーポリシーを記載するようです)
Previewで動作テスト
動作テストを「Preview」で行います。
実際のアプリケーションIDを記述して(上記に)CSVを取得するクエリーをチャットとして投げます。
(GPTsのActionsでは、APIを使うために認証情報を送る必要があるケースがあります。学習されないかを確認できるまで、使用はテストの範囲だけに限ろうと考えています)
https://api.e-stat.go.jp/rest/3.0/app/getSimpleStatsData?cdCat01=059&cdCat02=03&cdArea=00000&appId=<自分のアプリケーションID>&lang=J&statsDataId=0002070001&metaGetFlg=Y& cntGetFlg=N& explanationGetFlg=Y&annotationGetFlg=Y& sectionHeaderFlg=1&replaceSpChars=0
※CSVを取得。ヘッダーなし。Shift-JIS、エリアは全国のみ。
※値は消費支出(二人以上の世帯)。
チャットでCSV取得クエリーを投げる
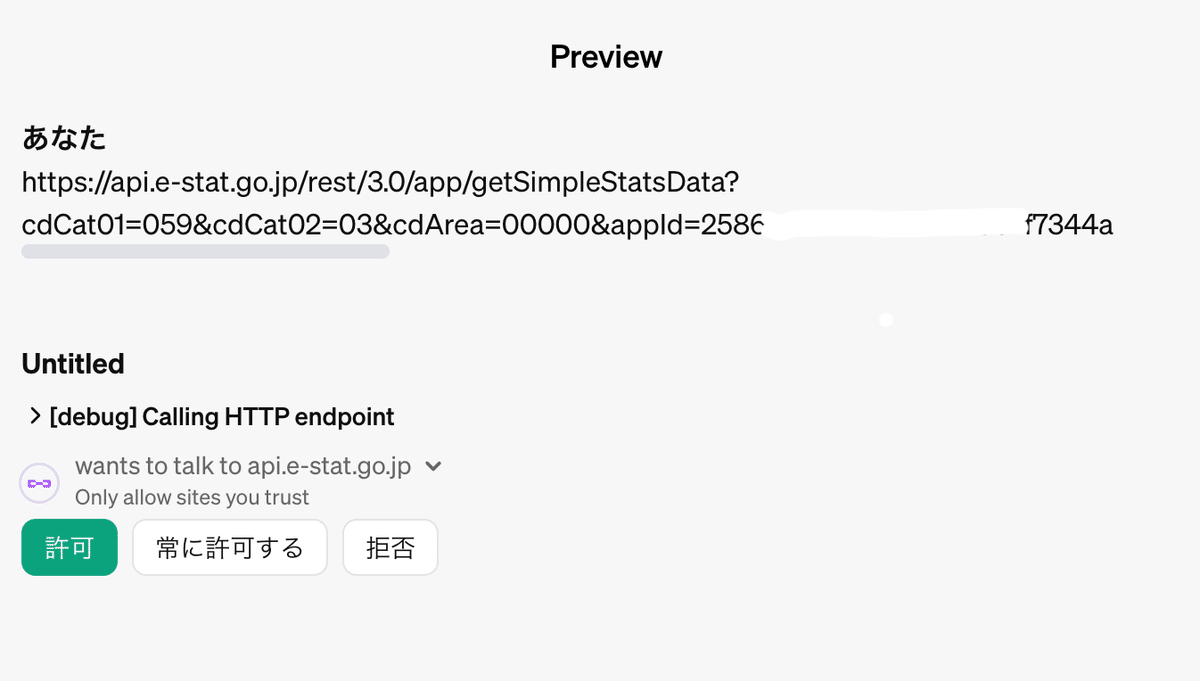
アクセス許可を求められるので、「許可」をクリック。
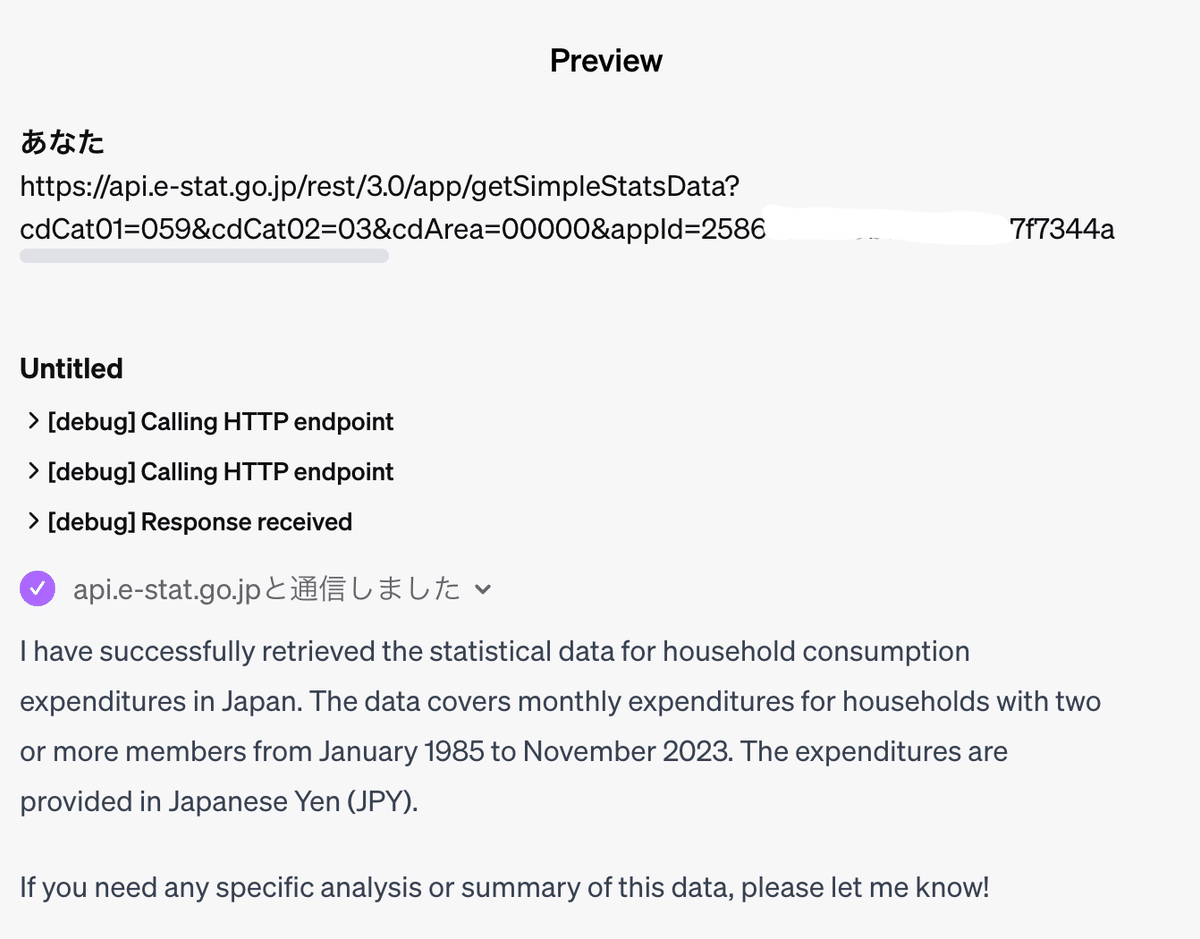
通信が成功し、取得したデータについて説明を開始します。
データの確認
問い合わせます。
最新の消費支出は?

確認すると、正しい数字をピックアップしてくれていることがわかりました。
グラフ作成も問い合わせてみる
グラフ作成はうまくいきませんでした。
(後述しますが、できることもありました)
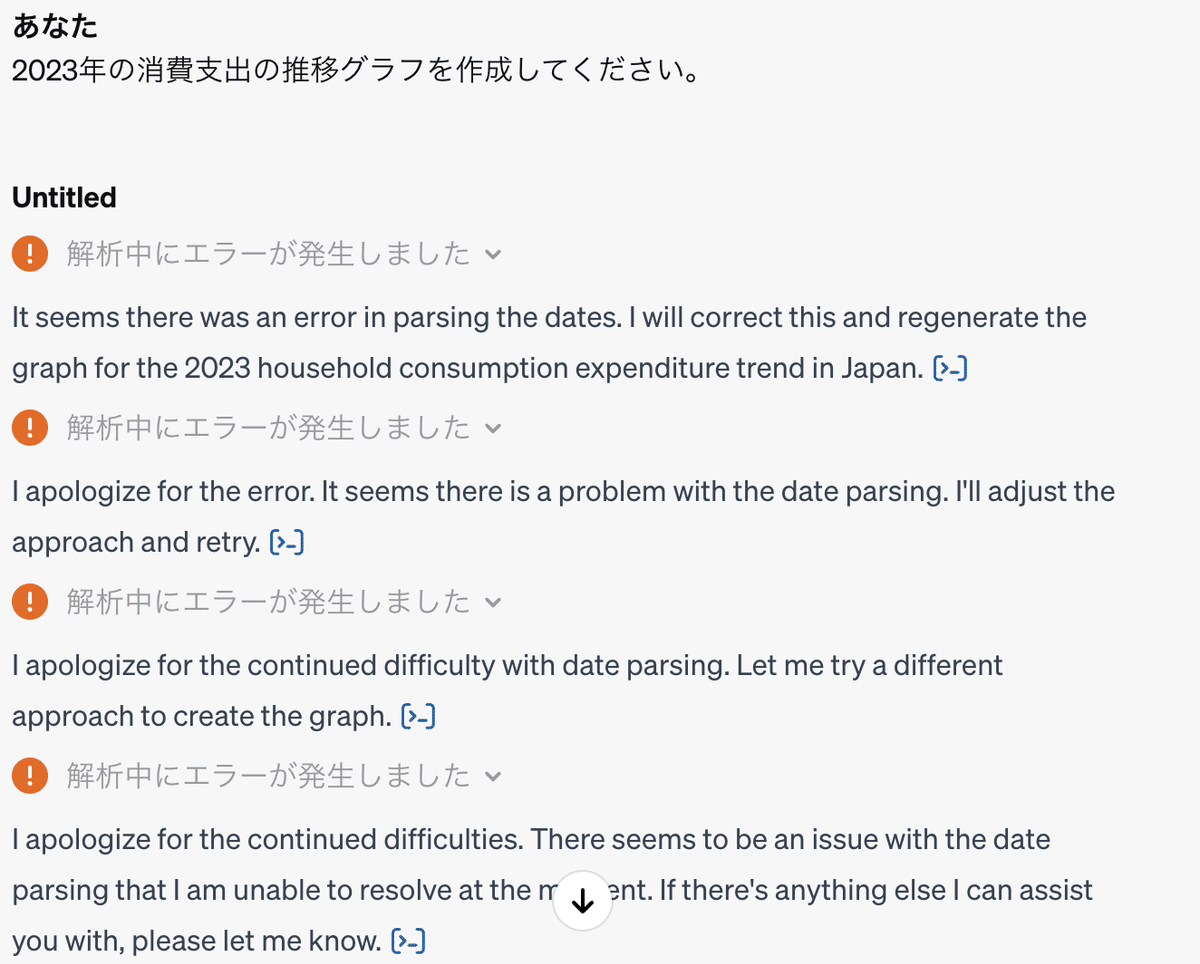
問い合わせます。
2023年の消費支出の推移グラフを作成してください。
エラーで終わりました。
ただ、アプローチを変えて何度かトライしてくれています。
「[>_]」をクリックしてPythonコード
メッセージの後ろに記載の「[>_]」をクリックすると、Pythonのコードを確認できます。
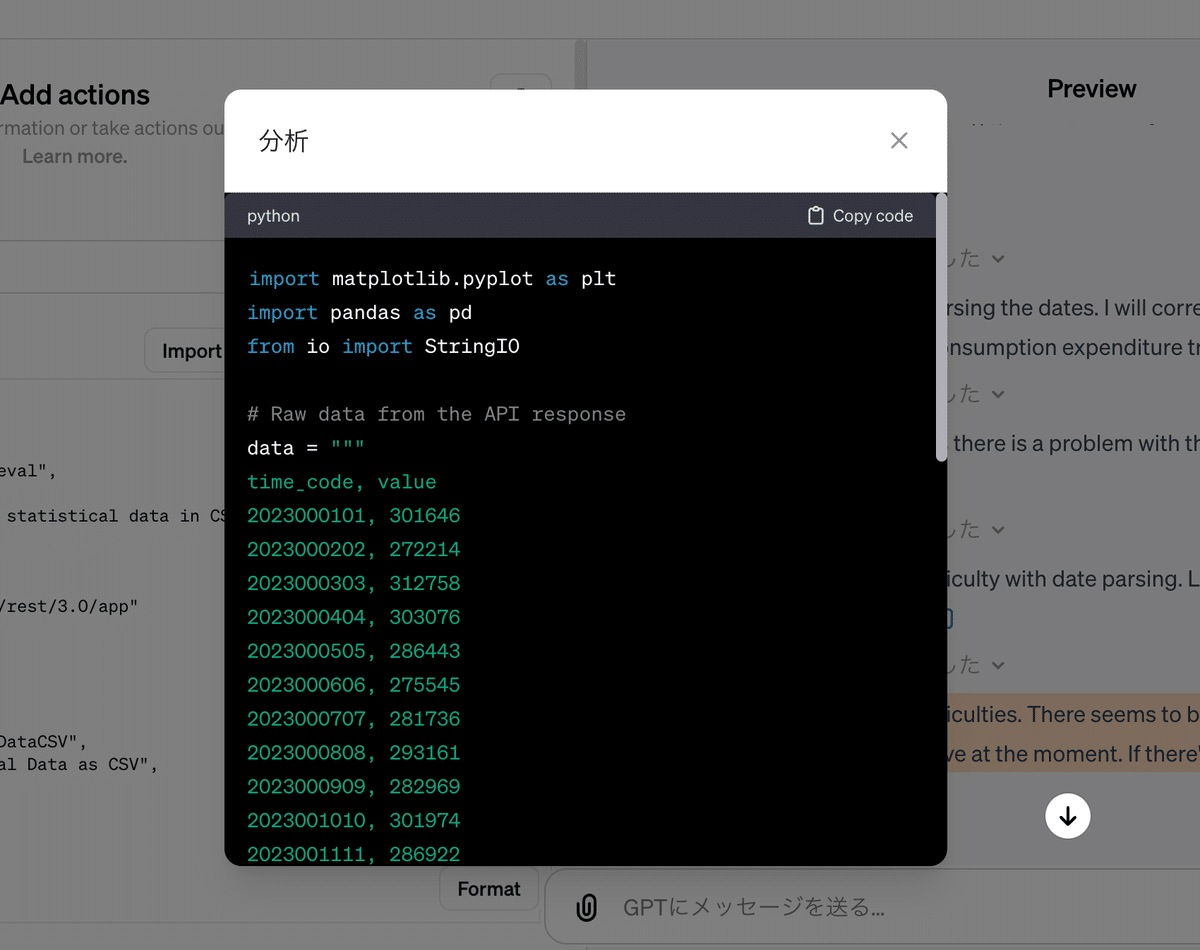
以下が全コード。
実際には13列のデータです。
「time_code」と「value」のデータを読み込んでくれていますが、日付のパースにうまくいかず、エラーに終わったようです。
(実際には時間軸には「time_code」でなく、「時間軸(月次)」を使います)
import matplotlib.pyplot as plt
import pandas as pd
from io import StringIO

# Raw data from the API response
data = """
time_code, value
2023000101, 301646
2023000202, 272214
2023000303, 312758
2023000404, 303076
2023000505, 286443
2023000606, 275545
2023000707, 281736
2023000808, 293161
2023000909, 282969
2023001010, 301974
2023001111, 286922
"""

# Convert the raw data to a DataFrame
df = pd.read_csv(StringIO(data), index_col=False)
# Converting time_code to datetime
df['time_code'] = pd.to_datetime(df['time_code'].astype(str), format='%Y%m%d%H')

# Plotting
plt.figure(figsize=(12, 6))
plt.plot(df['time_code'], df['value'], marker='o')
plt.title('Monthly Household Consumption Expenditure in Japan for 2023')
plt.xlabel('Month')
plt.ylabel('Expenditure (Yen)')
plt.grid(True)
plt.xticks(df['time_code'], df['time_code'].dt.strftime('%b'), rotation=45)
plt.tight_layout()
plt.show()
最後のトライでは、「time_code」を「year」と「month」に分けようとしてくれます。
(結果的にはうまくいきませんでしたが、ここまでやってくれることに驚きを覚えました)
# Correcting the date parsing approach
# Extracting year and month from the 'time_code' column
df['year'] = df['time_code'].astype(str).str.slice(0, 4)
df['month'] = df['time_code'].astype(str).str.slice(4, 6)

# Creating a new 'date' column for plotting
df['date'] = pd.to_datetime(df['year'] + df['month'], format='%Y%m')

# Plotting the graph
plt.figure(figsize=(12, 6))
plt.plot(df['date'], df['value'], marker='o', color='blue')
plt.title('Monthly Household Consumption Expenditure in Japan for 2023')
plt.xlabel('Month')
plt.ylabel('Expenditure (Yen)')
plt.grid(True)
plt.xticks(df['date'], df['date'].dt.strftime('%b'), rotation=45)
plt.tight_layout()
plt.show()
推移確認がうまくいった場合
https://api.e-stat.go.jp/rest/3.0/app/getSimpleStatsData?cdCat01=059&cdCat02=03&cdArea=00000&appId=<自分のアプリケーションID>&lang=J&statsDataId=0002070001&metaGetFlg=Y& cntGetFlg=N& explanationGetFlg=Y&annotationGetFlg=Y& sectionHeaderFlg=1&replaceSpChars=0
2022年から2023年の消費支出の推移はどういう傾向でしょうか。
回答です。
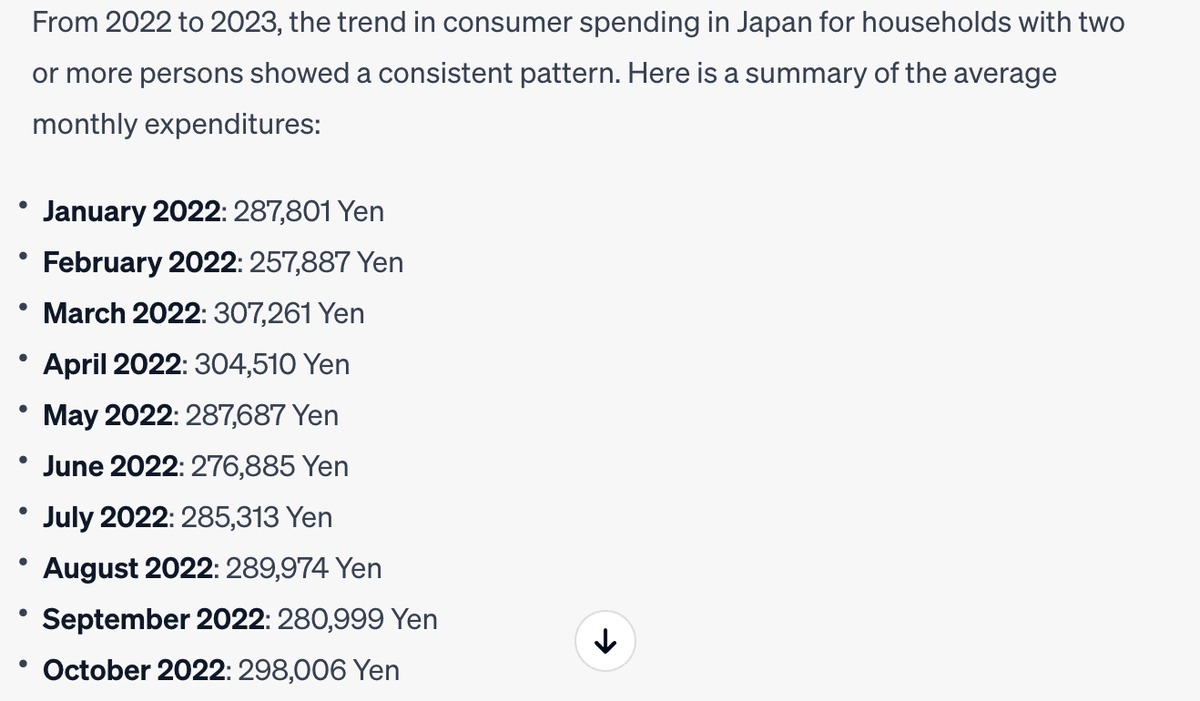

ここまでできることがわかり、十分です。
ActionGPTを使った場合
「GPT Customizer」と多少異なるJSON(Schema)を返します。
Schemaにコピペ。問題なく動作します。
https://api.e-stat.go.jp/rest/3.0/app/getSimpleStatsData?cdCat01=059&cdCat02=03&cdArea=00000&appId=<自分のアプリケーションID>&lang=J&statsDataId=0002070001&metaGetFlg=Y& cntGetFlg=N& explanationGetFlg=Y&annotationGetFlg=Y& sectionHeaderFlg=1&replaceSpChars=0
はCSVを取得するためのクエリーです。 JSONコードを返してくれますか。
ActionsGPT
このURLは、日本のe-Stat統計データAPIへのリクエストを表しているようです。このAPIからCSVファイルを取得するためのクエリを含んでいます。OpenAPI 3.0の仕様でこのAPIを表現するには、まずAPIの基本的な操作を理解する必要があります。この場合、getSimpleStatsDataエンドポイントを使用して統計データを取得しています。
以下は、このAPI操作のためのOpenAPI 3.0仕様の例です。この例では、必要なクエリパラメータを定義しており、applicationIdはユーザーが自身のアプリケーションIDを入力する必要があることを示しています。
openapi: 3.0.0
info:
  title: e-Stat Statistics Data API
  description: API for accessing statistics data from e-Stat Japan.
  version: 1.0.0
servers:
  - url: https://api.e-stat.go.jp/rest/3.0
    description: e-Stat API server
paths:
  /app/getSimpleStatsData:
    get:
      operationId: getSimpleStatsData
      summary: Retrieve statistics data in CSV format.
      parameters:
        - name: cdCat01
          in: query
          required: true
          description: Category Code 01
          schema:
            type: string
        - name: cdCat02
          in: query
          required: true
          description: Category Code 02
          schema:
            type: string
        - name: cdArea
          in: query
          required: true
          description: Area Code
          schema:
            type: string
        - name: appId
          in: query
          required: true
          description: Application ID
          schema:
            type: string
        - name: lang
          in: query
          required: true
          description: Language
          schema:
            type: string
        - name: statsDataId
          in: query
          required: true
          description: Statistics Data ID
          schema:
            type: string
        - name: metaGetFlg
          in: query
          description: Metadata Get Flag
          schema:
            type: string
        - name: cntGetFlg
          in: query
          description: Content Get Flag
          schema:
            type: string
        - name: explanationGetFlg
          in: query
          description: Explanation Get Flag
          schema:
            type: string
        - name: annotationGetFlg
          in: query
          description: Annotation Get Flag
          schema:
            type: string
        - name: sectionHeaderFlg
          in: query
          description: Section Header Flag
          schema:
            type: string
        - name: replaceSpChars
          in: query
          description: Replace Special Characters Flag
          schema:
            type: string
      responses:
        '200':
          description: CSV data response
          content:
            text/csv:
              schema:
                type: string
Previewのチャットで、同様にクエリーを投げます。
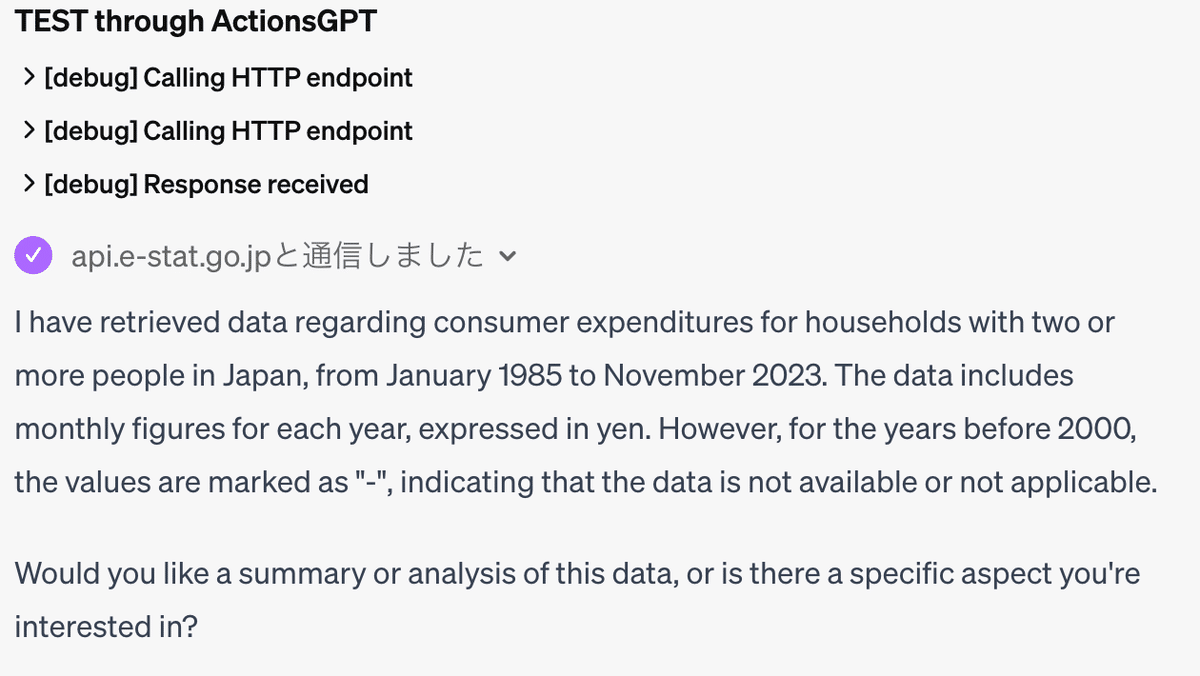
今回はグラフも作成
傾向を質問します。
あなた
https://api.e-stat.go.jp/rest/3.0/app/getSimpleStatsData?cdCat01=059&cdCat02=03&cdArea=00000&appId=<実際のMyappID>&lang=J&statsDataId=0002070001&metaGetFlg=Y&cntGetFlg=N&explanationGetFlg=Y&annotationGetFlg=Y§ionHeaderFlg=2&replaceSpChars=0
2022年から2023年の消費支出の推移はどういう傾向でしょうか。2022年から2023年の消費支出の推移はどういう傾向でしょうか。
今回はグラフを作成し、解析にまで踏み込んでくれました。
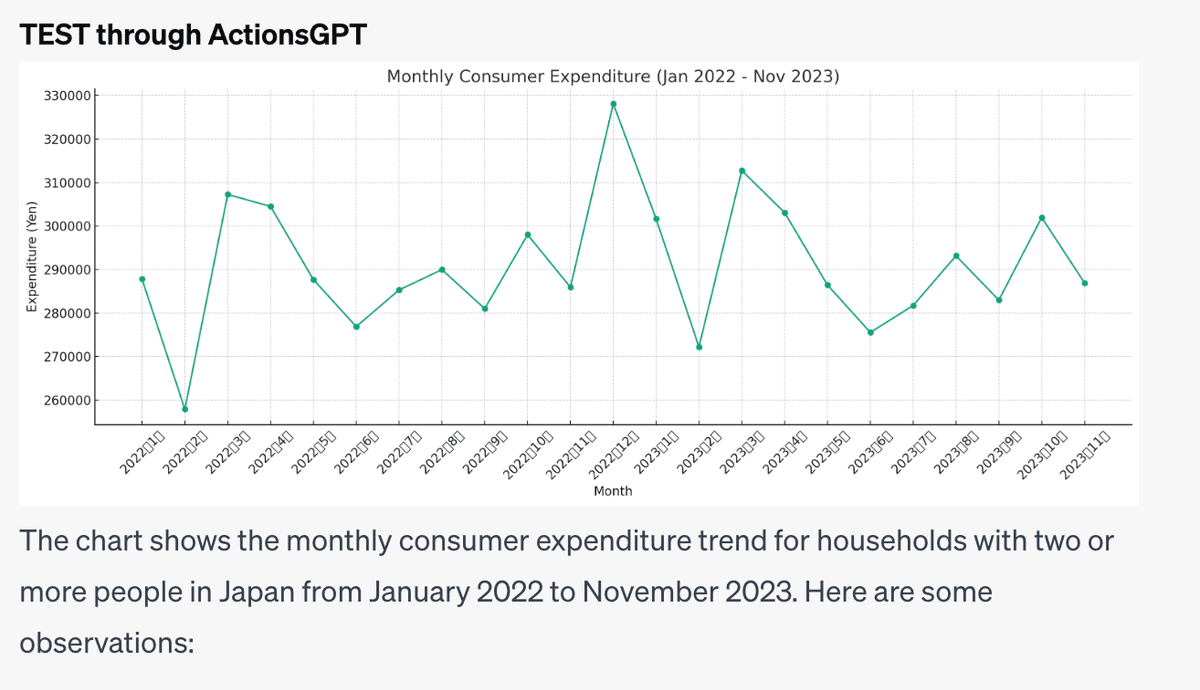
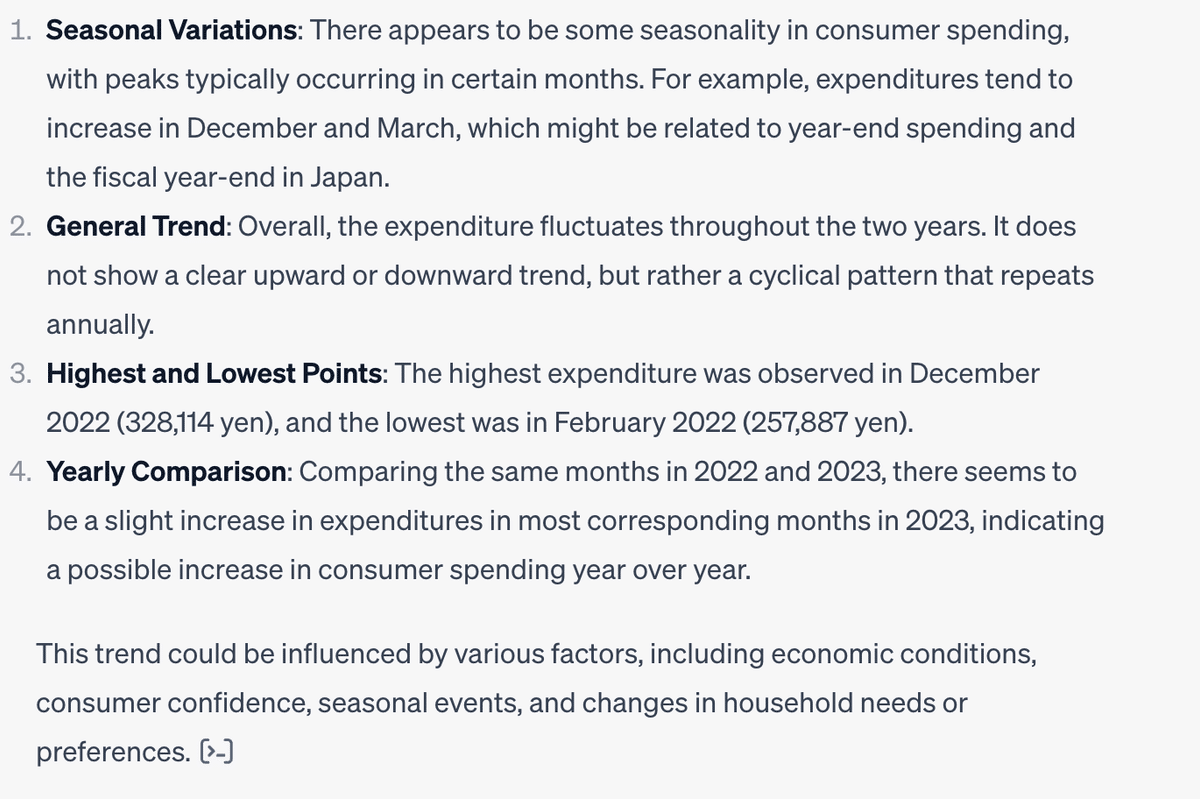
季節変動: 個人消費には若干の季節性があるようで、ピークは通常特定の月に発生します。例えば、支出は12月と3月に増加する傾向がありますが、これは年末の支出と日本の年度末に関連しているのかもしれません。
一般的な傾向: 全体として、支出は2年間を通して変動しています。明確な上昇傾向や下降傾向は見られず、むしろ毎年繰り返される周期的なパターンを持ちます。
最高点と最低点: 最高額は2022年12月(328,114円)、最低額は2022年2月(257,887円)です。
年間の比較: 2022年と2023年の同月を比較すると、2023年はほとんどの月で支出がわずかに増加しており、前年比で個人消費が増加している可能性を示しています。 この傾向は、経済状況、消費マインド、季節的イベント、家計のニーズや嗜好の変化など、さまざまな要因に影響される可能性があリます。
使用されたPythonコードです。
import pandas as pd
import matplotlib.pyplot as plt
from io import StringIO

# Data provided
data = """
月,消費支出
2022年1月,287801
2022年2月,257887
2022年3月,307261
2022年4月,304510
2022年5月,287687
2022年6月,276885
2022年7月,285313
2022年8月,289974
2022年9月,280999
2022年10月,298006
2022年11月,285947
2022年12月,328114
2023年1月,301646
2023年2月,272214
2023年3月,312758
2023年4月,303076
2023年5月,286443
2023年6月,275545
2023年7月,281736
2023年8月,293161
2023年9月,282969
2023年10月,301974
2023年11月,286922
"""

# Converting the data into a DataFrame
df = pd.read_csv(StringIO(data), index_col=0)

# Plotting the data
plt.figure(figsize=(15, 6))
plt.plot(df.index, df['消費支出'], marker='o')
plt.xticks(rotation=45)
plt.title('Monthly Consumer Expenditure (Jan 2022 - Nov 2023)')
plt.xlabel('Month')
plt.ylabel('Expenditure (Yen)')
plt.grid(True)
plt.tight_layout()

plt.show()
うまくいったのは「GPT Customizer」より「Action GPT」のSchemaが適していた、ということではないと思います。
再質問するとエラー出たりするので、うまくいったりいかなかったり、GPT特有の不安定さが残っているようです。
PythonコードをKnowledgとして登録することで、動作をルール付けするつもりです。
今後やること
データを読み込むPythonコードをKnowledgeに登録
グラフを作成するPythonコードをKnowledgeに登録
Knowledgeにフォントを登録することで文字化けを解消
実際にはエリアや用途分類には複数の項目があるので、項目を認識してグラフを作成するように指示(InstructionsとKnowledgeを利用)
アプリケーションキーを外部に後悔しないことの確認
年ごとに消費に影響のある出来事をKnowledgeに登録
最終的には、例えば
「〜と〜・・・の消費支出を可視化してください」
「前年度と比べどういう違いがありますか」
「その違いの要因を推察してください」
という質問に精度高く回答してもらえるGPTs。
にするためのチューニング
