『医学のための因果推論』のための統計学入門:3.推定量の評価基準
『医学のための因果推論Ⅰ 一般化線形モデル』を勉強した時のまとめです。
結構難しい本でしたので自分なりの解釈を入れながらまとめました。
私たちは、日常生活においてつねに推定をしています。
例えば空模様から明日の天気を予想したり、味見をして料理全体の味を想像したりする時、私たちは無意識のうちに推定を行っています。
統計学はこの「推定」をより数学的に扱います。
統計学における推定の重要性は、データから未知の真の値(パラメータ)を導くことにあります。
例えばある国の平均身長を知りたい場合、全国民の身長を測ることは現実的ではありません。
そこで一部の国民のデータから全体の平均身長を推定します。
この記事では、統計学における推定量の性質、特に不偏性、有効性、頑健性について掘り下げます。
推定量の主な概念
推定量とは、観測データから母集団のパラメータ(例:平均、分散)を推定するための数です。
例えば「サンプルの平均値」は「母集団の平均値」を推定するための推定量の一つです。
推定量はふつう、$${\hat{\theta}(Y)}$$ のように表記されます。
ここで、$${\theta}$$ は推定したいパラメータ、$${Y}$$ は観測データを表します。
不偏性
不偏性はパラメータ $${\theta}$$ を系統的に偏って推定していないことを言います。
つまり、推定量の期待値がパラメータの真の値に等しいという性質です。
数学的には以下のように表されます。
$${E[\hat{\theta}(Y)] = \theta}$$
不偏推定量は、真の値を過大評価も過小評価もしない推定量です。
有効性(効率性)
有効性は推定量の分散の大きさを表す概念で、測定を繰り返したときの推定量の誤差のばらつきが小さいことを指します。
分散が小さいほど推定値のばらつきが小さく、より信頼性が高いと言えます。
数学的には、推定量の分散 $${Var[\hat{\theta}(Y)]}$$ が小さいほど有効性が高いと判断します。
不偏推定量のうち, $${\theta}$$ がどのような値であっても分散を最小にするものを一様最小分散不偏推定量(uniformly minimum variance unbiased estimator)といいます。
頑健性
頑健性は、データに外れ値や想定外の分布が含まれていても、推定量の性能が大きく低下しない性質を指します。
頑健な推定量は、理想的な条件が満たされない現実世界のデータ分析において特に重要です。
クラメール・ラオ(Cramér-Rao)の下限
推定量の分散にはある下限が存在し、これをCramér-Raoの下限と呼びます。
この定理は、推定量の精度に関する理論的な基盤となります。
任意の不偏推定量 $${\hat{\theta}}$$ の分散は、常にFisher情報量 $${I(\theta)}$$ の逆数以上になります。
$${Var(\hat{\theta}) \geq \frac{1}{I(\theta)}}$$
ここで、Fisher情報量は$${ I(\theta) = E[U^2(\theta)] }$$で定義されます。
$${U(\theta)}$$ はスコア関数で、対数尤度関数の $${\theta}$$ に関する導関数です。
$${\begin{gathered}U(\theta) = \frac{d}{d\theta} \log[p(y;\theta)]\end{gathered}}$$
証明
Cauchy-Schwarz (コーシー・シュワルツ)の不等式
$$
\left(\sum_{i=1}^n a_i^2\right)\left(\sum_{i=1}^n b_i^2\right) \geqq\left(\sum_{i=1}^n a_i b_i\right)^2
$$
から導くことができます。
不偏推定量の定義から,以下の関係が成り立ちます.
$${\begin{gathered}\mathrm{E}[\widehat{\theta}]=\int \widehat{\theta} p(y ; \theta) d y=\theta\end{gathered}}$$
左辺を $${\theta}$$ で微分します。
対数微分の公式から、一般に$${\begin{gathered}\frac{d}{dx} \log f(x) = \frac{f'(x)}{f(x)}\end{gathered}}$$ です。
これを $${p(y;\theta)}$$ に適用すると、
$${\begin{gathered}\frac{d}{d\theta} \log p(y;\theta) = \frac{\frac{d}{d\theta}p(y;\theta)}{p(y;\theta)}\end{gathered}}$$
となります。
微分と積分の順序交換と期待値の定義から、
$${\begin{gathered}\frac{d}{d \theta} \int \widehat{\theta} p(y ; \theta) d y = \int \widehat{\theta} \frac{d}{d \theta}p(y ; \theta) d y = \int \widehat{\theta} U(\theta) p(y ; \theta) dy\end{gathered}}$$
これは $${\widehat{\theta}}$$ と $${U(\theta)}$$ の積の期待値の定義そのものです。
従って微分と積分が交換可能であれば、
$${\begin{gathered}\frac{d}{d \theta} p(y ; \theta)=p(y ; \theta) \frac{d}{d \theta} \log [p(y ; \theta)]=p(y ; \theta) U(\theta)\end{gathered}}$$
ですから、
$${\begin{aligned}\frac{d}{d \theta} \int \widehat{\theta} p(y ; \theta) d y=\int \widehat{\theta} U(\theta) p(y ; \theta) d y=\mathrm{E}[\widehat{\theta} U(\theta)]\end{aligned}}$$
が成り立ちます.
確率分布の性質として全確率は1であることから、
$${\begin{gathered}E[U(\theta)] = \int U(\theta)p(y;\theta)dy = \int \frac{d}{d\theta}p(y;\theta)dy = \frac{d}{d\theta}\int p(y;\theta)dy = \frac{d}{d\theta}1 = 0\end{gathered}}$$
となります。
つまりスコア関数の期待値はゼロとなるので、共分散の定義
$${\text{Cov}[X, Y] = \mathrm{E}[XY] - \mathrm{E}[X]\mathrm{E}[Y]}$$
から、
$${\text{Cov}[\hat{\theta}, U(\theta)] = \mathrm{E}[\hat{\theta}U(\theta)] - \mathrm{E}[\hat{\theta}]\mathrm{E}[U(\theta)]}$$
であるので、
$${\mathrm{E}[\widehat{\theta} U(\theta)]=\operatorname{Cov}[\widehat{\theta} U(\theta)]}$$
となります。
右辺を $${\theta}$$ で微分した結果を考えると、$${\begin{gathered}\frac{d}{d \theta} \theta=1\end{gathered}}$$なので、$${\operatorname{Cov}[\widehat{\theta} U(\theta)]=1}$$であることがわかります.
Cauchy-Schwarz の不等式により
$${\operatorname{Var}(\widehat{\theta}) I(\theta)=\operatorname{Var}(\widehat{\theta}) \operatorname{Var}[U(\theta)] \geq \operatorname{Cov}^2[\widehat{\theta} U(\theta)]=1}$$
ですから、$${\begin{gathered}Var(\hat{\theta}) \geq \frac{1}{I(\theta)}\end{gathered}}$$が成り立ちます.
要約すると、任意の不偏推定量の分散と Fisher 情報量 $${I(\theta)}$$ には$${\begin{aligned}\operatorname{Var}(\widehat{\theta}) \geq \frac{1}{I(\theta)}\end{aligned}}$$という関係があり, Fisher 情報量の逆数より分散が小さい不偏推定量は存在しないということになります。

import numpy as np
import matplotlib.pyplot as plt

# パラメータ設定
true_mean = 0
true_std = 1
sample_sizes = np.logspace(1, 3, 100).astype(int)  # 細かいサンプルサイズの範囲
n_simulations = 10000  # シミュレーション回数

# シミュレーション関数
def simulate_mean_estimator(size):
    samples = np.random.normal(true_mean, true_std, (n_simulations, size))
    return np.mean(samples, axis=1)

# 理論値とシミュレーション結果の計算
cr_lower_bounds = true_std**2 / sample_sizes
simulated_variances = [np.var(simulate_mean_estimator(size)) for size in sample_sizes]

# プロットの設定
plt.figure(figsize=(3, 2))
plt.plot(sample_sizes, cr_lower_bounds, 'r-', linewidth=0.3, label="Cramér-Rao Lower Bound")
plt.plot(sample_sizes, simulated_variances, 'b-', linewidth=0.3, alpha=0.7, label="Simulated Variance")
plt.xscale('log')
plt.yscale('log')
plt.xlabel('Sample Size', fontsize=4)
plt.ylabel('Variance', fontsize=4)
plt.title('Cramér-Rao Lower Bound vs Simulated Variance\nfor Normal Distribution Mean Estimation', fontsize=4)
plt.legend(fontsize=4)
plt.grid(True, which="both", ls="-", alpha=0.2)

# 軸のtickを調整
plt.tick_params(axis='both', which='major', labelsize=4)

# 余白を調整
plt.tight_layout()

plt.show()
具体的な例:正規分布の真の平均の推定
正規分布 $${N(\mu, \sigma^2)}$$ からのサンプル $${X_1, X_2, ..., X_n}$$ に基づいて、真の平均 $${\mu}$$ を推定する場合を考えます。
標本平均
標本平均 $${\begin{gathered}\bar{X} = \frac{1}{n}\sum_{i=1}^n X_i\end{gathered}}$$ は $${\mu}$$ の不偏推定量として広く用いられます。
不偏性:$${E[\bar{X}] = \mu}$$
分散:$${\begin{gathered}Var(\bar{X}) = \frac{\sigma^2}{n}\end{gathered}}$$
正規分布の対数尤度関数は$${\begin{gathered}l(\mu) = -\frac{n}{2}\log(2\pi\sigma^2) - \frac{1}{2\sigma^2}\sum_{i=1}^n (X_i - \mu)^2\end{gathered}}$$です。
これからスコア関数を計算すると、$${\begin{gathered}U(\mu) = \frac{1}{\sigma^2}\sum_{i=1}^n (X_i - \mu)\end{gathered}}$$となります。
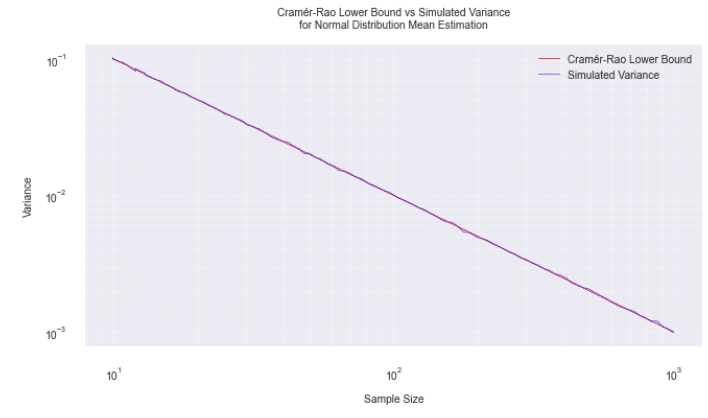
Fisher 情報量は$${\begin{gathered}I(\mu) = E[U^2(\mu)] = \frac{n}{\sigma^2}\end{gathered}}$$ですから、Cramér-Raoの下限は$${\begin{gathered}\frac{1}{I(\mu)} = \frac{\sigma^2}{n}\end{gathered}}$$となります
これは標本平均の分散と一致しますから、標本平均は Cramér-Raoの下限を達成する最適な推定量であることがわかります。
中央値
サンプルの中央値も $${\mu}$$ の推定量として使用することができます。
不偏性:大標本では近似的に不偏となります
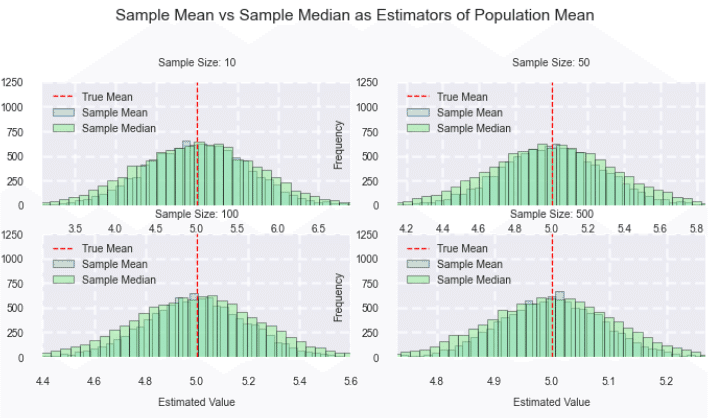
分散:$${\begin{gathered}Var(中央値) \approx \frac{\pi\sigma^2}{2n}\end{gathered}}$$ (大標本近似)
二者の比較

正規分布の場合、標本平均は中央値よりも分散が小さいという意味では効率的ですが、外れ値がある場合は中央値の方が頑健な推定となります。
import numpy as np
import matplotlib.pyplot as plt
from scipy import stats

# パラメータ設定
true_mean = 5
true_std = 2
sample_sizes = [10, 50, 100, 500]
n_simulations = 10000

# 推定量の計算
def estimate_mean(data):
    return np.mean(data)

def estimate_median(data):
    return np.median(data)

# シミュレーション
results = {size: {'mean': [], 'median': []} for size in sample_sizes}

for size in sample_sizes:
    for _ in range(n_simulations):
        sample = np.random.normal(true_mean, true_std, size)
        results[size]['mean'].append(estimate_mean(sample))
        results[size]['median'].append(estimate_median(sample))

# プロットのスタイル設定
plt.style.use('seaborn')
plt.rcParams['font.size'] = 2
plt.rcParams['axes.labelsize'] = 2
plt.rcParams['axes.titlesize'] = 2
plt.rcParams['xtick.labelsize'] = 2
plt.rcParams['ytick.labelsize'] = 2
plt.rcParams['legend.fontsize'] = 2
plt.rcParams['figure.titlesize'] = 2

# プロット
fig, axs = plt.subplots(2, 2, figsize=(6, 6))
fig.suptitle('Sample Mean vs Sample Median as Estimators of Population Mean', fontsize=6)

for i, size in enumerate(sample_sizes):
    ax = axs[i//2, i%2]
    ax.hist(results[size]['mean'], bins=50, alpha=0.5, label='Sample Mean', color='skyblue', edgecolor='black')
    ax.hist(results[size]['median'], bins=50, alpha=0.5, label='Sample Median', color='lightgreen', edgecolor='black')
    ax.axvline(true_mean, color='red', linestyle='dashed', linewidth=0.5, label='True Mean')
    ax.set_title(f'Sample Size: {size}', fontsize=4)
    ax.set_xlabel('Estimated Value', fontsize=4)
    ax.set_ylabel('Frequency', fontsize=4)
    ax.legend(loc='upper left', fontsize=4)

    # x軸とy軸の範囲を設定
    ax.set_xlim(true_mean - 3*true_std/np.sqrt(size), true_mean + 3*true_std/np.sqrt(size))
    ax.set_ylim(0, n_simulations/8)  # ヒストグラムの最大高さを調整

    # グリッドを追加
    ax.grid(True, linestyle='--', alpha=0.7)

    # 軸のtickを調整
    ax.tick_params(axis='both', which='major', labelsize=4)


# サブプロット間の間隔を調整
plt.subplots_adjust(left=0.9, right=0.9, top=0.9, bottom=0.9, wspace=0.1, hspace=0.1)


plt.tight_layout(rect=[0, 0.1, 1, 0.85])  # タイトルのためのスペースを確保

# 統計量の計算と出力
print("\nEstimator Statistics:")
print("=====================")
for size in sample_sizes:
    print(f"\nSample Size: {size}")
    for estimator in ['mean', 'median']:
        estimates = results[size][estimator]
        bias = np.mean(estimates) - true_mean
        variance = np.var(estimates)
        mse = bias**2 + variance
        print(f"{estimator.capitalize()}:")
        print(f"  Bias: {bias:.4f}")
        print(f"  Variance: {variance:.4f}")
        print(f"  MSE: {mse:.4f}")

plt.show()
各推定量には以下のような限界があります。
不偏性と有効性はトレードオフ
不偏推定量が常に最良とは限らず、バイアスがあっても分散が小さい推定量が有用な場合があります。頑健性の重要性
先の例のように理論的に優れた推定量でも、実データでは外れ値や想定外の分布が含まれることによるバイアスが発生することがあります。モデルの妥当性
推定量の性質は特定の確率モデルを仮定して導出されます。
現実のデータがこの仮定に従わない場合、推定量の性能が低下する可能性があります。
結論
推定量の性質を理解することは、データ分析の信頼性を高める上でとても重要です。
不偏性、有効性、頑健性という3つの主要な概念は、それぞれ推定量の異なる側面を評価しており、実際のデータ分析ではこれらの性質のバランスを考慮しつつ、問題に適した推定方法を選択することが求められます。
