
Photo by
yumihipiri_17
E検定対策(6) - K近傍法を用いた分類

今回はK近傍法( K-Nearest Neighbors Classification )の勉強をしました。
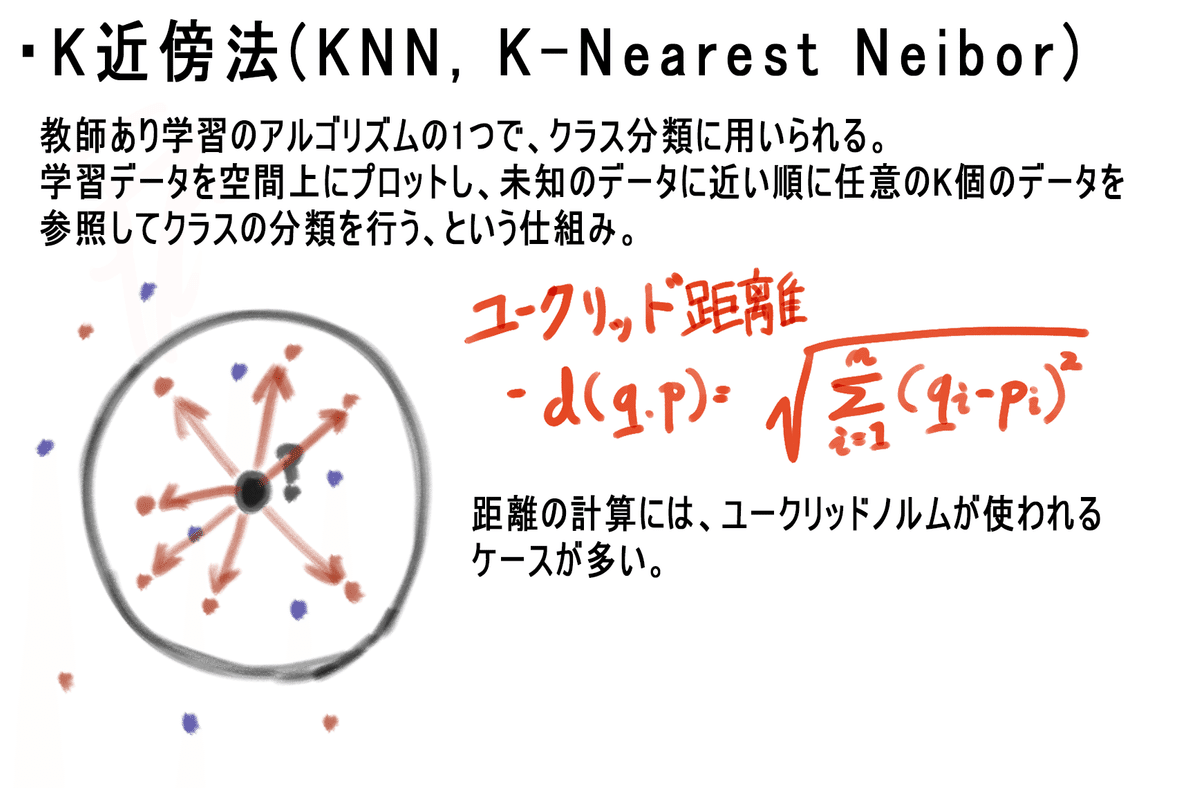
K近傍法とは
K近傍法を使ったIrisデータセットの分類
#必要なライブラリーをインポート
import matplotlib.pyplot as plt
import seaborn as sns
from matplotlib.colors import ListedColormap
from sklearn import neighbors, datasets
from sklearn.inspection import DecisionBoundaryDisplay

#Irisデータセットをロード
iris = datasets.load_iris()

#データの内、説明変数の最初の2つを利用する
X = iris.data[:, :2]
y = iris.target

# カラーマップを作成
cmap_light = ListedColormap(["orange", "cyan", "cornflowerblue"])
cmap_bold = ["darkorange", "c", "darkblue"]

n_neighbors = 15

for weights in ["distance"]:
    #K近傍法を使ってデータをプロットする
    clf = neighbors.KNeighborsClassifier(n_neighbors, weights=weights)
    clf.fit(X, y)

    _, ax = plt.subplots()
    DecisionBoundaryDisplay.from_estimator(
        clf,
        X,
        cmap=cmap_light,
        ax=ax,
        response_method="predict",
        plot_method="pcolormesh",
        xlabel=iris.feature_names[0],
        ylabel=iris.feature_names[1],
        shading="auto",
    )

    #トレーニングに使用したデータをプロット
    sns.scatterplot(
        x=X[:, 0],
        y=X[:, 1],
        hue=iris.target_names[y],
        palette=cmap_bold,
        alpha=1.0,
        edgecolor="black",
    )
    plt.title(
        "3-Class classification (k = %i, weights = '%s')" % (n_neighbors, weights)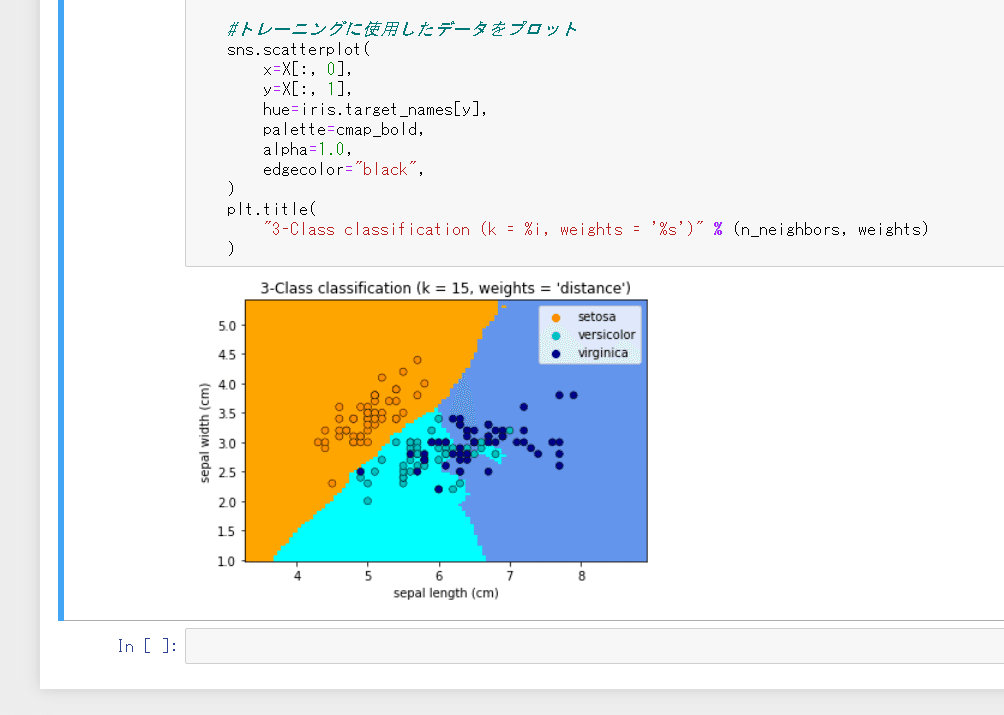
もともとデータの説明変数が2つでは足りないこともあってか、今回は精度は低めです。次回はTensorflowを使った教師なし学習・主成分分析( PCA )について書く予定です。楽しみですね!