
2025年2月20日木曜日分 日経平均予想 & 1570 日経レバ 日証金 貸借取引残高 など

こんばんは!& おはようございます! 2月20日木曜日分 1570 日経レバ 日証金 貸借取引残高速報 & センチメント指数 の読み解きです。
本投稿は、私の日々のオプション取引・株式取引の指差しデータ確認・日記です。私自身のトレード準備の一環として投稿しています。
オプションや個別銘柄などを推奨するものではありませんので、どうかご理解くださいませ。
◼️本日時間が不足していたため、足りないところは追記していきます。
2月19日水曜日の振り返り
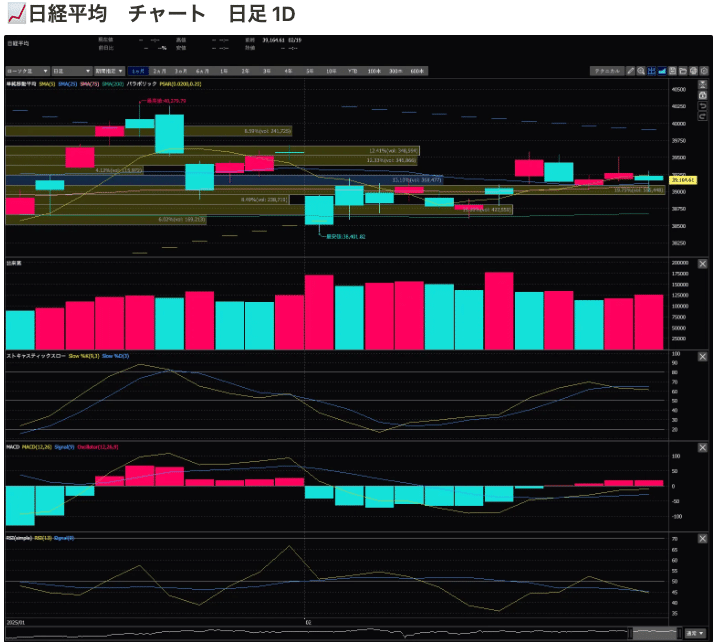
日経平均は39,164.61円 -105.79 東証一部出来高1,868(百万株)でした。 東証一部出来高は、前日の出来高1,827(百万株)とほぼ変わらずです。これで3日連続ほぼ変わらない出来高です。
今朝の先物(6時過ぎ)は38980円です。ようやく動きました。

昨夜2月20日木曜日0時台に38750でした。
先にドル円を見ると(朝8時28分)。

8時28分 151.324です。
153.479、154.115のトレンドラインを下回っています。下落トレンドの中です。
上昇する場合には、このあたりを上回れるかに注目。下落側は150.925近くまで下がるかどうかに着目です。
日経225オプションラージ3限月
日経先物は朝6時の時点で38980です。
コール側
39500コール 365 最終取引時間 060001 建玉/売買代金 4174/33625 IV 15.76
40000コール 215 最終取引時間 055413 建玉/売買代金 5477/52010 IV 15.39
41000コール 63 最終取引時間 054532 建玉/売買代金 6554/16141 IV 15.45
昨夜一度下がってから上昇してきているのですでに動いた後。
合成ポジションを構築するタイミングだったと思います。
プット側
38500プット 420 最終取引時間 055412 建玉/売買代金 7409/41270 IV 16.47
38000プット 290 最終取引時間 055452 建玉/売買代金 7076/84490 IV 17.61
こちらは、現状では見るところが少ないかもしれません。
ミニ日経225オプション 25/02/3W
コール側
39000コール 110 最終取引時間 055444 建玉/売買代金 134/4593 IV 14.68
39500コール 8 最終取引時間 060001 建玉/売買代金 809/1870 IV 13.48
40000コール 4 最終取引時間 053409 建玉/売買代金 2203/104 IV 14.56
プット側
39000プット 120 最終取引時間 055251 建玉/売買代金 1424/12596 IV 12.85
38500プット 20 最終取引時間 055352 建玉/売買代金 1249/3197 IV 16.20
38250プット 4 最終取引時間 060001 建玉/売買代金 760/831 IV 17.64
すでに動いた後、かつ25/02/3Wは明日がSQですので無理に探さなくても良いのかもしれません。
(13時7分 追記)
38500プット 20 → 130
6倍以上になりました。上記の状態でもIVが16.20です。価格はまだもう少し上昇するでしょうか。
DC 日足

2月18日火曜日からトレンドライン下で、下落トレンド中です。
上昇する場合は、39465、39400が目安となります。
VIX・日経平均VI・日経平均VI先物
VIX(米国)

15.26です。陰の下伺い陽線です。周期的に上昇していることに留意した方が良いでしょう。
日経平均VIチャート日足

19.85です。3連陰線、下伺いの陰線です。
日経平均VI先物チャート時間足

21.80です。下降しています。
25に近づくにつれ、PostPrimeセンチメント指数の読み解きがしづらくなっていく傾向があります。そのため、PostPrimeセンチメント指数の読み解きは飛ばします。
さて。読み解きをしていきましょう。
日証金 貸借取引残高速報

読み解き
買い方悪化する以上に売り方良化のため、需給良化です。
回転日数5.7で活況でした。
出来高はほぼ横ばい。4000000弱でした。少なめです。海外投資家が増えている印象はありません。

空売り比率(日経)

機関投資家の空売り比率が上昇し、個人投資家の空売り比率が減少しました。
トータルで空売り比率は38.9です。過去5日平均と比較すると上回っています。
昨日よりは上昇しています。
騰落レシオ(日経)

6日騰落レシオは平熱圏
10日騰落レシオも平熱圏
15日騰落レシオも平熱圏
です。ここから読み解くのは難しいように思います。
業種別ランキング

輸送用機器(東証) は-56.8、-1.30%でした。
日経平均先物

2月20日木曜日1時台に38750でした。
PostPrimeセンチメント指数
(掲載・解説を飛ばします)
2月20日木曜日はどうするか
合成ポジションを構築するタイミングと思っています。
日経平均株価 月足→年足→週足→日足

月足で見たら、現在は調整期間といえます。

週足で見ると一定のレンジを上下しているのがわかりますね。

参考:SP500・Dow・Nasdaq
SP500、Nasdaq、ダウや金先物の価格などを一覧でまとめて見るサイトが、YouTuberの分析でよく使われているのを見るのです、、、自分は酒田五法で見たいので、使えないのです。そのため手間ですが一つ一つ個別に添付して見ています。
NYダウ チャート日足

NASDAQ チャート日足

S&P500 チャート日足

参考:Fear&Greed Index

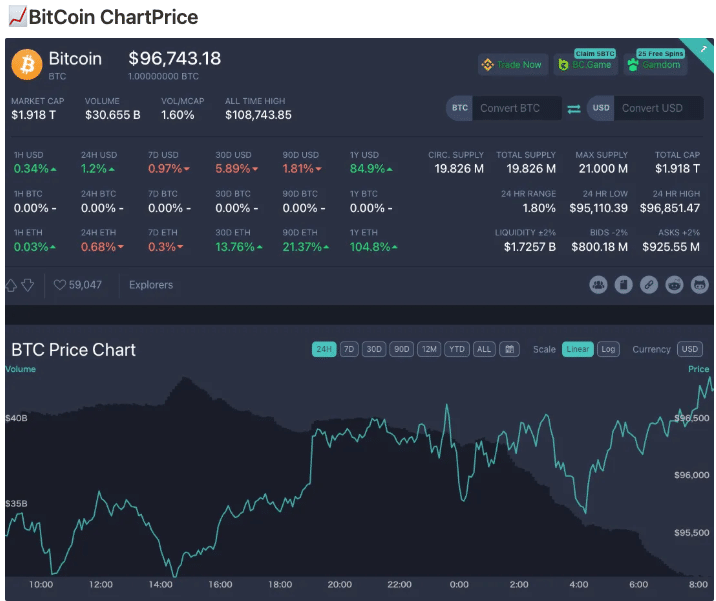
参考:BitCoin
参考:フィラデルフィア半導体株指数

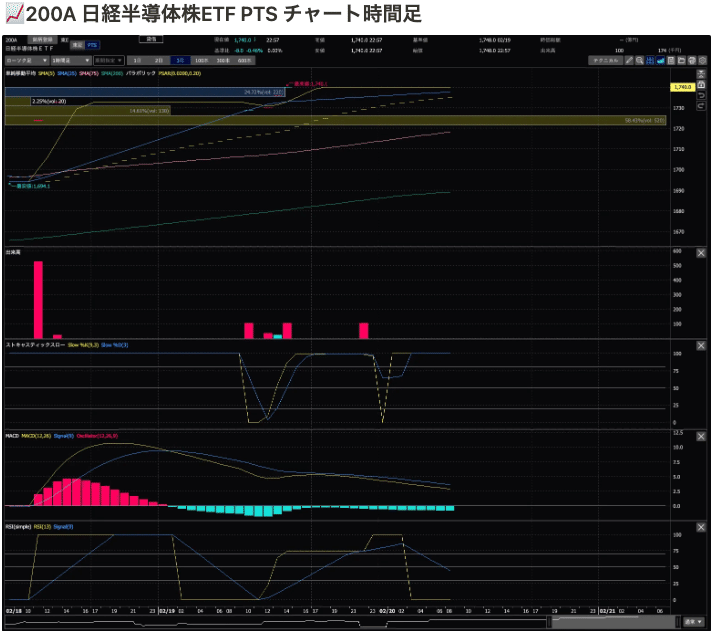
参考:200A 日経半導体指数

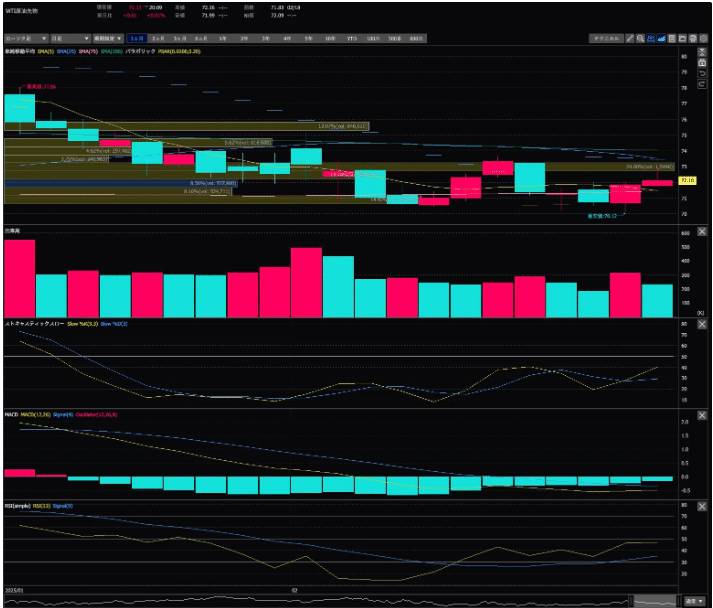
参考:WTI原油先物

参考:金先物

参考:香港ハンセン


参考:上海総合
