Photo by
shunsukesatake
Pythonでハイセンスなグラフ作成〜matplotlibスタイル一覧

ほぼ自分の学習記録のためですが、pythonのグラフ描画に使うmatplotlib。このグラフスタイルのギャラリーです。
初学者の方のご参考になれば幸いです🏃♂️
使えるスタイルを表示
print(plt.style.available)'seaborn-dark',
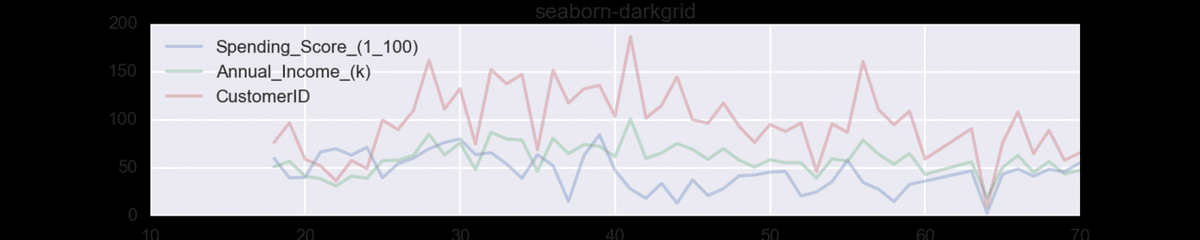
'seaborn-darkgrid',
'seaborn-ticks',
'fivethirtyeight',
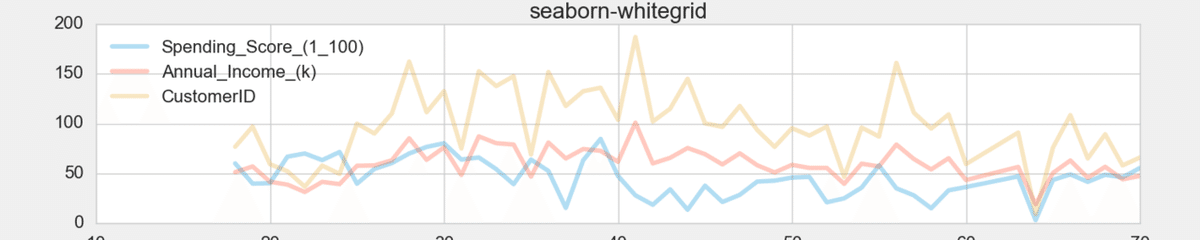
'seaborn-whitegrid',
'classic',
'_classic_test',
'fast',
'seaborn-talk',
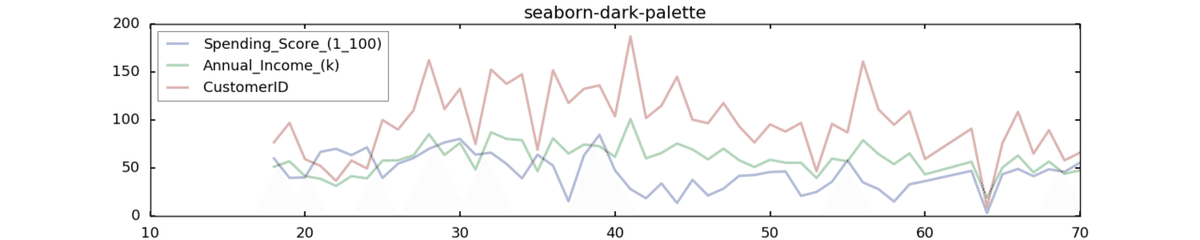
'seaborn-dark-palette',
'seaborn-bright',
'seaborn-pastel',
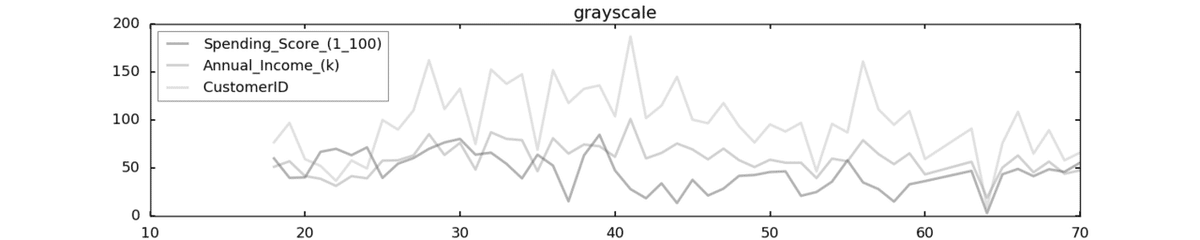
'grayscale',
'seaborn-notebook',
'ggplot',
'seaborn-colorblind',
'seaborn-muted',
'seaborn',
'Solarize_Light2',
'seaborn-paper',
'bmh',
'seaborn-white',
'dark_background',
'seaborn-poster',
'seaborn-deep'
データは下記から取得
各値にこれと言った意味はありません。
plt.style.use('seaborn-dark')

plt.style.use('seaborn-darkgrid')
plt.style.use('seaborn-ticks')

plt.style.use('fivethirtyeight')

plt.style.use('seaborn-whitegrid')
plt.style.use('classic')

plt.style.use('_classic_test')

plt.style.use('fast')

plt.style.use('seaborn-talk')

plt.style.use('seaborn-dark-palette')
plt.style.use('seaborn-bright')

plt.style.use('seaborn-pastel')

plt.style.use('grayscale')
plt.style.use('seaborn-notebook')

plt.style.use('ggplot')

plt.style.use('seaborn-colorblind')

plt.style.use('seaborn-muted')

plt.style.use('seaborn')

plt.style.use('Solarize_Light2')

plt.style.use('seaborn-paper')

plt.style.use('bmh')

plt.style.use('seaborn-white')

plt.style.use('dark_background')

plt.style.use('seaborn-poster')

plt.style.use('seaborn-deep')

参考にさせていただいたサイト
いいなと思ったら応援しよう!