import matplotlib.pyplot as plt
import numpy as np
import random
import matplotlib
from matplotlib import rcParams
import matplotlib.colors as mcolors
rcParams['pdf.fonttype'] = 42
plt.rcParams.update({'font.size': 10})
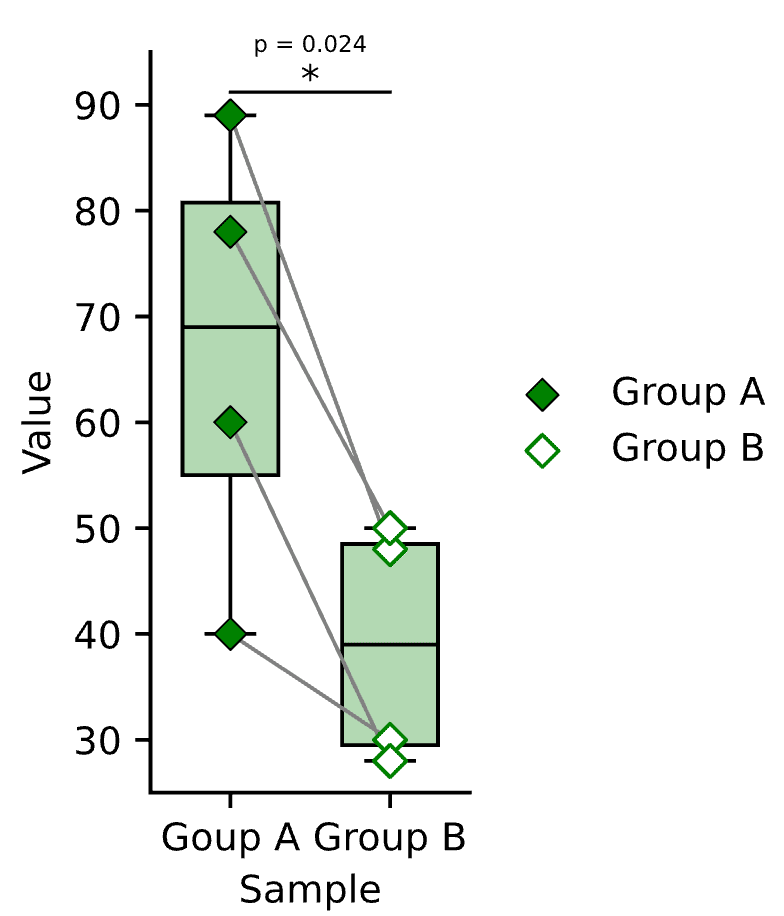
values_groups = [
[40, 89, 78, 60],
[30, 48, 50, 28]
]
x_positions = list(range(1, 3))
colors = ['green', 'green']
markers = ['D', 'D']
labels = [
'Group A', 'Group B'
]
plt.figure(figsize=(1.5, 3.5))
for i, values in enumerate(values_groups):
x_positions_group = [x_positions[i]] * len(values)
color_with_alpha = mcolors.to_rgba(colors[i], alpha=0.3)
plt.boxplot(values, positions=[x_positions[i]], widths=0.6, patch_artist=True,
boxprops=dict(facecolor=color_with_alpha, edgecolor='black', linewidth=1),
medianprops=dict(color='black'),
whiskerprops=dict(color='black'),
capprops=dict(color='black'),
flierprops=dict(marker='o', color='black', alpha=0.5))
for n in range(0, len(values_groups) - 1, 2):
group1_values = values_groups[2 * n]
group2_values = values_groups[2 * n + 1]
group1_x = [x_positions[2 * n]] * len(group1_values)
group2_x = [x_positions[2 * n + 1]] * len(group2_values)
for idx in range(min(len(group1_values), len(group2_values))):
x1 = group1_x[idx]
x2 = group2_x[idx]
y1 = group1_values[idx]
y2 = group2_values[idx]
plt.plot([x1, x2], [y1, y2], color='gray', linestyle='-', linewidth=1, zorder=3)
for i, values in enumerate(values_groups):
x_positions_group = [x_positions[i]] * len(values)
for i, values in enumerate(values_groups):
x_positions_group = [x_positions[i]] * len(values)
marker_style = markers[i % len(markers)]
if (i + 1) % 2 == 0:
plt.scatter(x_positions_group, values, edgecolors=colors[i], marker=marker_style, facecolors='White', label=labels[i], zorder=4)
else:
plt.scatter(x_positions_group, values, color=colors[i],edgecolors='black',linewidth=0.5, marker=marker_style, label=labels[i], zorder=4)
from scipy.stats import ttest_rel
p_values = []
for i in range(0, len(values_groups) - 1, 2):
t_stat, p_value = ttest_rel(values_groups[i], values_groups[i + 1])
p_values.append((f'Group {i + 1} vs Group {i + 2}', p_value))
for i, (comparison, p_value) in enumerate(p_values):
group1 = i * 2 + 1
group2 = i * 2 + 2
x_mid = (x_positions[group1 - 1] + x_positions[group2 - 1]) / 2
y_max = max(max(values_groups[group1 - 1]), max(values_groups[group2 - 1]))
plt.plot([x_positions[group1 - 1] , x_positions[group2 - 1] ], [y_max + 2.2, y_max + 2.2], color='black',linewidth=0.9)
if p_value < 0.05:
if p_value < 0.0001:
plt.text(x_mid, y_max + 2.2, '***', ha='center', color='black')
elif p_value < 0.001:
plt.text(x_mid, y_max + 2.2, '**', ha='center', color='black')
else:
plt.text(x_mid, y_max + 2.2, '*', ha='center', color='black')
if p_value < 0.0005:
formatted_p_value = f'{p_value:.5f}'
elif p_value < 0.005:
formatted_p_value = f'{p_value:.4f}'
elif p_value < 0.05:
formatted_p_value = f'{p_value:.3f}'
else:
formatted_p_value = f'{p_value:.2f}'
plt.text(x_mid, y_max + 6, f'p = {formatted_p_value}', ha='center', color='black', fontsize=6)
else:
plt.text(x_mid, y_max + 3, 'n.s.', ha='center', color='black')
formatted_p_value = f'{p_value:.3f}'
plt.text(x_mid, y_max + 6, f'p = {formatted_p_value}', ha='center', color='black', fontsize=6)
plt.gca().spines['top'].set_visible(False)
plt.gca().spines['right'].set_visible(False)
plt.gca().spines['bottom'].set_linewidth(1)
plt.gca().spines['left'].set_linewidth(1)
plt.tick_params(axis='y', which='both', length=4, width=1)
plt.ylim(bottom=25, top=95)
plt.yticks([30, 40 , 50, 60 ,70, 80, 90])
plt.tick_params(axis='x', which='both', length=4, width=1)
plt.ylabel('Value')
plt.xticks(
x_positions,
['Goup A', 'Group B'],
)
plt.xlabel('Sample')
plt.grid(False)
plt.legend(loc='center left', bbox_to_anchor=(1, 0.5), frameon=False)
plt.savefig('Sample note.svg',transparent=False, bbox_inches="tight")
plt.show()

