reactでchart.js
reactにはrechartっていうのもあるんだけどあえてchart.jsを使う場合
install
npm install react-chartjs-2 chart.js
react-chartjs-2というのがキモである。
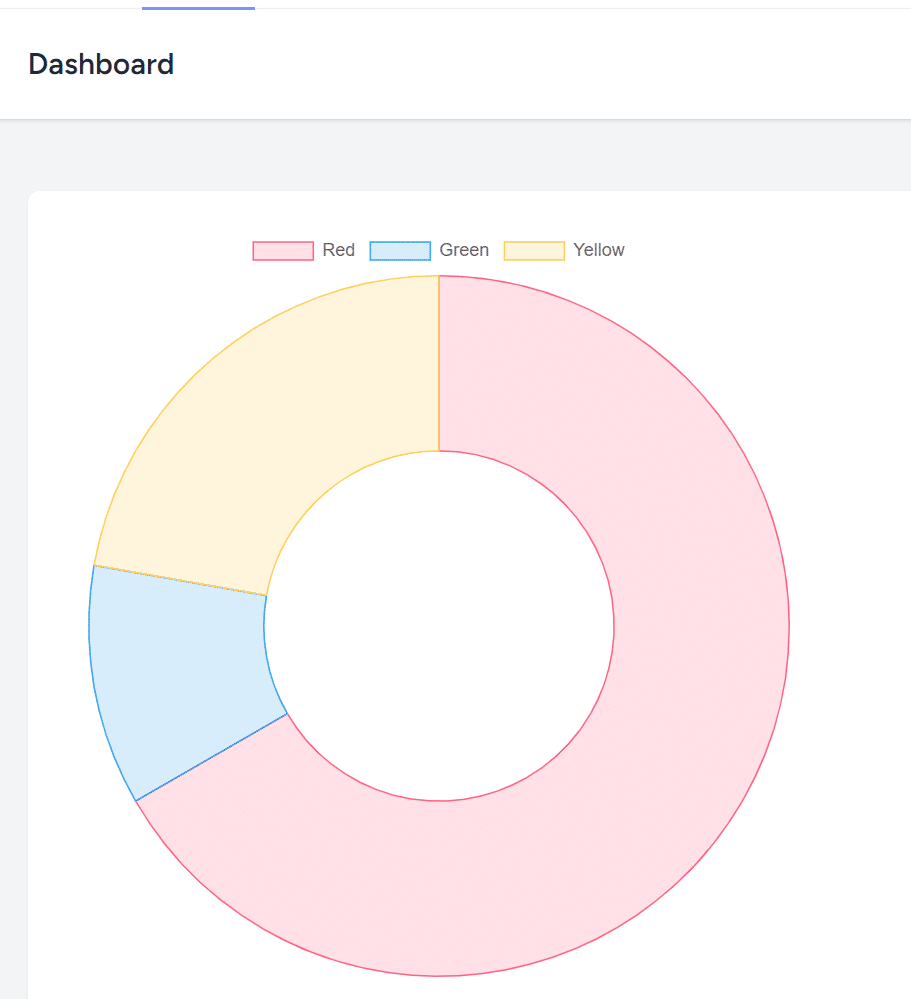
適当なスニペット
ここではinertiaのdashboardを適当に改造する
import { Head } from '@inertiajs/react';
import 'chart.js/auto';
import { Doughnut } from 'react-chartjs-2';
import AuthenticatedLayout from '@/Layouts/AuthenticatedLayout';

export default function Dashboard({ auth }) {
  // Define the data object for the Doughnut chart
  const data = {
    labels: ['Red', 'Green', 'Yellow'],
    datasets: [
      {
        data: [300, 50, 100],
        backgroundColor: [
          'rgba(255, 99, 132, 0.2)',
          'rgba(54, 162, 235, 0.2)',
          'rgba(255, 206, 86, 0.2)',
        ],
        borderColor: [
          'rgba(255, 99, 132, 1)',
          'rgba(54, 162, 235, 1)',
          'rgba(255, 206, 86, 1)',
        ],
        borderWidth: 1,
      },
    ],
  };

  return (
    <AuthenticatedLayout
      user={auth.user}
      header={<h2 className="font-semibold text-xl text-gray-800 leading-tight">Dashboard</h2>}
    >
      <Head title="Dashboard" />
      <div className="py-12">
        <div className="max-w-7xl mx-auto sm:px-6 lg:px-8">
          <div className="bg-white overflow-hidden shadow-sm sm:rounded-lg">
            <div className="p-6 text-gray-900">
              <Doughnut data={data} />  {/* Pass the data object here */}
            </div>
          </div>
        </div>
      </div>
    </AuthenticatedLayout>
  );
}

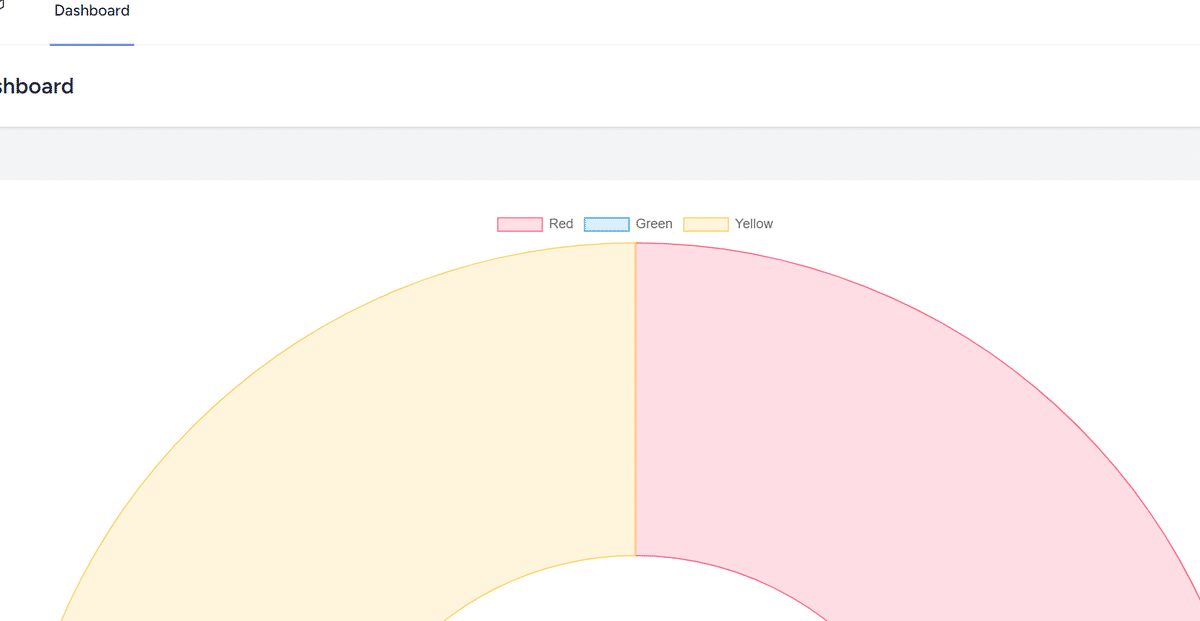
でかすぎるやろw
サイズの変更
まあこれは親要素を指定するのが一番楽かなと
            <div className="p-6 text-gray-900">
              <div style={{ width: '500px', height: '500px' }}>
                <Doughnut data={data} />  {/* Pass the data object here */}
              </div>
            </div>

