
Representing Data In Pie Chart

Pie chart is also known as a circle graph.
Let’s considered the following table which represents the data on the sports liked by several students

In a Pie Chart, the area of the whole circle represents the total number of data.
Consider the circle
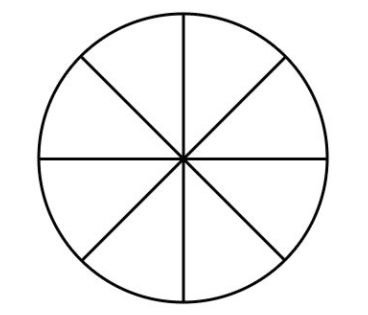
This circle has been divided into 8 equal sectors.
The angle around the center of the circle is 360°
READ MORE..