【第3章測定】練習問題3.9.1「 同性婚に関する意見の変化再考」
1.データセット
・第3章の練習問題を解く際に使うデータセットは、以下のリンク先からダウンロードできる。
2.練習問題3.9.1「同性婚に関する意見の変化再考」
(1)【研究1】コントロールグループの回答の相関係数
①第1波調査と第2波調査の回答の相関係数は約0.997
②第2派調査の回答の内、殆どが第1波調査と同じ回答になっている
> gayreshaped <- read.csv("gayreshaped.csv")
> ccap2012 <- read.csv("ccap2012.csv")

> dim(gayreshaped)
[1] 11948     6
> summary(gayreshaped)
     study                                                treatment        therm1
 Min.   :1.000   No Contact                                    :6441   Min.   :  0.00
 1st Qu.:1.000   Recycling Script by Gay Canvasser             :1046   1st Qu.: 48.00
 Median :1.000   Recycling Script by Straight Canvasser        :1039   Median : 52.00
 Mean   :1.204   Same-Sex Marriage Script by Gay Canvasser     :2389   Mean   : 58.43
 3rd Qu.:1.000   Same-Sex Marriage Script by Straight Canvasser:1033   3rd Qu.: 84.00
 Max.   :2.000                                                         Max.   :100.00

     therm2           therm3           therm4
 Min.   :  0.00   Min.   :  0.00   Min.   :  0.00
 1st Qu.: 45.00   1st Qu.: 44.00   1st Qu.: 44.00
 Median : 55.00   Median : 57.00   Median : 58.00
 Mean   : 58.68   Mean   : 59.72   Mean   : 59.76
 3rd Qu.: 84.00   3rd Qu.: 85.00   3rd Qu.: 85.00
 Max.   :100.00   Max.   :100.00   Max.   :100.00
 NA's   :1351     NA's   :9835     NA's   :9777

> dim(ccap2012)
[1] 43998     3
> summary(ccap2012)
       X             caseid          gaytherm
 Min.   :    1   Min.   :   1.0   Min.   :  0.00
 1st Qu.:11000   1st Qu.: 251.0   1st Qu.: 45.00
 Median :22000   Median : 501.0   Median : 54.00
 Mean   :22000   Mean   : 500.5   Mean   : 58.71
 3rd Qu.:32999   3rd Qu.: 751.0   3rd Qu.: 85.00
 Max.   :43998   Max.   :1001.0   Max.   :100.00
                                  NA's   :3097

> cor(gayreshaped$therm1[gayreshaped$study == 1 & gayreshaped$treatment == "No Contact"],
+     gayreshaped$therm2[gayreshaped$study == 1 & gayreshaped$treatment == "No Contact"],
+     use = "complete.obs")
[1] 0.9975817
(2)【研究2】コントロールグループの全回答の相関係数
・コントロールグループの第1〜4波調査の回答の相関係数は、
最低でも約0.9308と非常に高い値になっている。
> gayreshaped_2 <- gayreshaped[gayreshaped$study == 2 & gayreshaped$treatment == "No Contact",c(3,4,5,6)]


> cor(gayreshaped_2,use = "pairwise.complete.obs")
          therm1    therm2    therm3    therm4
therm1 1.0000000 0.9734449 0.9594085 0.9709017
therm2 0.9734449 1.0000000 0.9308287 0.9436621
therm3 0.9594085 0.9308287 1.0000000 0.9343249
therm4 0.9709017 0.9436621 0.9343249 1.0000000

> min(cor(gayreshaped_2,use = "pairwise.complete.obs"))
[1] 0.9308287
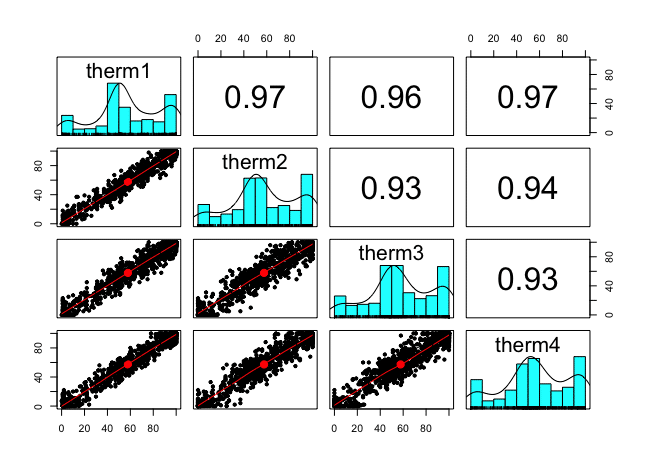
(3)【研究2】コントロールグループの全回答の散布図
・高い相関係数が示すように散布図も外れ値が少なく、45度線付近に
分布している
> install.packages("psych")
> library(psych)
> psych::pairs.panels(gayreshaped_2)
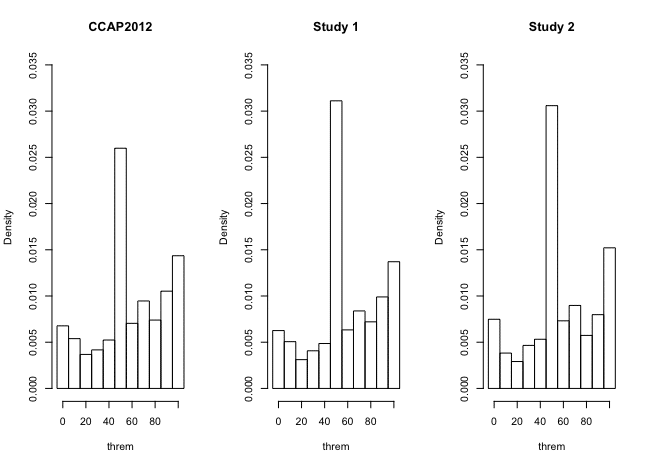
(4) 【CCAP2012】データと【研究1】&【研究2】データの比較(A)
①2つの標本における第1波調査回答のヒストグラムの形状は概ね同じ
②最頻値の密度【CCAP2012】より【研究1】&【研究2】の方が高い
③【研究1】&【研究2】は、【CCAP2012】の欠損値を最頻値で補正
して作成された可能性がある。
> summary(ccap2012$gaytherm)
   Min. 1st Qu.  Median    Mean 3rd Qu.    Max.    NA's
   0.00   45.00   54.00   58.71   85.00  100.00    3097

> summary(gayreshaped$therm1[gayreshaped$study == 1])
   Min. 1st Qu.  Median    Mean 3rd Qu.    Max.
   0.00   48.00   52.00   58.38   84.00  100.00

> summary(gayreshaped_2$therm1)
   Min. 1st Qu.  Median    Mean 3rd Qu.    Max.
   0.00   47.00   51.00   57.89   83.00  100.00

> par(mfrow = c(1,3))
> hist(ccap2012$gaytherm,freq = FALSE,
+      breaks = seq(from = -5,to = 105, by =10),ylim = c(0,0.035),xlab = "threm",main = "CCAP2012")

> hist(gayreshaped$therm1[gayreshaped$study == 1],freq = FALSE,
+      breaks = seq(from = -5,to = 105, by =10),ylim = c(0,0.035),xlab = "threm",main = "Study 1")

> hist(gayreshaped_2$therm1,freq = FALSE,
+      breaks = seq(from = -5,to = 105, by =10),ylim = c(0,0.035),xlab = "threm",main = "Study 2")

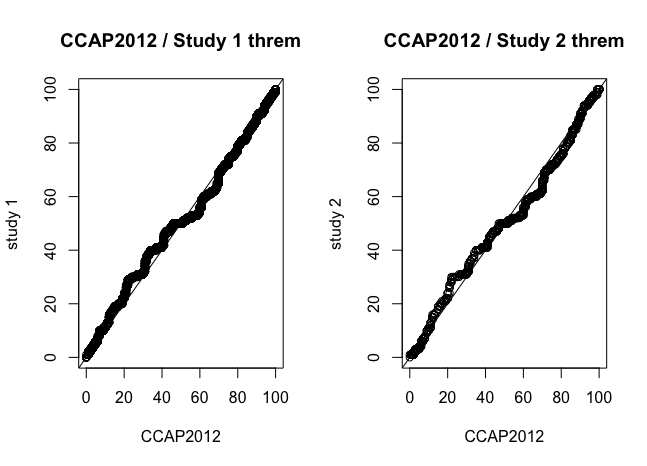
(5)【CCAP2012】データと【研究1】&【研究2】データの比較(B)
> par(mfrow = c(1,2))

> qqplot(ccap2012$gaytherm ,gayreshaped$therm1[gayreshaped$study == 1],xlim = c(0,100),ylim = c(0,100),xlab = "CCAP2012",ylab = "study 1",main = "CCAP2012 / Study 1 threm")
> abline(0,1)

> qqplot(ccap2012$gaytherm ,gayreshaped_2$therm1,xlim = c(0,100),ylim = c(0,100),xlab = "CCAP2012",ylab = "study 2",main = "CCAP2012 / Study 2 threm")
> abline(0,1)

3.練習問題を解いた感想
・散布図行列の描画方法を調べたところ「psych」パッケージを知った。シンプルにpairs関数でも散布図行列は作成できるが、このパッケージを使った方が、ヒストグラムや相関係数も合わせて記載できて便利だった。
・参考にさせて貰ったサイトを見ると、他にも興味深い描画方法がある。今後も練習問題を解く際に活用してみたい。
この記事が気に入ったらサポートをしてみませんか?
