
secondary axis 副次的な軸 (matplotlib)

ある単位について、それと連動する他の量がある場合、参考のため、上下や左右に違う目盛りを振りたくなることがあります。そのスクリプト例。尺度の変換の行きと帰り両方の関数を用意してやって、あたえればよいそうです。
下の目盛りは光の波長、上の目盛りは光のエネルギーなかんじで枠を作ってみました。
例では上にsecondary axis を作っていますが、
secondary_xaxis → secondary_yaxis
top → right
として、y軸についても同様のことができます。
#"secondary_axis.py"
import matplotlib.pyplot as plt

fig,ax = plt.subplots()

ax.set_xlim([500,700])

def nm2eV(x):
    return 1.23984e3/x
def eV2nm(x):
    return 1.23984e3/x

secax = ax.secondary_xaxis('top',functions=(nm2eV,eV2nm))

ax.set_xlabel(r"$\lambda$ [nm]")
secax.set_xlabel("$E$ [eV]")
ax.set_ylabel("y label")

plt.ion()
plt.show()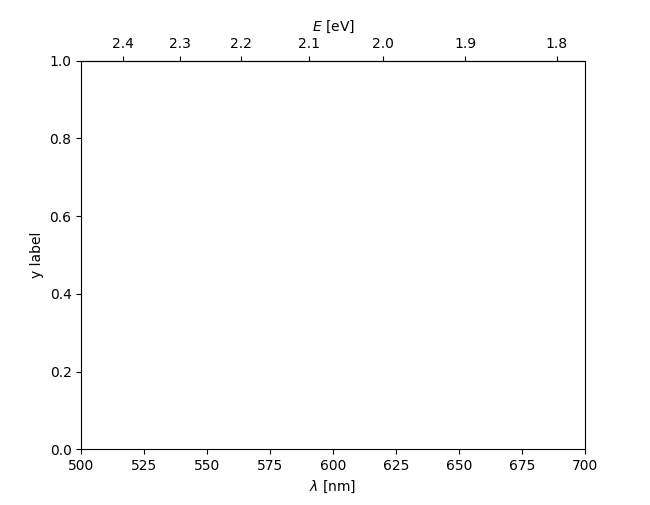
ちょくちょく使いたくなるわりに、いつもやり方を見失うのでメモっておきます。
参考URL:https://matplotlib.org/stable/gallery/subplots_axes_and_figures/secondary_axis.html