
Python初心者が行う、"アメリカの中古車価格予測"
はじめに
自己紹介
コンテンツ監査オペレーションの管理職約5年→Aidemy Premiumにて「データ分析コース」を6ヶ月受講、現在3ヶ月目となります。
Aidemyを受講するきっかけは現職でデータを見ることが多く、データから業務の改善に繋げるようなこともあり、楽しさもあったことから次のステップとしてデータ分析、機械学習、Pythonを学んで行きたいという思いで受講を開始しました。
「このブログはAidemy Premiumのカリキュラムの一環で、受講修了条件を満たすために公開しています。」
本記事は実際に習った内容を活用してアメリカ中古車の価格を予測します。
実行環境
Google Colaboratory
目的
今回の目的はアメリカの1997年~2018年迄の中古車価格を予想します。
習った内容を実際に扱って予測、モデル学習をやっていきたいと思います。
1.ライブラリとデータの準備
Google Colaboratoryに必要なライブラリを読み込みます。
import pandas as pd
import numpy as np
import matplotlib.pyplot as plt
import seaborn as sns
from matplotlib_venn import venn2
%matplotlib inline
sns.set()

import os
for dirname, _, filenames in os.walk('/content/drive/MyDrive/Colab Notebooks/data'):
  for filename in filenames:
    print(os.path.join(dirname, filename))

from google.colab import drive
drive.mount('/content/drive')
データの読み込み
df = pd.read_csv('/content/drive/MyDrive/Colab Notebooks/data/true_car_listings.csv')
df.head()

データの中身の説明
Price: 価格(US$)
Year: 年式(車の製造年)
Mileage: 走行距離
City: 販売都市
State: 販売州
Vin: 個体識別番号
Make: 製造メーカー名
Model: 車種名-ミッション
これだけではデータがどんな感じなのかわかりませんので、もっと詳しく見ていきます。
#テストデータの形
df.shape
(852122, 8)
#Data type
df.dtypes
Price int64
Year int64
Mileage int64
City object
State object
Vin object
Make object
Model object
dtype: object
#欠損値の確認
df.isnull().sum()
Price 0
Year 0
Mileage 0
City 0
State 0
Vin 0
Make 0
Model 0
dtype: int64
#統計量の確認
df.describe(include='all')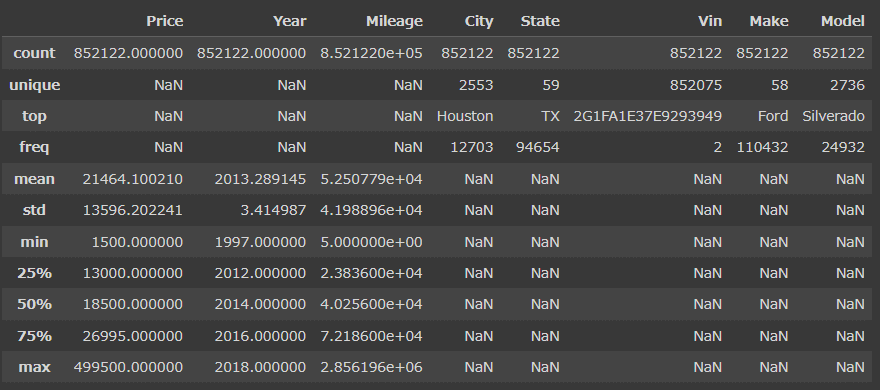
2.データをグラフ化
#可視化
plt.scatter(df["Year"], df["Price"])
plt.xlabel("Year")
plt.ylabel("Price")
plt.title("Price and Year")
plt.show()

plt.scatter(df["Mileage"], df["Price"])
plt.xlabel("Mileage")
plt.ylabel("Price")
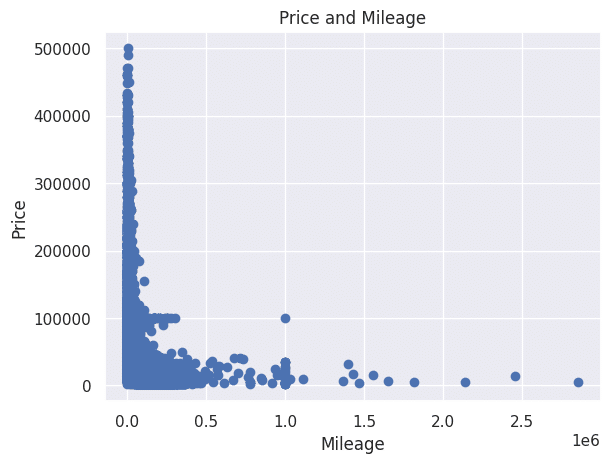
plt.title("Price and Mileage")
plt.show()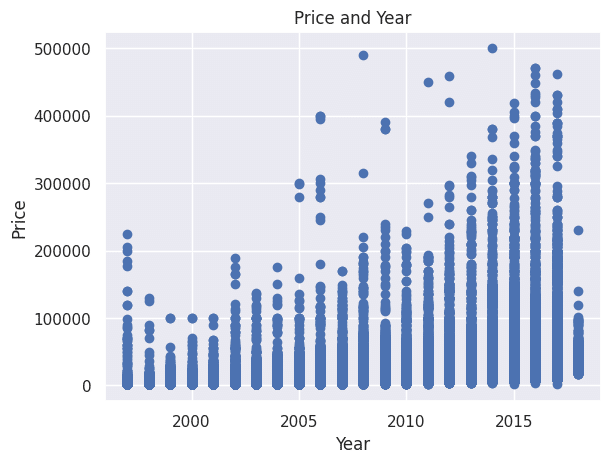
#Price ヒストグラム
plt.hist(df['Price'], bins=100, density=True)
plt.xlabel("Price")
plt.xlim(0, 80000)
plt.show()
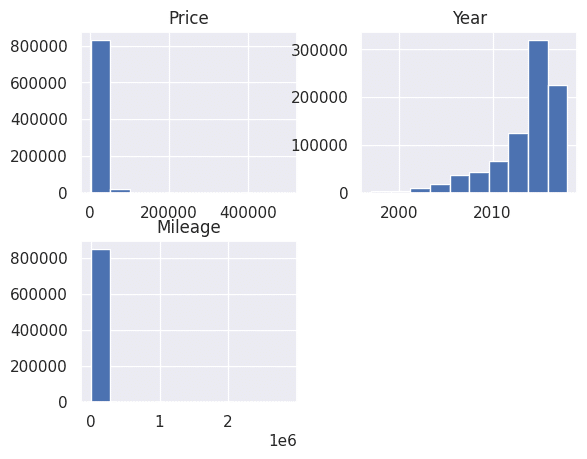
df.hist()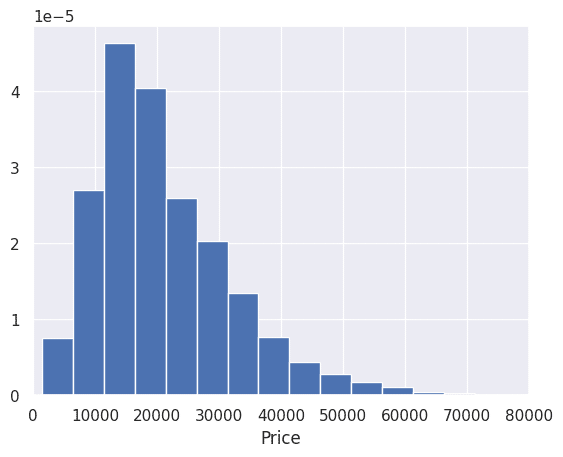
#Heatmap
correlation_matrix = df.corr()
sns.heatmap(correlation_matrix, annot=True, cmap='coolwarm')
plt.show()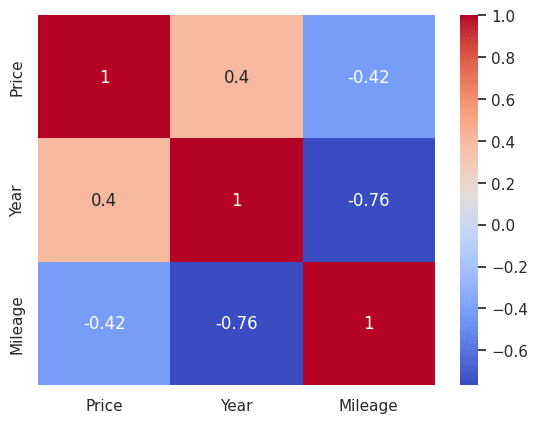
#3つの数値データをPlot
plt.figure(figsize=(10,6))
scatter = plt.scatter(df['Price'], df['Year'], c=df['Mileage'], cmap='coolwarm', s=8)
plt.colorbar(scatter, label='Mileage')
plt.xlabel('Price')
plt.ylabel('Year')
plt.show()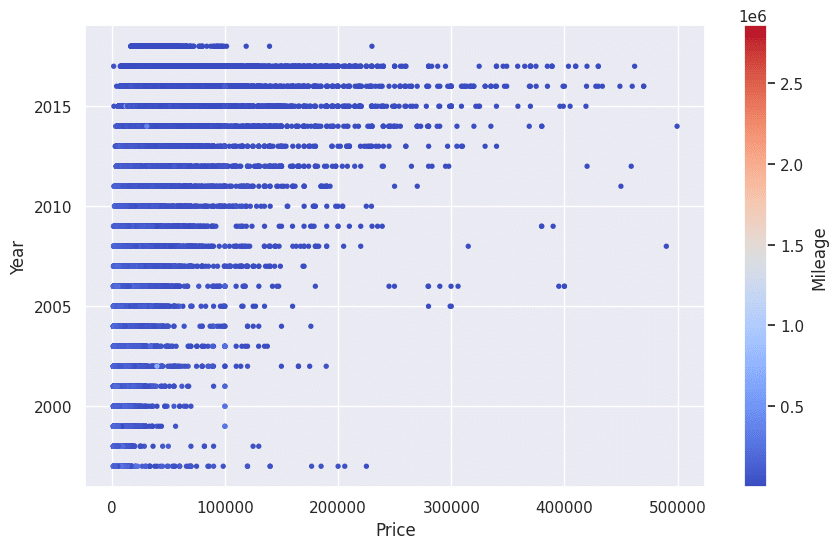
fig, axes = plt.subplots(1, 2, figsize=(16, 8))
sns.scatterplot(x='Year', y='Price', data=df, ax=axes[0])
sns.scatterplot(x='Mileage', y='Price', data=df, ax=axes[1])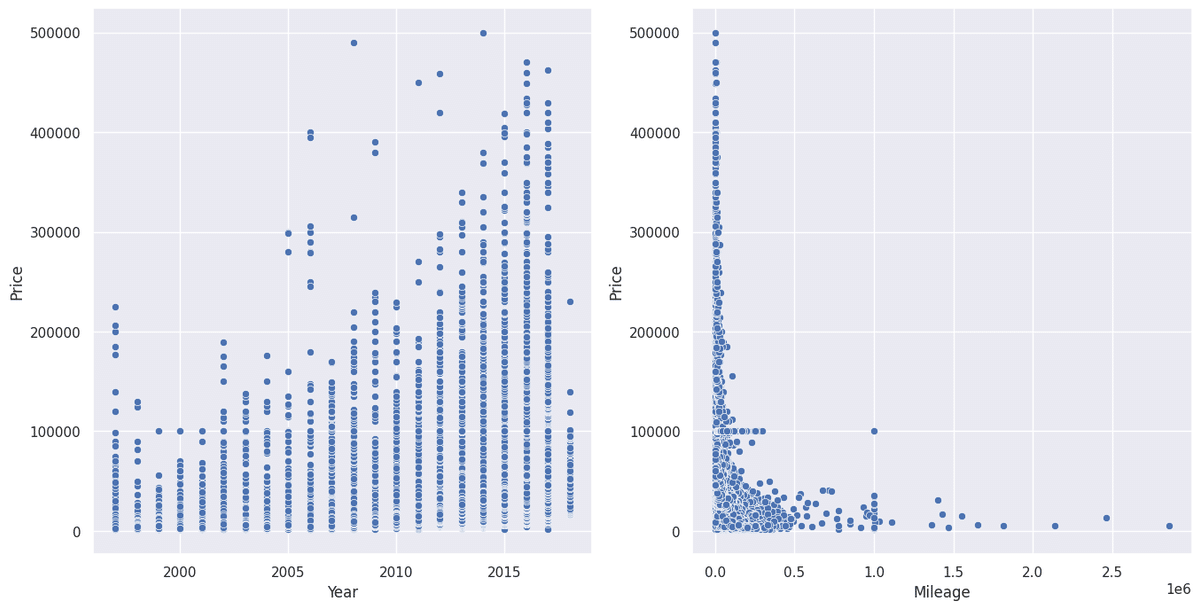
Priceと自動車の製造年式(Year)には相関があることが掴めました。
アメリカの自動車使用用途を見ても、走行距離(Mileage)はあまり気にしない傾向があるのかもしれません。
3.データの整理
数値以外のデータで不要なものを削除します。
"Vin"は自動車の識別情報ですが、今回は使わないと判断したので削除。
#可視化でPriceに関連性がないと思われる不要なデータを削除
df = df.drop('Vin', axis=1)
df.head()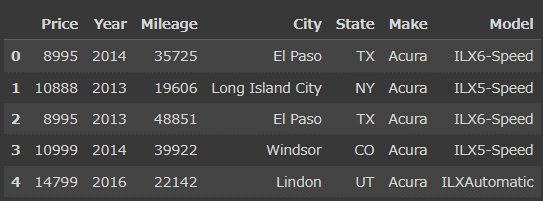
#モデル学習のためにデータを分けます
df2 = df.copy()
y = df['Price']
X = df[['Mileage', 'Year']]

print(y.head())
X.head()
0 8995
1 10888
2 8995
3 10999
4 14799
Name: Price, dtype: int64
Mileage Year
0 35725 2014
1 19606 2013
2 48851 2013
3 39922 2014
4 22142 2016
4.モデル学習
実際にモデルの学習をします。
今回は価格予測になりますので、教師あり学習の回帰モルを試しています。
#ライブラリの読み込み
from sklearn.linear_model import LinearRegression
from sklearn.linear_model import Lasso
from sklearn.linear_model import Ridge
from sklearn.linear_model import ElasticNet
from sklearn.preprocessing import StandardScaler
from sklearn.ensemble import RandomForestRegressor
from sklearn.datasets import make_regression
from sklearn.model_selection import train_test_split
from sklearn.metrics import r2_score
#訓練と検証データに分ける
X_train, X_test, y_train, y_test = train_test_split(X, y, random_state=42)
X_train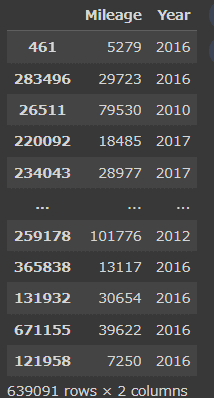
それでは実際に予測していきます。
#線形回帰
model = LinearRegression()
model.fit(X_train, y_train)
print("Linear:{}".format(model.score(X_test, y_test)))
#ラッソ回帰
model = Lasso()
model.fit(X_train, y_train)
print("Lasso:{}".format(model.score(X_test, y_test)))

#リッジ回帰
model = Ridge()
model.fit(X_train, y_train)
print("Ridge:{}".format(model.score(X_test, y_test)))

#Elastic回帰
model = ElasticNet(l1_ratio=0.7)
model.fit(X_train, y_train)
print("ElasticNet:{}".format(model.score(X_test, y_test)))

#ランダムフォレスト
#X_train, X_test, y_train, y_test = train_test_split(X, y, random_state=42)

model = RandomForestRegressor()
model.fit(X_train, y_train)

y_pred = model.predict(X_test)
accuracy = r2_score(y_test, y_pred)
print("RandomForest:{}".format((accuracy)))
Linear:0.19596481220943496
Lasso:0.19596542900351932
Ridge:0.19596481295662027
ElasticNet:0.1960481490361613
RandomForest:-0.036495662312061805
from sklearn.metrics import mean_squared_error

msr = mean_squared_error(y_test, y_pred, squared=False)
print(msr)
13780.73630873613
決定木モデルでは何故かスコアがマイナスになってしまいました。
特徴量が足りなかった可能性があります。
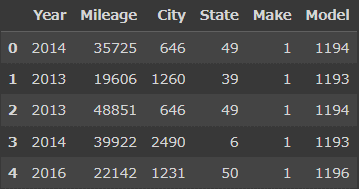
そこで特徴量を増やすためにCity、State、Make、Modelを特徴量変換しようと思いますが、CityやModelの種類が多すぎるのでOne-hot encodingを施すとColumnsが無限に増えてしまいます。
なので、ラベルエンコーディングを施して特徴量に変換し、もう一度モデル学習をして見ましょう。
from sklearn.preprocessing import LabelEncoder
le = LabelEncoder()

#カテゴリカル変数を変換
categorical_features = ['City', 'State', 'Make', 'Model']
for feature in categorical_features:
    raw_df = df[feature]
    encoded_df = LabelEncoder().fit_transform(raw_df)
    df[feature] = encoded_df
df.head(10)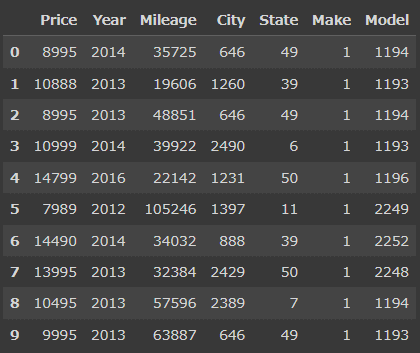
変換が完了しました。
一度Heatmapを見て関連性を確認してみます。
correlation_matrix = df.corr()
sns.heatmap(correlation_matrix, annot=True, cmap='coolwarm')
plt.show()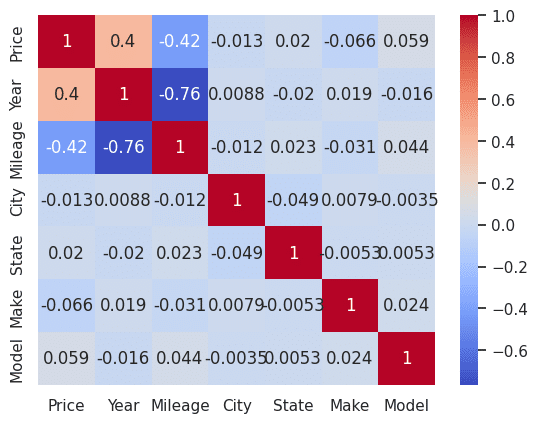
特徴量が多すぎてあまり相関性があるよう見えないですね。
次はこの特徴量変換したDataFrameを使ってモデル学習を試してみます。
y = df['Price']
X = df.drop('Price', axis=1)

print(y.head())
X.head()
0 8995
1 10888
2 8995
3 10999
4 14799
Name: Price, dtype: int64
X_train, X_test, y_train, y_test = train_test_split(X, y, random_state=42)

#線形回帰
model = LinearRegression()
model.fit(X_train, y_train)
print("Linear:{}".format(model.score(X_test, y_test)))
#ラッソ回帰
model = Lasso()
model.fit(X_train, y_train)
print("Lasso:{}".format(model.score(X_test, y_test)))

#リッジ回帰
model = Ridge()
model.fit(X_train, y_train)
print("Ridge:{}".format(model.score(X_test, y_test)))

#Elastic回帰
model = ElasticNet(l1_ratio=0.7)
model.fit(X_train, y_train)
print("ElasticNet:{}".format(model.score(X_test, y_test)))

#ランダムフォレスト
model = RandomForestRegressor()
model.fit(X_train, y_train)

y_pred = model.predict(X_test)
accuracy = r2_score(y_test, y_pred)
print("RandomForest:{}".format((accuracy)))

#このモデルの誤差
from sklearn.metrics import mean_squared_error
mse = mean_squared_error(y_test, y_pred, squared=False)
print(f'Mean Squared Error (MSE): {mse}')
Linear:0.20937165440182914
Lasso:0.2093723108456892
Ridge:0.20937165518771728
ElasticNet:0.20946394711887328
RandomForest:0.8988164401525457
Mean Squared Error (MSE): 4304.937708718023
線形回帰分析ではほぼ改善しませんでしたが、ランダムフォレストではかなり改善しました。
精度を出しただけでは分かりづらいので、グラフに描いてみます。
#実際のデータと予測データのグラフ
plt.figure(figsize=(10, 6))
plt.scatter(y_test, y_pred, alpha=0.5)
plt.title("Actual Prices vs. Predicted Prices")
plt.xlabel("Actual Prices")
plt.ylabel("Predicted Prices")
plt.grid(True)

# 対角線をプロットして、予測と実際の一致を示す
plt.plot([min(y_test), max(y_test)], [min(y_test), max(y_test)], linestyle='--', color='red')

plt.show()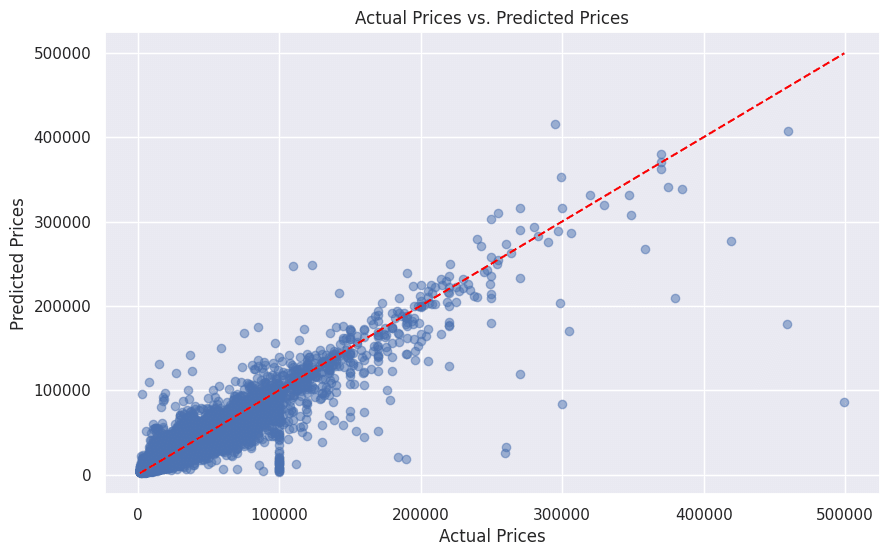
青点が対角線に近い点はその予測が実際の価格に近いことを示します。
この対角線に点が近いほど、予測が実際の価格に合致していることを示しています。
5.考察
ランダムフォレストが1回目と2回目でなぜここまでスコアが違うのかを考えて見ましょう。
まず、ランダムフォレストについてどういうものなのか、よく調べてみましょう。
ランダムフォレストとは、「決定木」と呼ばれる予測モデルを複数組み合わせたアンサンブル モデルであり、教師付き機械学習のアルゴリズムの一種です。回帰を行う場合は、各決定木の平均値を予測値として扱い、分類を行う際は、多数決で分類結果を出力します。質的な変数も多く組み込むことができます。
なるほど。
今回は回帰の数値予測なので、各ツリーの予測結果の決定木の平均を取得する。
つまり、1回目のモデル学習と2回目のモデル学習でランダムフォレストのスコアが良くなったのは、1回目はMileageとYear、Priceのデータの3つしか特徴量がなかった為、決定木モデルであるランダムフォレストには特徴量が足りず、多数のデシジョンツリーを作る際にほとんど予測できなかったんだと思います。
2回目は4つのカラムにラベルエンコーディングを施し特徴量を追加したことで、ランダムフォレストの特徴である複数の決定木から予測した値の平均値を取るというアルゴリズムに丁度マッチし、予測精度が出せたのではないかと思います。
6.感想
今回、初めて自身で1からデータを分析してみて本当に良い経験になったと思います。
本当に難しかったポイントはデータの前処理の部分で、どのように変えればモデルの学習に有益となるのか?データの前処理の大切さが体験できました。
もう少し、データの加工を煮詰めてメーカー毎にどういった傾向があるかを見ても良かったかもしれません。
これからも日々成長できるように学習に励んでいきたいと思います。
最後までお読み頂き本当にありがとうございました。
