
MATLAB R2023a で追加された plot 関連
まえがき
春ですね。
MATLAB アップデートの季節です。
去年の年末に plot 関連のまとめ記事 を書きましたが、今回のアップデートで割と plot 関連が多かったので、更新分を別記事として書こうかと思います。
では早速。
更新項目と内容
・tiledlayout horizontal / vertical
これまで "tiledlayout flow" で、レイアウトを指定せずにリフロー形式指定ができました。
tiledlayout flow

nexttile
plot(rand(10,1))
title('G_1')

nexttile
plot(rand(10,2))
title('G_2')

nexttile
plot(1:10,rand(10,1),'gx-', 1:10,rand(10,1),'bo--')
title('G_3')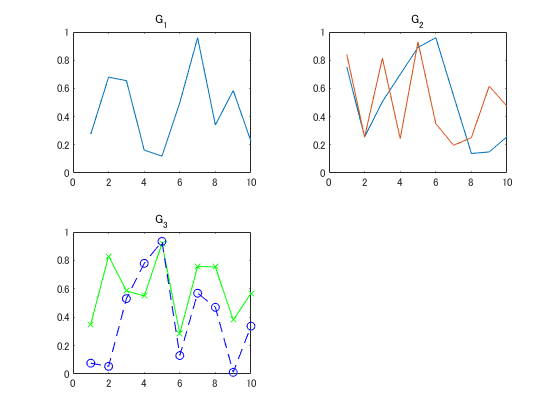
しかしデフォルトでは上図のように表示され、一列/一行にするにはウィンドウを自分でリサイズするか、tledlayout(m,n) のように固定で指定する必要がありました。
R2023aでは "horizontal / vertical" レイアウトが追加されました。
tiledlayout vertical
nexttile
plot(rand(10,1))
title('G_1')

nexttile
plot(rand(10,2))
title('G_2')

nexttile
plot(1:10,rand(10,1),'gx-', 1:10,rand(10,1),'bo--')
title('G_3')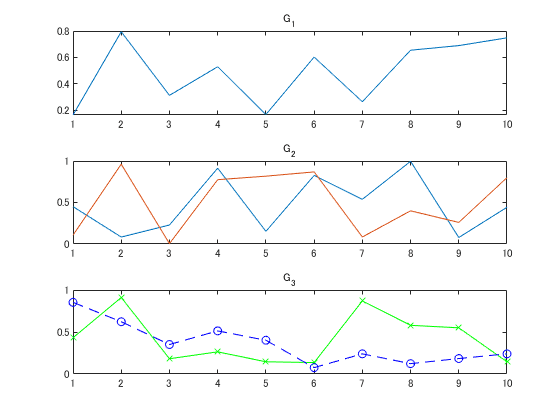
これは地味に嬉しい!
・GridLineWidth
グリッド線も幅指定可能になりました。
ax = gca;
grid(ax,'on')
ax.GridLineWidth = 2;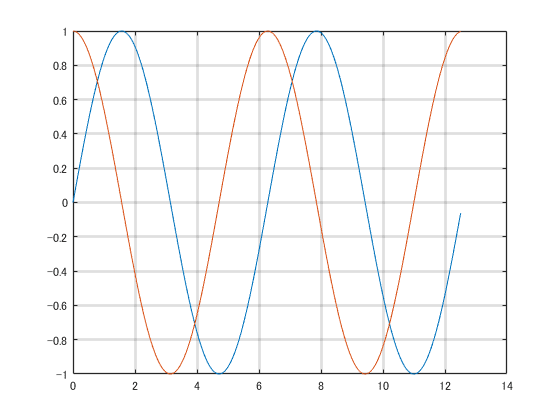
・xregion / yregion
帯状の領域を塗る "xregion / yregion" が追加されました。
plot(rand(10,2))
ylim([0 1])
xregion(2,4,'FaceColor','b',FaceAlpha=0.1)
xregion([3 6],[5 7],'FaceColor','r',FaceAlpha=0.2)
yregion(0.6,0.8,'FaceColor','g',FaceAlpha=0.2)
xregion(9,8,FaceColor='#ff8000')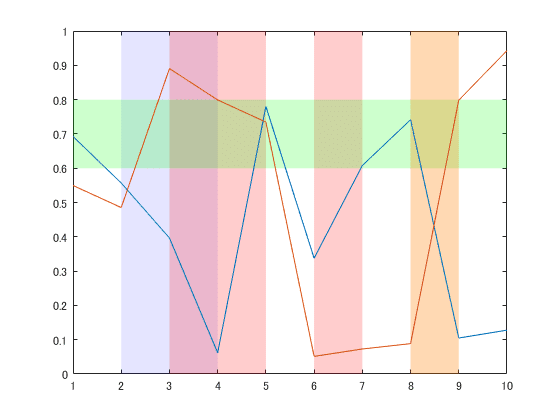
透明度を付ければ、重なった領域は色も重なります。
・ラベル Rotation
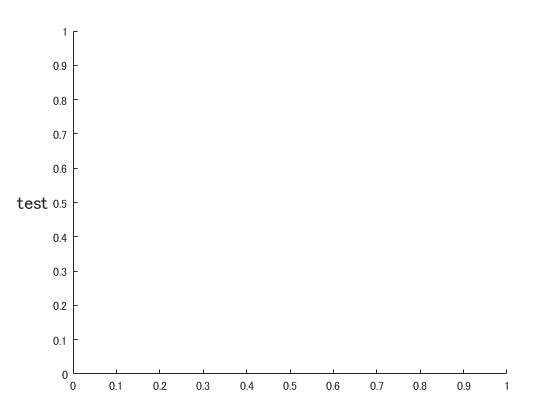
ラベルを回転させたときに、軸と重ならなくなりました。
figure
ylab = ylabel('test',FontSize=14);
ylab.Rotation = 0;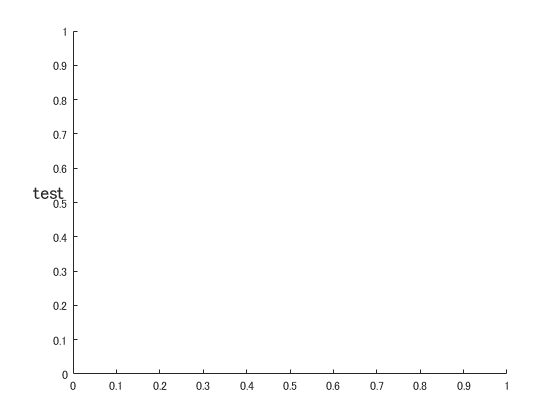
・Cycling order
plot ラインの色やスタイルは、その更新順をあらかじめ指定することができます。
R2023a では、その更新順を、色を優先するかラインスタイルを優先するか選べるようになりました。
clear
close all

th = 0:pi/50:pi;
m = 4:-1:1;
y = sin(th'*m);

figure
ax = gca;

ax.LineStyleOrder=["-","-o","--"];
ax.LineStyleCyclingMethod='aftercolor';  % default
hold(ax,"on")  % keep properties

plot(ax,y)
legend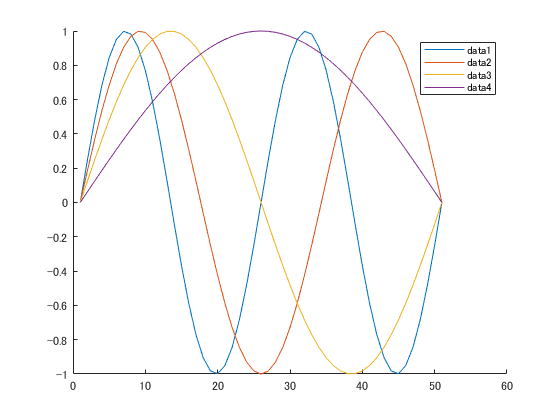
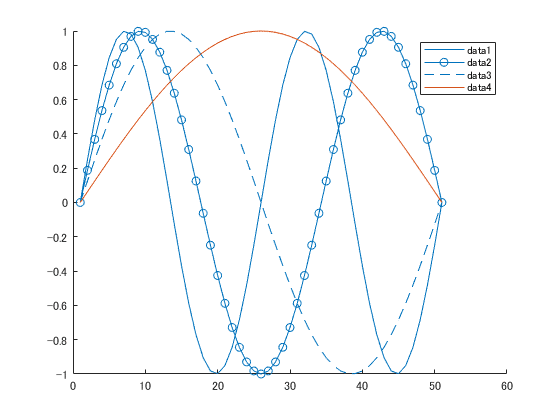
デフォルトの "aftercolor" では、今まで通り色が一巡して8番目からラインスタイルが更新されます。(4本しか plot していないので、上図ではまだラインスタイルが変わっていません)
"withcolor" を指定すると、色とラインスタイルが同時に更新されます。(描画した後でも)
ax.LineStyleCyclingMethod='withcolor'; % cyclic color with style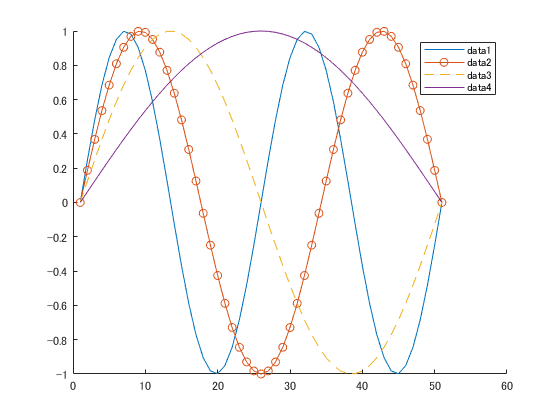
"beforecolor" では、同色でラインスタイルを先に更新してから、それが一巡すると色が更新されます。
ax.LineStyleCyclingMethod='beforecolor'; % cyclic style before changing color
AffectAutoLimits
デフォルトでは、グラフを重ね描きすると表示範囲が自動で調整されますが、それを停止させることができるようになりました。
th = 0:pi/50:pi;
plot(sin(th))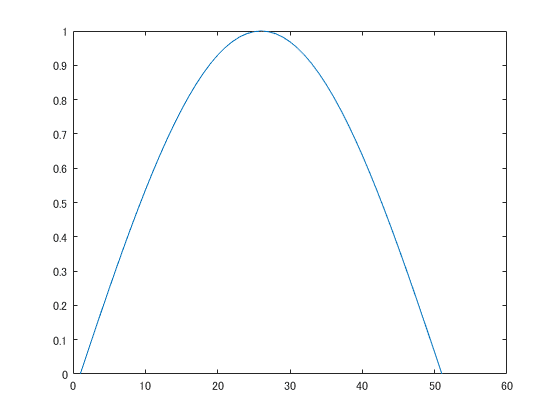
hold on
p2 = plot(sin(th*2));
hold off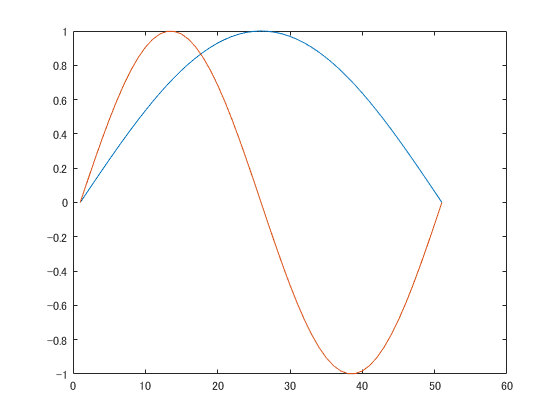
p2.AffectAutoLimits = "off";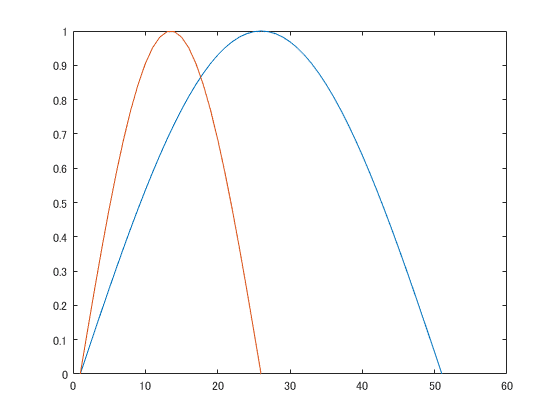
"on" にすれば、自動調整に戻ります。
・プロットカタログ(削除予定)
前回、「数日前まで知りませんでした」と書いてしまいましたが、これは古いようで、将来削除されるとのことです。(^_^;)
「データを選択してプロットタブ」が推奨されます。
あとがき
R2023a、地味に便利になったアップデートが多かったのと、古いATOK 使っても落ちなくなったこともあって、Prerelease 版から R2023a メインで使ってました。
まあ、最近は Prerelease 版でも安定度が高く、たいてい処理速度も上がってたりするので、 Prerelease 版出たらすぐ使ってますけどね。 (u_u)
一応、Prerelease 版の内容は口外しちゃいけないことになってるようなので(正規版に搭載されるか未定だから?)、満を持して(?)の記事となりました。(-_☆)
「こんな機能が搭載予定です!」って宣伝になって良いと思うんですけどね。
公式が、「(正規版への搭載は未定です)」って但し書きした上で、リリースノートを一般公開してくれると良いと思います! (。・_・。)ノ
