【無料記事】yfinanceで株価を取得して可視化してもらう
※この記事は最後まで無料で読むことができます。
Pythonで株価のデータを可視化するのはとても便利。
yfinance
株価の取得のライブラリはたくさんありますが、yfinanceがAPI Keyの取得も不要で使いやすいです。
取得と可視化
pip install yfinance matplotlibimport yfinance as yf
import matplotlib.pyplot as plt
# Appleの株価データを2021年1月1日から2023年11月2日まで取得
apple_data = yf.download('AAPL', start='2021-01-01', end='2023-11-02')
# 株価の終値をプロット
plt.figure(figsize=(10, 6))
plt.plot(apple_data['Close'], label='AAPL Close Price')
plt.title('Apple (AAPL) Stock Price')
plt.xlabel('Date')
plt.ylabel('Price (USD)')
plt.legend()
plt.grid(True)
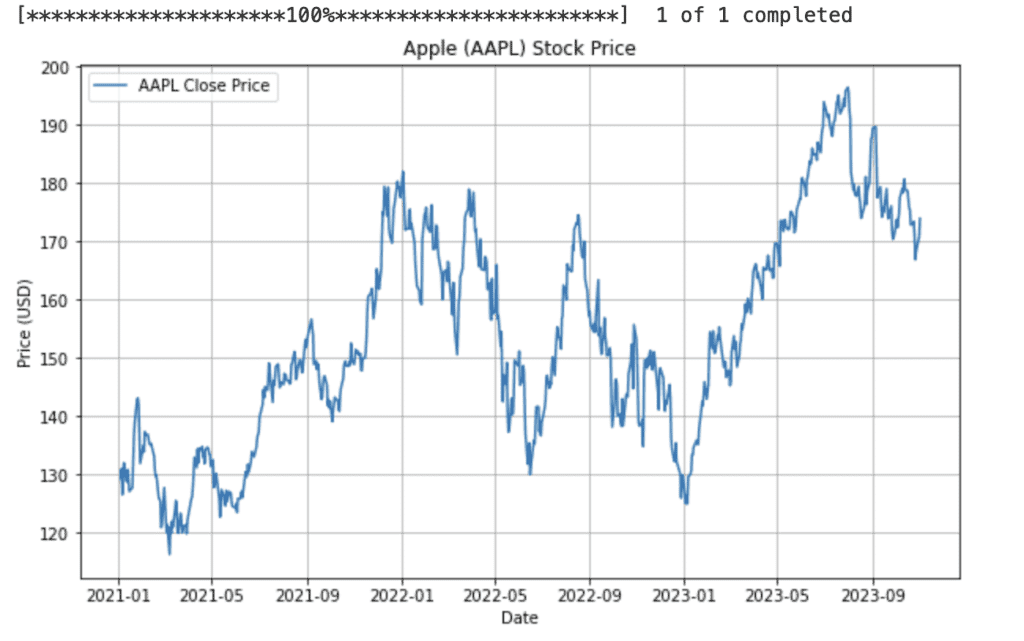
plt.show()こちらが取得し可視化するためのコードになります。
jupiter noteで開いています。

移動平均線の追加
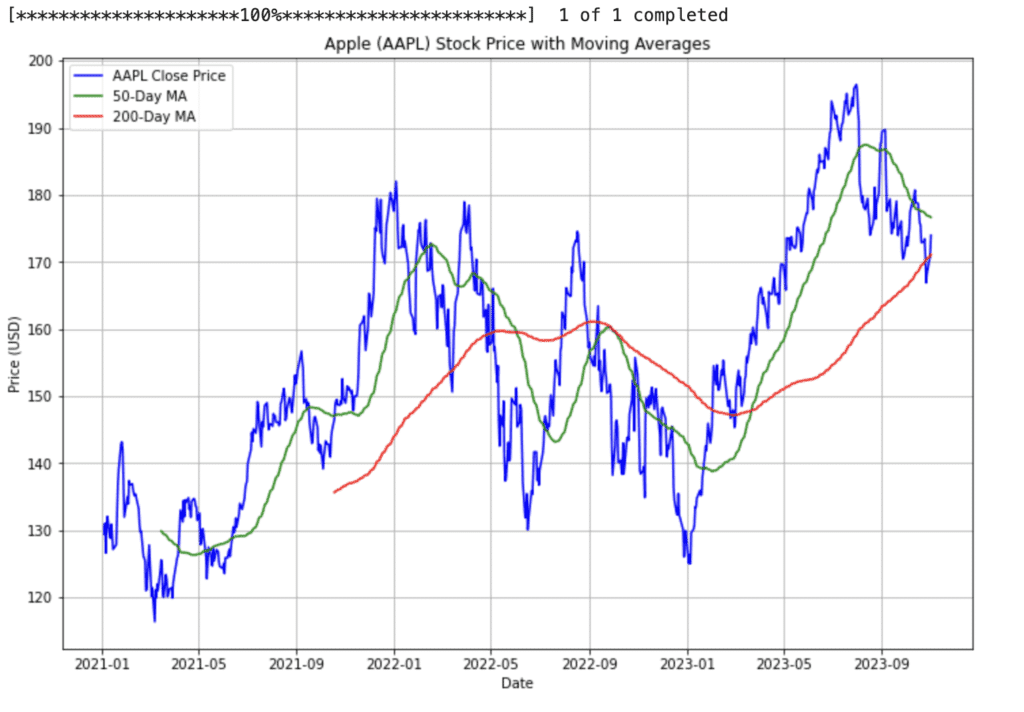
この可視化に50日移動平均線と200日移動平均線を追加してください出力がこちら
import yfinance as yf
import matplotlib.pyplot as plt
# Appleの株価データを2021年1月1日から2023年11月2日まで取得
apple_data = yf.download('AAPL', start='2021-01-01', end='2023-11-02')
# 50日と200日の移動平均を計算
apple_data['50_MA'] = apple_data['Close'].rolling(window=50).mean()
apple_data['200_MA'] = apple_data['Close'].rolling(window=200).mean()
# 株価の終値と移動平均線をプロット
plt.figure(figsize=(12, 8))
plt.plot(apple_data['Close'], label='AAPL Close Price', color='blue')
plt.plot(apple_data['50_MA'], label='50-Day MA', color='green')
plt.plot(apple_data['200_MA'], label='200-Day MA', color='red')
plt.title('Apple (AAPL) Stock Price with Moving Averages')
plt.xlabel('Date')
plt.ylabel('Price (USD)')
plt.legend()
plt.grid(True)
plt.show()
ちなみにこのグラフにRSIを追加するには以下のコード
import yfinance as yf
import matplotlib.pyplot as plt
import numpy as np
# RSIを計算する関数
def compute_rsi(data, window=14):
    diff = data.diff(1).dropna()
    gain = 0 * diff
    loss = 0 * diff
    gain[diff > 0] = diff[diff > 0]
    loss[diff < 0] = -diff[diff < 0]
    avg_gain = gain.rolling(window=window).mean()
    avg_loss = loss.rolling(window=window).mean()
    rs = avg_gain / avg_loss
    rsi = 100 - (100 / (1 + rs))
    return rsi
# Appleの株価データを2021年1月1日から2023年11月2日まで取得
apple_data = yf.download('AAPL', start='2021-01-01', end='2023-11-02')
# 50日と200日の移動平均を計算
apple_data['50_MA'] = apple_data['Close'].rolling(window=50).mean()
apple_data['200_MA'] = apple_data['Close'].rolling(window=200).mean()
# RSIを計算
apple_data['RSI'] = compute_rsi(apple_data['Close'])
# 株価の終値と移動平均線をプロット
fig, (ax1, ax2) = plt.subplots(2, 1, figsize=(12, 8), gridspec_kw={'height_ratios': [2, 1]})
ax1.plot(apple_data['Close'], label='AAPL Close Price', color='blue')
ax1.plot(apple_data['50_MA'], label='50-Day MA', color='green')
ax1.plot(apple_data['200_MA'], label='200-Day MA', color='red')
ax1.set_title('Apple (AAPL) Stock Price with Moving Averages')
ax1.set_ylabel('Price (USD)')
ax1.legend()
ax1.grid(True)
# RSIをプロット
ax2.plot(apple_data['RSI'], label='RSI', color='purple')
ax2.axhline(70, color='red', linestyle='--')
ax2.axhline(30, color='green', linestyle='--')
ax2.set_title('Apple (AAPL) Relative Strength Index (RSI)')
ax2.set_ylabel('RSI')
ax2.set_xlabel('Date')
ax2.legend()
ax2.grid(True)
plt.tight_layout()
plt.show()
バックテストのコードプロンプト例
import yfinance as yf
import numpy as np
# RSIを計算する関数
def compute_rsi(data, window=14):
    diff = data.diff(1).dropna()
    gain = 0 * diff
    loss = 0 * diff
    gain[diff > 0] = diff[diff > 0]
    loss[diff < 0] = -diff[diff < 0]
    avg_gain = gain.rolling(window=window).mean()
    avg_loss = loss.rolling(window=window).mean()
    rs = avg_gain / avg_loss
    rsi = 100 - (100 / (1 + rs))
    return rsi
# Appleの株価データを取得
apple_data = yf.download('AAPL', start='2021-01-01', end='2023-11-02')
# RSIを計算
apple_data['RSI'] = compute_rsi(apple_data['Close'])
# 購入シグナル(RSIが25を下回った翌日に購入)
apple_data['Buy_Signal'] = np.where(apple_data['RSI'].shift(1) < 25, 1, 0)
# 購入日の終値と売却日(翌日)の終値を比較
apple_data['Next_Day_Close'] = apple_data['Close'].shift(-1)
apple_data['Profit'] = np.where(apple_data['Buy_Signal'] == 1, apple_data['Next_Day_Close'] - apple_data['Close'], 0)
# 勝率の計算
total_trades = apple_data['Buy_Signal'].sum()
winning_trades = np.sum(apple_data['Profit'] > 0)
losing_trades = np.sum(apple_data['Profit'] < 0)
win_rate = winning_trades / total_trades if total_trades > 0 else 0
print(f"Total Trades: {total_trades}")
print(f"Winning Trades: {winning_trades}")
print(f"Losing Trades: {losing_trades}")
print(f"Win Rate: {win_rate:.2f}")
jupiter noteで出力するとしっかり結果が表示されています。
これらを応用することで様々なアプローチが可能になりますね。
この記事が気に入ったらチップで応援してみませんか?

