マーケティング担当者が売上予測モデルをつくってみた

================================== はじめに
半導体業界の商社でマーケティング業務を担当しております。マーケティングでのデータ分析スキルを身に着けたいと思いPythonの学習を始めました。実務の中で最初のPythonを活用したデータ分析内容をまとめます。
本記事の概要
マーケティング実務担当者やPythonを活用したデータ分析に興味がある方。
Python(RandomForestRegressor)を使った顧客分析を実施。分析の基本手順と使用したコード。
このブログはAidemy Premiumのカリキュラムの一環で、受講修了条件を満たすために公開しています
作成したプログラム
●GoogleColaboratoryを使用
●使用したデータ
・特定商材での販売実績データ
販売顧客
売上金額
・販売顧客に関する企業属性データ
(上場市場、設立年、事業所数、都道府県、企業年商、資本金、従業員数、業種分類、販売商材)
●分析手順とコード
1. データの前処理
・数値でないデータはPythonで分析用に数値に置き換えて実施(項目名に*分析用と入っているデータ)
・「,」が入っていると数値として読み込みないため「,」削除
・欠損値には0を入力
#ライブラリのインポート
import pandas as pd
import numpy as np
from sklearn.model_selection import train_test_split
from sklearn.preprocessing import StandardScaler
from sklearn.ensemble import RandomForestRegressor
from sklearn.metrics import mean_squared_error, r2_score
from sklearn.linear_model import LinearRegression
from sklearn.linear_model import Lasso
from sklearn.linear_model import Ridge
from sklearn.linear_model import ElasticNet
#エクセルデータの読み込み
df = pd.read_excel("/content/drive/MyDrive/GDB_uSonar情報追加_分析用.xlsx", sheet_name="分析用・加工済")
df.head()
#今回分析に使用しない項目の削除
df2=df.drop(["社名 (取引先1)","良業種 (取引先1)","ストーリー (取引先1)"],axis=1)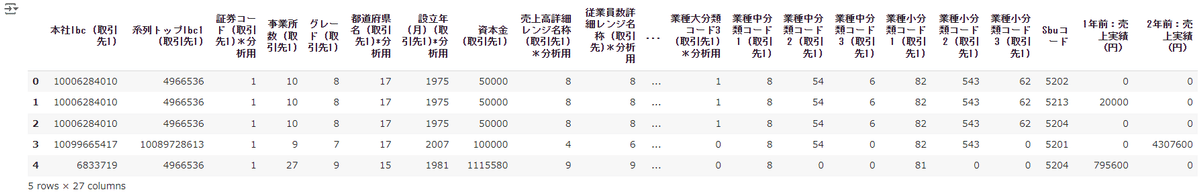
#データタイプを確認(すべて数値データint64になっていることを確認)
df2.info()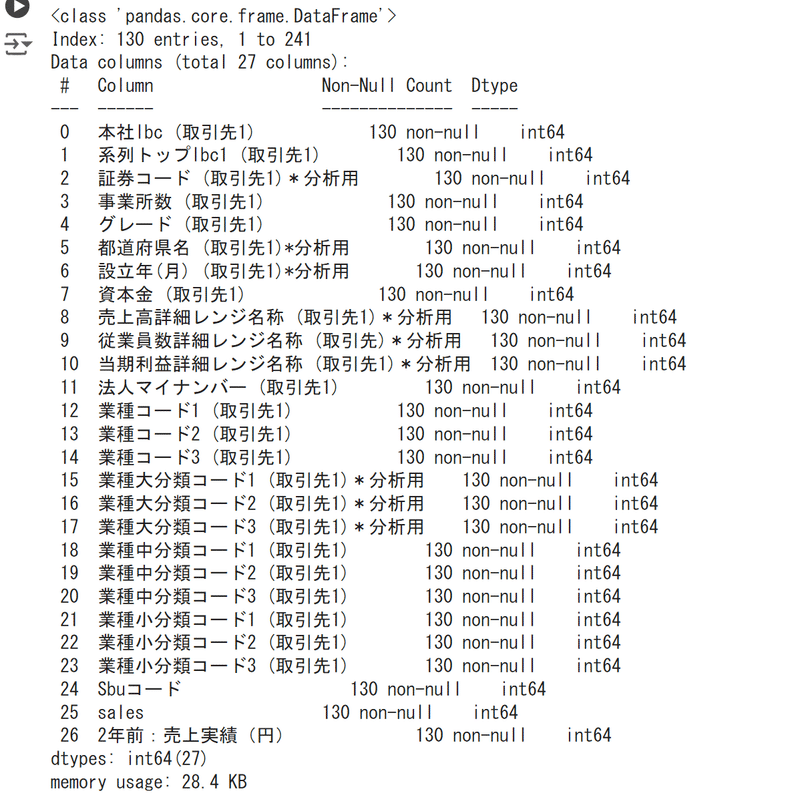
#説明変数Xと目的変数yの準備。目的変数を1年前の売上実績とした。
X=df2.drop(["1年前:売上実績(円)","2年前:売上実績(円)"],axis=1)
y=df2["1年前:売上実績(円)"]
#学習用、テスト用に9:1の割合でデータを分割
X_train,X_test,y_train,y_test=train_test_split(X,y,test_size=0.1,random_state=42)# StandardScalerのインスタンスを作成
scaler = StandardScaler()# 訓練データにフィットし、訓練データを変換(標準化)
X_train = scaler.fit_transform(X_train)# テストデータを変換(訓練データのスケーリングを適用)
X_test = scaler.transform(X_test)
2.モデルの学習
#AIモデルとしてRandomForestRegressorを使用
# RandomForestRegressorのインスタンスを作成
rf_regressor = RandomForestRegressor(n_estimators=100, random_state=42)# モデルの訓練
rf_regressor.fit(X_train, y_train)
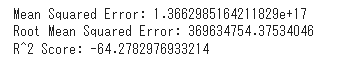
3.学習モデルの評価
R2スコア(決定係数)が高いため精度の高いモデルとはなっていないが、今回初めて練習のため予測へ進める。
# テストデータに対して予測
y_pred = rf_regressor.predict(X_test)#予測結果の評価
mse = mean_squared_error(y_test, y_pred) rmse = np.sqrt(mean_squared_error(y_test, y_pred))

r2 = r2_score(y_test, y_pred)

print(f'Mean Squared Error: {mse}')

print(f'Root Mean Squared Error: {rmse}')

print(f'R^2 Score: {r2}')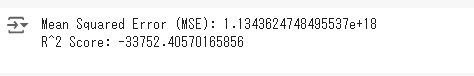
4.重要な特徴量の確認
説明変数データの項目数が多いため、予測に寄与する項目をしぼるため特徴量を可視化。
# 重要度の高い順にソート
importance_df = importance_df.sort_values(by='importance', ascending=False)# 特徴量重要度の可視化
plt.figure(figsize=(10, 6))

plt.barh(importance_df['feature'], importance_df['importance']) plt.xlabel('Feature Importance')

plt.ylabel('Feature')

plt.title('Feature Importances')

plt.gca().invert_yaxis() # 特徴量を重要度の高い順に表示

plt.show()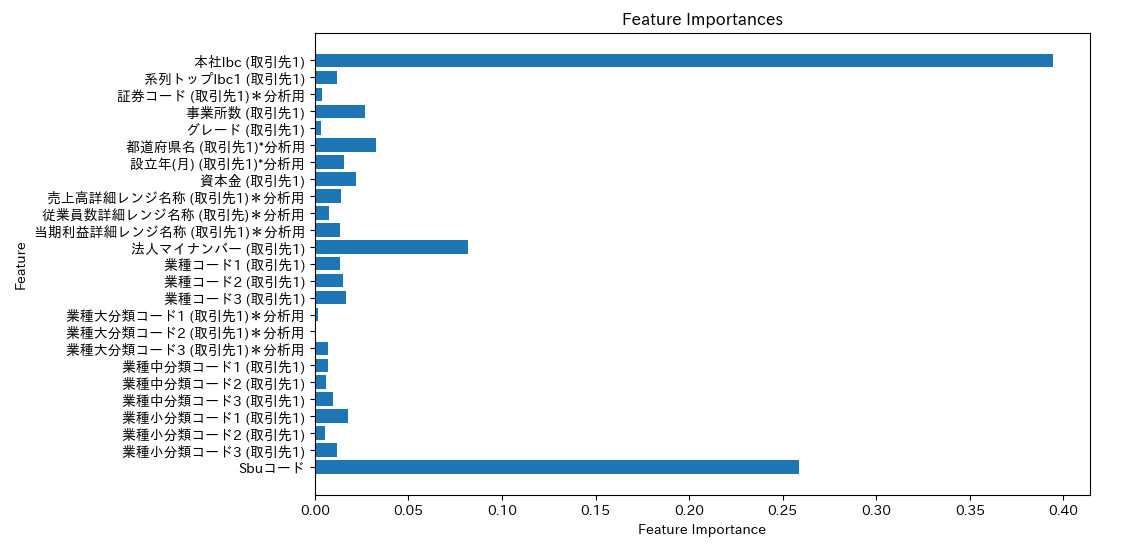
本社lbc(取引先1)、法人マイナンバー(取引先1)、Sbcコードの特徴量の寄与度が大きい。ドメイン理解より会社の規模や業種のデータが入っていないため精度の検証。精度の悪化の原因は1年前の売上に0の顧客が入っているためと想定。1年前売上金額をフィルターする際に、データ読み込みできなかったため項目名をsalesに変更。
df2 = df2.rename(columns={'1年前:売上実績(円)': 'sales'})

df2.head(3)
#1年前の売上が0となっているデータを除外
df2 = df2.query("`sales`>0")
df2.head()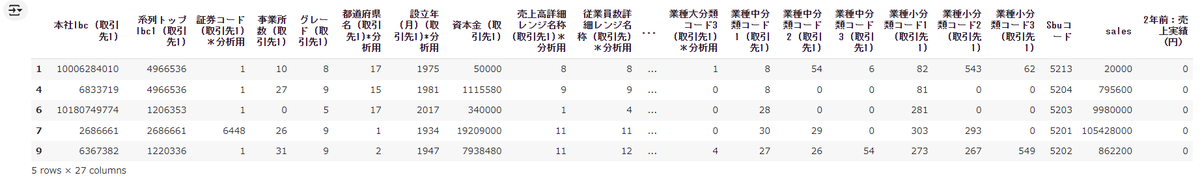
#再度学習と評価
X=df2.drop(["sales","2年前:売上実績(円)"],axis=1)
y=df2["sales"]
X_train,X_test,y_train,y_test=train_test_split(X,y,test_size=0.1,random_state=42)
rf_regressor = RandomForestRegressor(n_estimators=100, random_state=42) # モデルの訓練
rf_regressor.fit(X_train, y_train)
y_pred = rf_regressor.predict(X_test)
print("Mean Squared Error (MSE):", mean_squared_error(y_test, y_pred)) # 決定係数(R^2スコア)を表示
print("R^2 Score:", r2_score(y_test, y_pred))
mse = mean_squared_error(y_test, y_pred)
rmse = np.sqrt(mean_squared_error(y_test, y_pred))
r2 = r2_score(y_test, y_pred)
print(f'Mean Squared Error: {mse}')
print(f'Root Mean Squared Error: {rmse}')
print(f'R^2 Score: {r2}')
importances = rf_regressor.feature_importances_
feature_names = X.columns
importance_df = pd.DataFrame({
    'feature': feature_names,
    'importance': importances})
#評価結果
# 再度特徴量重要度の可視化
plt.figure(figsize=(10, 6))
plt.barh(importance_df['feature'], importance_df['importance'])
plt.xlabel('Feature Importance')
plt.ylabel('Feature')
plt.title('Feature Importances')
plt.gca().invert_yaxis()  # 特徴量を重要度の高い順に表示
plt.show()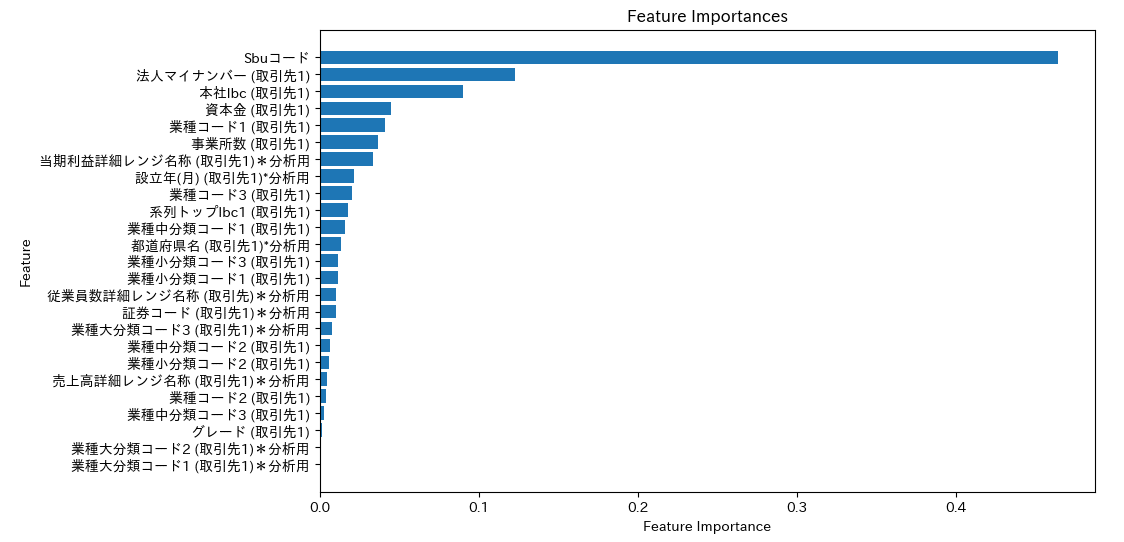
5.他モデルによる学習と評価
ElasticNet L1正則化70%回帰の精度が一番良いという結果が得られた。
#他AIモデルを使った場合どのモデルが最も精度が高くなるかの確認
best_score = -9999
bast_model = Nonemodel = LinearRegression()
model.fit(X_train, y_train)
score = model.score(X_test, y_test)
if best_score < score:
best_score = score
best_model = "線形回帰"model = Lasso()
model.fit(X_train, y_train)
score = model.score(X_test, y_test)
if best_score < score:
best_score = score
best_model = "Lasso"model = Ridge()
model.fit(X_train, y_train)
score = model.score(X_test, y_test)
if best_score < score:
best_score = score
best_model = "Ridge"model = ElasticNet()
model.fit(X_train, y_train)
score = model.score(X_test, y_test)
if best_score < score:
best_score = score
best_model = "ElasticNet"#ElasticNet L1正則化30%回帰
model = ElasticNet(l1_ratio=0.3)
model.fit(X_train, y_train)
score = model.score(X_test, y_test)
if best_score < score:
best_score = score
best_model = "ElasticNet L1正則化30%回帰"
#ElasticNet L1正則化70%回帰
model = ElasticNet(l1_ratio=0.7)
model.fit(X_train, y_train)
score = model.score(X_test, y_test)
if best_score < score:
best_score = score
best_model = "ElasticNet L1正則化70%回帰"model = RandomForestRegressor(random_state=42)
model.fit(X_train, y_train)
score = model.score(X_test, y_test)
if best_score < score:
best_score = score
best_model = "Randomforest"
print(best_model, best_score)
結果の考察
・1年前売上0の顧客を省くことで、予測モデルの精度が向上した。またドメイン理解の感覚に合う特徴量が得られた(Sbuコード、資本金、業種)
・さらに精度を上げるにはさらなるデータの収集、より説明変数を絞り込んでの予測モデル構築が考えられる。
・精度が高いと判定されたElasticNetを活用して予測モデルの作成を行う。
今後の活用
BtoBマーケティングでターゲティング分析として、目的変数データ(販売実績、商談実績、施策への反応など)に対して様々な説明変数が考えられ、何が結果への影響が高いかを分析する手法は応用性が高い。いろいろ試しながらスキルをあげていければと思います。
おわりに
今回の分析から発展をとして、以下の分析を行ってPythonの分析の習熟度を上げていきたいと考えています。
●該当商材でまだ売れていない既存顧客のターゲティングと売上予測
●他商材の販売実績データを分析し一緒に売れそうな商材のリコメンド
●テキスト形態の企業属性データを使った特徴分析(自然言語処理)
==================================