
Pythonライブラリ:scikit-learn (機械学習編)
1.概要
機械学習用パッケージのscikit-learn(sklearn)を紹介します。前処理編は別記事で実施しているため今回は機械学習の実装を説明します。実際は前処理×アルゴリズム選定を掛け合わせて最適なモデルを作成します。
2.基礎知識
2-1.AI・ML・DLの違い
前提知識として下図より、AI>機械学習>深層学習の関係にあります(第1部 特集 進化するデジタル経済とその先にあるSociety 5.0 参照)。
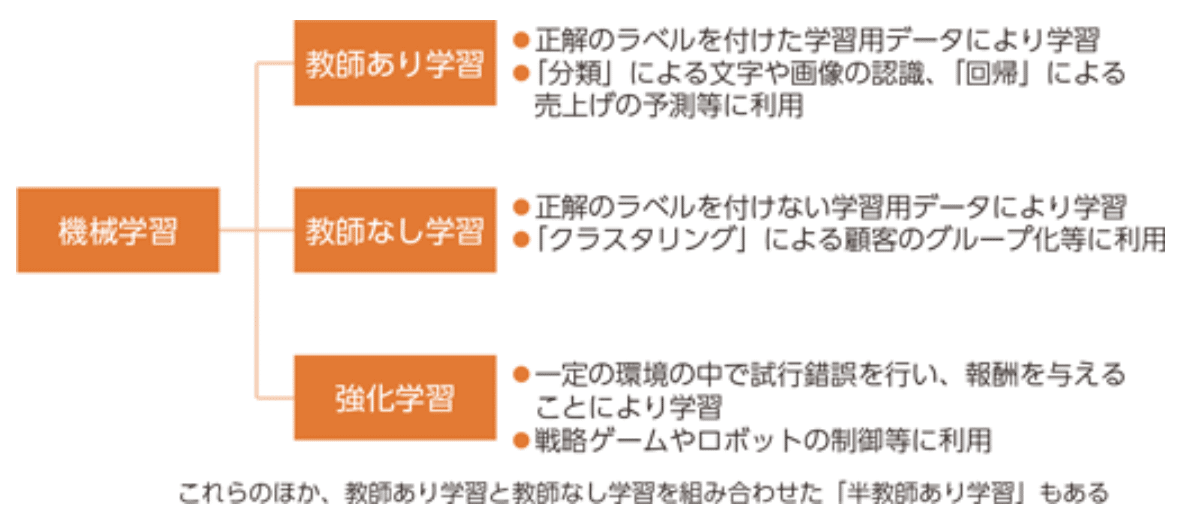
また機械学習は3分類に分けられます(種類としては「自己教師あり学習」もあります)。
2-2.データセットの分割:学習・検証・テスト用
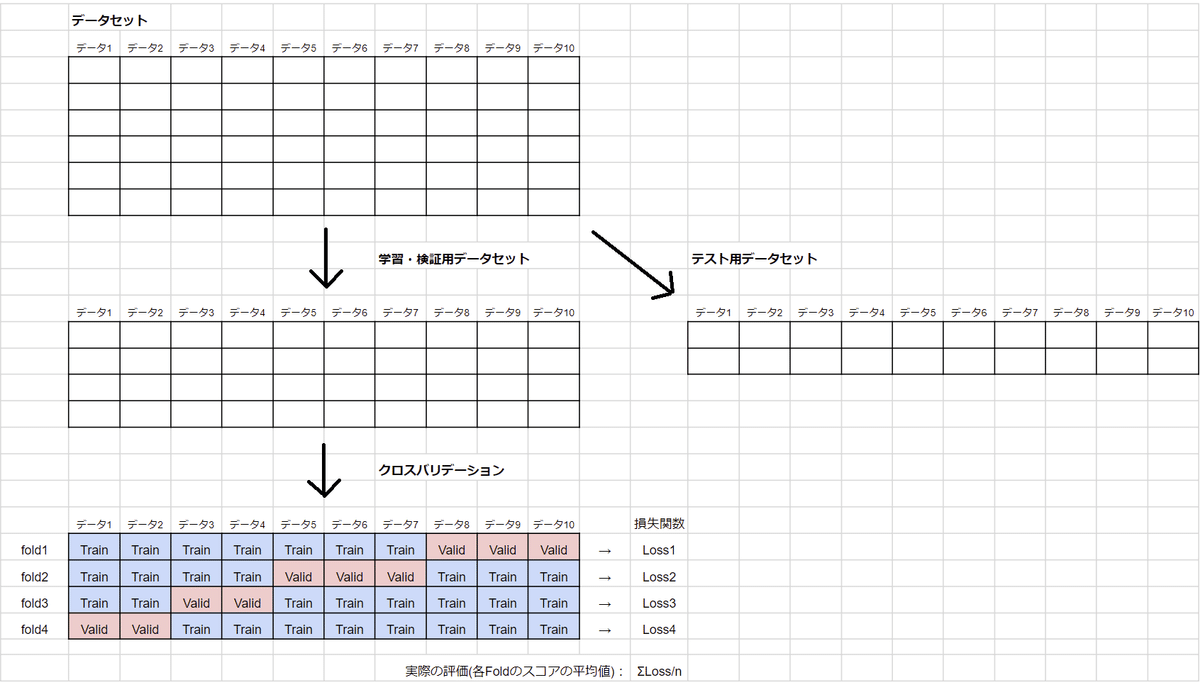
機械学習では学習結果の精度は高いが実際のデータでは精度が低くなることがあり過学習と呼ばれます。その防止として、学習時に学習・検証用データセットで学習して、実際の精度確認はテスト用データで実施します。
3.学習モデルの選定方法
3-1.機械学習の分類
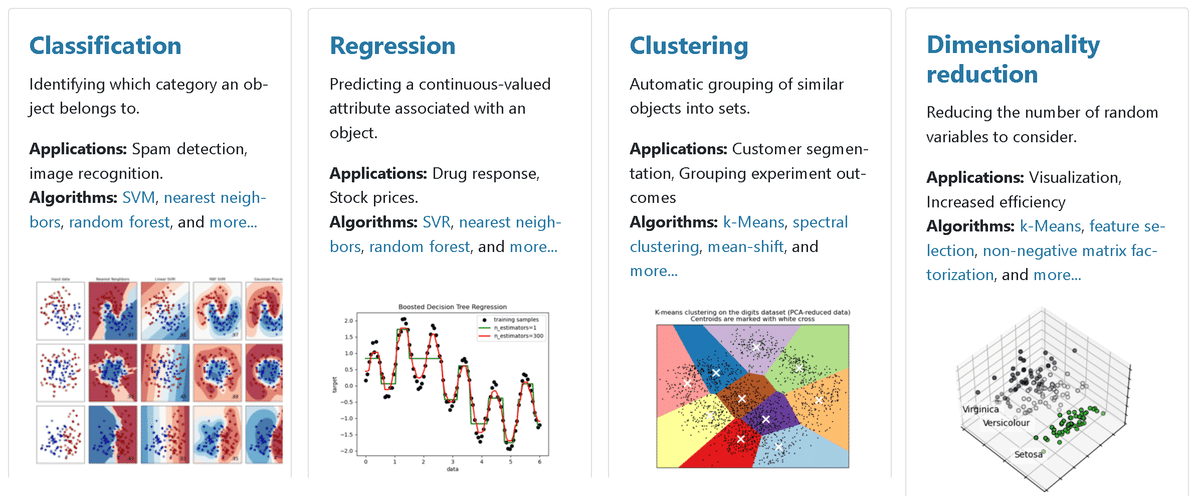
機械学習の手法には下記のものがあります。
【機械学習の分類:出力値の違い】
●回帰分析(Regression):入力したデータから求めたい計算値を出力
●分類問題(Classification):入力したデータが何に分類させるかを出力
●グルーピング(Clustering):近いデータ同士をグループに分類する
●次元削減(Dimensionality reduction):入力データから別のパラメータを作成
3-2.アルゴリズム(機械学習モデル)の選定
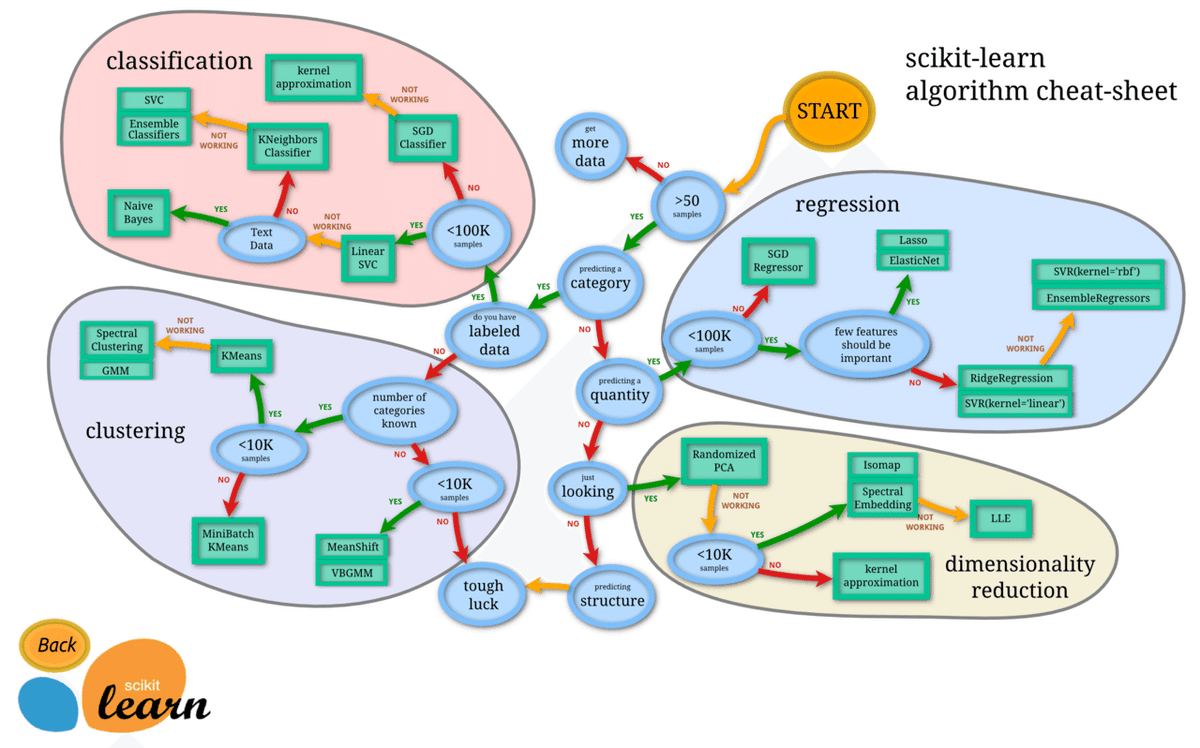
各問題の中でも様々な機械学習モデルがありどのモデルを使用したらよいかが難しいです。参考としてscikit-learnのチートシートが役に立ちます。
4.Scikit-learnでの処理フロー(基礎)
4-1.機械学習(AIモデル)の訓練の流れ
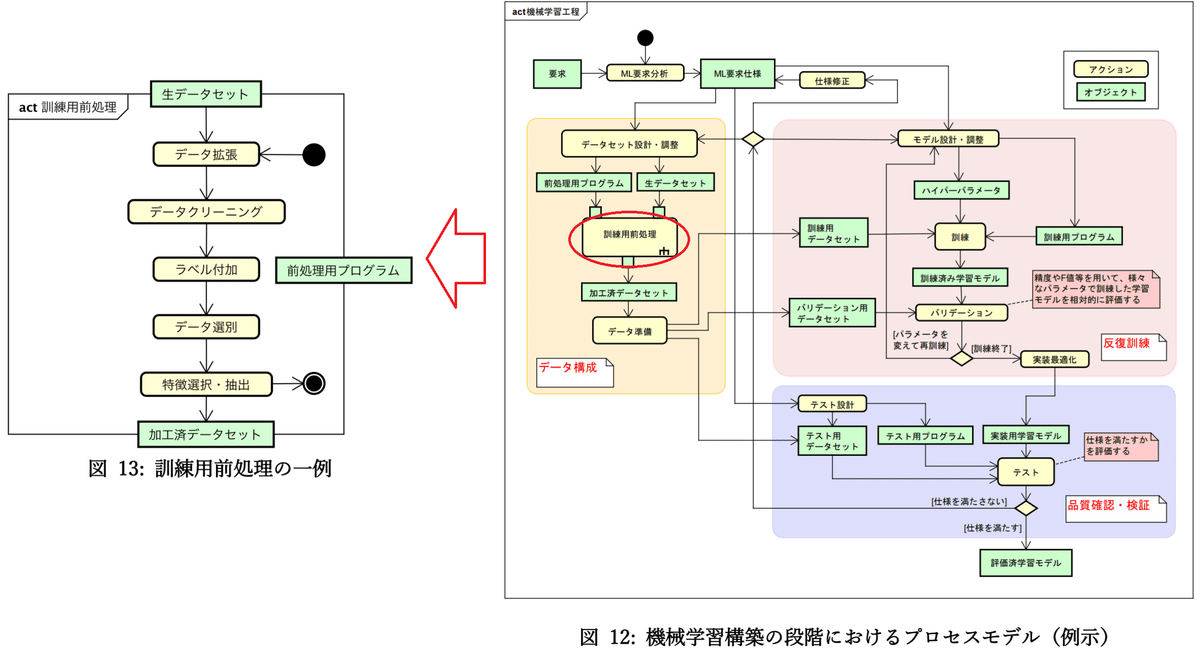
機械学習でのモデル訓練の大まかな流れは下記の通りです。
【訓練の流れ】
1.データセットの準備
2.AIモデルの選定
3.目的関数(損失関数)の選定
4.最適化手法の選定
5.モデルの学習
4-2.モデルの選定/学習:model(), fit()
Scikit-learnでは各モデルは同じAPIが使用でき同じ要領で学習できます。流れは①モデル選定、②インスタンス化、③学習となります。
下記に線形モデルで例を紹介します。
[In]※サンプルデータ作成
import pandas as pd
import numpy as np
import matplotlib.pyplot as plt

import sklearn
from sklearn import datasets
from sklearn.model_selection import train_test_split
np.set_printoptions(precision=3) # 出力値(ndarray)の桁数を指定

iris = datasets.load_iris()
datas, target = iris.data, iris.target
df_data = pd.DataFrame(datas, columns=iris.feature_names)
x_train, x_test, y_train, y_test = train_test_split(datas, target, test_size=0.2, random_state=0) # 学習データとテストデータへ7:3で分割

print(x_train.shape, x_test.shape, y_train.shape, y_test.shape)

[Out]
(120, 4) (30, 4) (120,) (30,)[In]※学習フロー
from sklearn import linear_model #モデルのインポート
model_linR = linear_model.LinearRegression() # インスタンス化
model_linR.fit(x_train, y_train) # 学習
[Out]
なし※fit()実行時にmodelの重みとバイアスが更新される4-3.学習済みモデルでの推測:predict/predict_proba
学習モデルによる予測結果はmodel.predict()を使用します。
[In]※回帰モデル
model_linR.predict(x_test) # テストデータの予測値

[Out]
array([ 1.178, -0.102,  1.127, -0.075,  1.581,  1.57 ,  1.989,  0.046, 1.715,  2.272,  2.163,  2.057,  1.899,  1.446, -0.052, -0.031,
        1.745, -0.043,  2.14 ,  1.152,  1.141, -0.037,  0.048,  1.427, -0.013,  1.307, -0.154,  1.264,  1.75 ,  0.008])
回帰モデルでは計算結果が出力されますが分類では分類ラベルが出力されます。ラベルの確率を出力するにはmodel.predict_proba()を使用します。
下記に分類問題の疑似コードを紹介します(そのままだとエラー)。
[In]※分類モデル
y_pred = model_Logi.predict(x_test) # テストデータの予測値

y_prob = model_Logi.predict_proba(x_test) # テストデータの予測確率
np.argmax(y_prob, axis=1) #確率の最大値を取得->model.predict()と同じ


[Out]
#y_pred, np.argmax(y_prob, axis=1)
[2 1 0 2 0 2]

#y_prob
[[1.125e-04 5.892e-02 9.410e-01]
 [1.221e-02 9.646e-01 2.320e-02]
 [9.867e-01 1.334e-02 3.296e-08]
 [1.194e-06 2.318e-02 9.768e-01]
 [9.721e-01 2.788e-02 1.319e-07]
 [1.852e-06 6.076e-03 9.939e-01]]
4-4.学習モデルの評価:score()
学習済みモデルの精度を確認するにはmodel.score()を使用します。
[In]
model_linR.score(x_test, y_test) # テストデータの正解率

[Out]
0.935
4-5.パラメータ確認:coef_, intercept_, get.params
学習したモデルの重みとバイアスを確認できます。全モデルが同じAPIではないですが参考例を記載します。
[In]
model_linR.coef_ # 重み
model_linR.intercept_ # バイアス

[Out]
array([-0.145, -0.011,  0.245,  0.611])
0.223
まとめてパラメータを確認する場合はmodel.get_params()を使用します。
[In]
print(model_lin.get_params()) #パラメータを取得

[Out]
{'copy_X': True, 'fit_intercept': True, 'n_jobs': None, 'normalize': False, 'positive': False}
5.Scikit-learnでの処理フロー(応用)
5-1.パイプライン:Pipeline
一般的にデータセットはそのまま使用せず前処理を実施します(4-1節)。前処理も含めて一連の処理を統合する機能としてパイプラインがあります。
[In]
from sklearn.pipeline import Pipeline
from sklearn.preprocessing import StandardScaler
from sklearn import linear_model

# パイプラインの作成 (scaler -> svr)
pipeline = Pipeline([
    ('scaler', StandardScaler()), # 標準化
    ('reg', linear_model.LinearRegression())
])

# scaler および reg を順番に使用
pipeline.fit(x_train, y_train)
# 訓練用データセットを用いた決定係数の算出
pipeline.score(x_train, y_train)
# テスト用データセットを用いた決定係数の算出
pipeline.score(x_test, y_test)

[Out]
0.9917
pipelineの中身は下記で確認できます。
[In]※全体確認
print(pipeline) #pipeline

for name in pipeline.named_steps:
    print(name, pipeline.named_steps[name])

[Out]
Pipeline(steps=[('scaler', StandardScaler()), ('reg', LinearRegression())])

scaler StandardScaler()
reg LinearRegression()
[In]個別確認
model_SS = pipeline.named_steps['scaler'] #pipeline[0]でもOK
model_lin = pipeline.named_steps['reg'] #pipeline[1]でもOK
print(model_SS) #StandardScalerを取得
print(model_lin) #LinearRegressionを取得
print(model_lin.coef_, model_lin.intercept_) #LinearRegressionの重みとバイアス
[Out]
StandardScaler()
LinearRegression()
[-0.116 -0.005 0.422 0.45 ] 0.99176.機械学習1:回帰R・分類Cモデル
回帰分析と分類で使用されるモデルを紹介します。なおサンプルデータはIrisを使用しており本データは分類用データですが、今回はモデル作成がメインのため回帰分析でもそのまま使用しております。
なお回帰分析でのscore()では指標として決定係数R2が使用されています。
【決定係数 R2:回帰分析のscore()】
$$
R^2 = 1 - \frac{\sum_{n=1}^{N}(予測値y_{n} - 目標値t_{n})^2}{\sum_{n=1}^{N}(予測値y_{n} - 目標値の平均値\={t})^2}
$$
6-1.線形回帰・重回帰:LinearRegression/ R
線形回帰はy=wx + bの直線モデル、重回帰はパラメータ数だけ重みwがつきモデルになります。Irisは分類問題ですが回帰分析のため出力は数値になっています。
【重回帰モデル:重みw、バイアスb、パラメータx】
$$
y = \sum_{n=1}^{N}w_{n}x_{n} = w_{1}x_{1}+ w_{2}x_{2}+・・・+ w_{n}x_{n} + b
$$
[In]
from sklearn.linear_model import LinearRegression #モデルのインポート

model_linR = LinearRegression() # 線形回帰
model_linR.fit(x_train, y_train) # 学習
y_pred = model_linR.predict(x_test) # テストデータの予測値

print(y_pred)
model_linR.score(x_train, y_train) # 学習データの正解率

[Out]
[ 1.178 -0.102  1.127 -0.075  1.581  1.57   1.989  0.046  1.715  2.272
  2.163  2.057  1.899  1.446 -0.052 -0.031  1.745 -0.043  2.14   1.152
  1.141 -0.037  0.048  1.427 -0.013  1.307 -0.154  1.264  1.75   0.008]

0.9296-2.ロジスティック回帰/C
重回帰分析を分類問題に適用した感じのモデルです。詳細は次節で説明しますが実装面では重回帰と同じように作成できます。
【ロジスティック回帰のパラメータ】
●C:重みwの学習時に適用する正則化項の係数(default=1.0)
->Cを小さくすると正則化が強くなる(過学習抑制)
●solver:最適化アルゴリズム{‘newton-cg’, ‘lbfgs’, ‘liblinear’, ‘sag’, ‘saga’}, default=’lbfgs’
●multi_class:他クラス分類の種類 {‘auto’, ‘ovr’, ‘multinomial’}, default=’auto’
●max_iter:イテレーション(バッチ単位での学習回数)
●random_state:乱数値を固定
[In]
from sklearn.linear_model import LogisticRegression #モデルのインポート

model_Logi = LogisticRegression(max_iter=2000) # ロジスティック回帰※max_iterは学習回数->設定しないとエラーが出る
model_Logi.fit(x_train, y_train) # 学習
y_pred = model_Logi.predict(x_test) # テストデータの予測値

print(model_Logi.get_params()) # パラメータを取得
print(y_pred)
model_Logi.score(x_train, y_train) # 学習データの正解率

[Out]
{'C': 1.0, 'class_weight': None, 'dual': False, 'fit_intercept': True, 'intercept_scaling': 1, 'l1_ratio': None, 'max_iter': 2000, 'multi_class': 'auto', 'n_jobs': None, 'penalty': 'l2', 'random_state': None, 'solver': 'lbfgs', 'tol': 0.0001, 'verbose': 0, 'warm_start': False}
[2 1 0 2 0 2 0 1 1 1 2 1 1 1 1 0 1 1 0 0 2 1 0 0 2 0 0 1 1 0]
0.967
参考までにハイパラ調整を実施した結果も紹介します。
[In]
for i in range(-3, 4):
    model_Logi = LogisticRegression(max_iter=2000, C=1/10**i) # ロジスティック回帰
    model_Logi.fit(x_train, y_train) # 学習
    y_pred = model_Logi.predict(x_test) # テストデータの予測値
    print(f'C={1/10**i}', ' 学習時スコア:', model_Logi.score(x_train, y_train), '検証スコア', model_Logi.score(x_test, y_test))

solvers = ['newton-cg', 'lbfgs', 'liblinear', 'sag', 'saga']
for solver in solvers:
    model_Logi = LogisticRegression(max_iter=2000, solver=solver) # ロジスティック回帰
    model_Logi.fit(x_train, y_train) # 学習
    y_pred = model_Logi.predict(x_test) # テストデータの予測値
    print(solver, ' 学習時スコア:', model_Logi.score(x_train, y_train), '検証スコア', model_Logi.score(x_test, y_test))

[Out]
C=1000.0  学習時スコア: 0.983 検証スコア 1.0
C=100.0  学習時スコア: 0.983 検証スコア 1.0
C=10.0  学習時スコア: 0.983 検証スコア 1.0
C=1.0  学習時スコア: 0.966 検証スコア 1.0
C=0.1  学習時スコア: 0.933 検証スコア 0.933
C=0.01  学習時スコア: 0.825 検証スコア 0.666
C=0.001  学習時スコア: 0.6917 検証スコア 0.567

newton-cg  学習時スコア: 0.966 検証スコア 1.0
lbfgs  学習時スコア: 0.966 検証スコア 1.0
liblinear  学習時スコア: 0.933 検証スコア 0.966
sag  学習時スコア: 0.966 検証スコア 1.0
saga  学習時スコア: 0.975 検証スコア 1.0
6-2’ 二値ロジスティック回帰をスクラッチで作成
ロジスティック回帰で使用する数式および線形回帰との違いは下記に記載しました。
$$
ロジット関数 log(\frac{p}{1-p}) = 重回帰(w_{1}x_{1}+ w_{2}x_{2}+・+ w_{n}x_{n} + b)
$$
$$
p = \frac{1}{ 1 + exp(重回帰)}
$$
【重回帰分析】
●出力値:計算値をそのまま使用
●損失関数:二乗平均平方根誤差(RMSE)
【ロジスティック回帰】
●出力値:学習時->softmax関数で確率に変換、推論時->最大値のindex取得
●損失関数:交差エントロピー誤差(RMSEより重みの伝搬が大きい)
さらにロジスティック回帰を理解を深めるためにスクラッチでコードを作成しました。今回はシンプルにするために二値分類とします。まずはIrisデータを二値(Setosa, Virsinica)に分けます(データシャッフル済み)。
[In]
from sklearn import datasets
from sklearn.model_selection import train_test_split

iris = datasets.load_iris()
datas, target = iris.data, iris.target
mask = np.where(target<=1, True, False) #targetが0(setosa), 1(versicolor)のみを取り出す
datas_bin, target_bin = datas[mask], target[mask] #
df_data = pd.DataFrame(datas_bin)
x_train_bin, x_test_bin, y_train_bin, y_test_bin = train_test_split(datas_bin, target_bin, test_size=0.2, random_state=0) # 学習データとテストデータへ7:3で分割
次に二値分類のロジスティック回帰を実装します。
【二値ロジスティック回帰の実装ポイント】
●パラメータと同じ数の重み$${w_{i}}$$と1つのバイアスbを作成
●計算は高速化のためNumpyを使用して線形代数で処理
●二値化関数:シグモイド、損失関数:交差エントロピーLossを使用
★誤差逆伝搬で学習時のLossの微分はシンプルな形となる(参考:交差エントロピーの例と微分の計算)
$$
{\frac{Loss}{w_{i}}} = x(ラベル値y-計算値yi)
$$
$$
{\frac{Loss}{b}} = \sum(ラベル値y-計算値yi)
$$
[In]
class LogisticScratch:
    def __init__(self, lr=0.01, iters=1000, random_state=1):
        self.lr = lr
        self.iters = iters
        self.random_state = random_state

    def sigmoid(self, x):
        return 1 / (1 + np.exp(-x)) #シグモイド関数

    def fit(self, X, y):
        rgen = np.random.RandomState(self.random_state) #乱数の初期化
        self.w_ = rgen.randn(X.shape[1])/1e5 #重みの初期化
        self.bias_ = rgen.randn(1)/1e5 #バイアスの初期化
        self.cost_ = [] #損失関数の誤差を格納するリスト

        for i in range(self.iters):
            input = np.dot(X, self.w_) + self.bias_ #入力値:重回帰モデルと同じ
            output = sigmoid(input) #活性化関数:シグモイド関数
            error = (y - output) #誤差:(正解データ-予測値)
            self.w_ = self.w_ + self.lr * np.dot(X.T, error) #重みの更新
            self.bias_ = self.bias_ + self.lr * np.sum(error) #バイアスの更新
            loss = -np.dot(y, np.log(output)) - np.dot((1-y), np.log(1-output)) #損失関数:交差エントロピー誤差
            self.cost_.append(loss) #損失関数の誤差を格納
        return self

    def predict(self, X):
        return np.where(np.dot(X, self.w_) + self.bias_ > 0.5, 1, 0) #予測値:0.5以上なら1, そうでなければ0
後は学習・推論・評価を実施します。
[In]
Log_S = LogisticScratch()
Log_S.fit(x_train_bin, y_train_bin) # 学習
y_pred = Log_S.predict(x_test_bin) # テストデータの予測値

print('正解率', (y_pred == y_test_bin).sum()/len(y_pred)) #正解率
print('w_:', Log_S.w_, 'bias:', Log_S.bias_) #重みとバイアス

[Out]
正解率 1.0
w_: [-0.83249196 -2.8987752 4.55993535 2.02225128] bias: [-0.49674566]6-3.サポートベルトルマシン(SVM)/R・C
超平面(決定境界)に近い訓練データのサポートベクトルで境界面を作るアルゴリズムがSVMです(1mmも理解してないですが)。
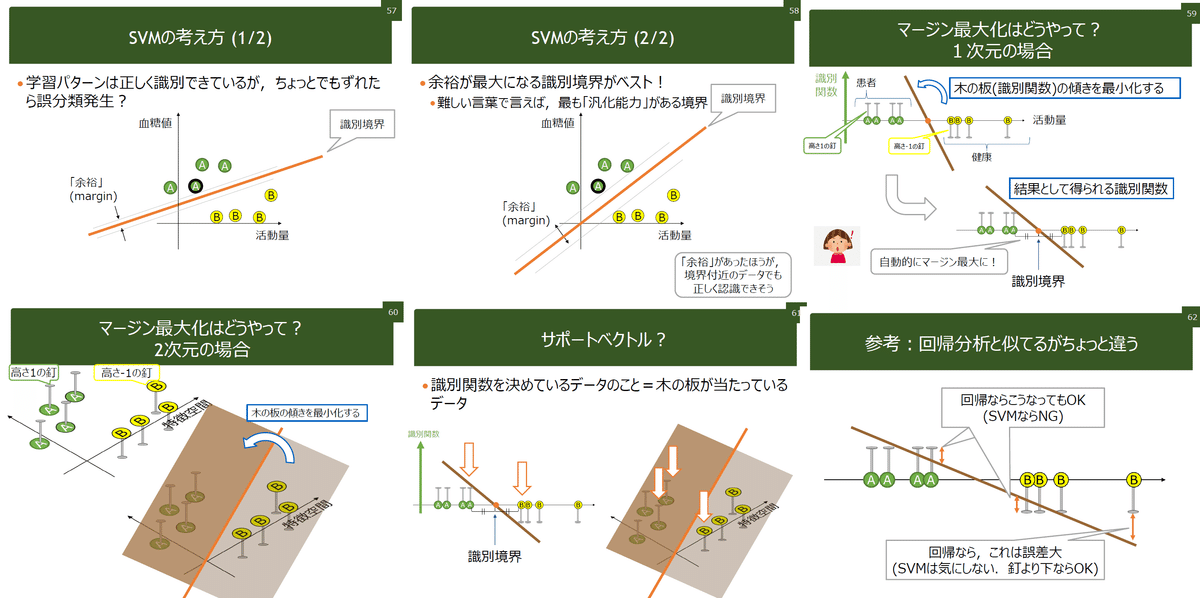
【SVMのパラメータ】※多いため一部のみ紹介
●C:重みwの学習時に適用する正則化項の係数(default=1.0)
->Cを小さくすると正則化が強くなる(過学習抑制)
●kernel:射影手法であるカーネルトリックの関数
->主に使用されるのはガウスカーネルです。
->{‘linear’, ‘poly’, ‘rbf’, ‘sigmoid’, ‘precomputed’} or callable, default=’rbf’
●gamma:カーネル関数のカットオフ(限界値条件)パラメータ->γ大だと過学習傾向
[In]
from sklearn.svm import SVC #モデルのインポート

SVM = SVC() # SVMモデル:defaultのkernel='rbf'
SVM.fit(x_train, y_train) # 学習
y_pred = SVM.predict(x_test) # テストデータの予測値

print(SVM.get_params())
print(y_pred)
print('学習時スコア:', SVM.score(x_train, y_train), '検証スコア', SVM.score(x_test, y_test))

[Out]
{'C': 1.0, 'break_ties': False, 'cache_size': 200, 'class_weight': None, 'coef0': 0.0, 'decision_function_shape': 'ovr', 'degree': 3, 'gamma': 'scale', 'kernel': 'rbf', 'max_iter': -1, 'probability': False, 'random_state': None, 'shrinking': True, 'tol': 0.001, 'verbose': False}
[2 1 0 2 0 2 0 1 1 1 2 1 1 1 1 0 1 1 0 0 2 1 0 0 2 0 0 1 1 0]
学習時スコア: 0.958 検証スコア 1.0
ハイパラ調整した結果は下記の通りです。
[In]
kernels = ['linear', 'poly', 'rbf', 'sigmoid'] #'precomputed'は次元数変更がいるため削除
for kernel in kernels:
    SVM = SVC(max_iter=2000, kernel=kernel) # ロジスティック回帰
    SVM.fit(x_train, y_train) # 学習
    y_pred = SVM.predict(x_test) # テストデータの予測値
    print(kernel, ' 学習時スコア:', SVM.score(x_train, y_train), '検証スコア', SVM.score(x_test, y_test))

[Out]
linear  学習時スコア: 0.975 検証スコア 1.0
poly  学習時スコア: 0.983 検証スコア 1.0
rbf  学習時スコア: 0.958 検証スコア 1.0
sigmoid 学習時スコア: 0.367 検証スコア 0.2[In]
_C, _gamma = [0.01, 0.1, 1, 10, 100], [0.01, 0.1, 1, 10, 100]
_C, _gamma = np.meshgrid(_C, _gamma)
params = np.array([_C.ravel(), _gamma.ravel()]).T #Cとgammaを組み合わせたリスト(5×2=25個)
for C, gamma in params:
SVM = SVC(C=C, gamma=gamma, max_iter=2000) # ロジスティック回帰
SVM.fit(x_train, y_train) # 学習
y_pred = SVM.predict(x_test) # テストデータの予測値
print('C=', C, 'gamma=', gamma, ' 学習時スコア:', SVM.score(x_train, y_train), '検証スコア', SVM.score(x_test, y_test))
[Out]
C= 0.01 gamma= 0.01 学習時スコア: 0.36666666666666664 検証スコア 0.2
C= 0.1 gamma= 0.01 学習時スコア: 0.6916666666666667 検証スコア 0.5666666666666667
C= 1.0 gamma= 0.01 学習時スコア: 0.9333333333333333 検証スコア 0.9333333333333333
C= 10.0 gamma= 0.01 学習時スコア: 0.9666666666666667 検証スコア 1.0
C= 100.0 gamma= 0.01 学習時スコア: 0.975 検証スコア 1.0
C= 0.01 gamma= 0.1 学習時スコア: 0.36666666666666664 検証スコア 0.2
C= 0.1 gamma= 0.1 学習時スコア: 0.9333333333333333 検証スコア 0.9333333333333333
C= 1.0 gamma= 0.1 学習時スコア: 0.9666666666666667 検証スコア 1.0
C= 10.0 gamma= 0.1 学習時スコア: 0.9833333333333333 検証スコア 1.0
C= 100.0 gamma= 0.1 学習時スコア: 0.9833333333333333 検証スコア 1.0
C= 0.01 gamma= 1.0 学習時スコア: 0.36666666666666664 検証スコア 0.2
C= 0.1 gamma= 1.0 学習時スコア: 0.95 検証スコア 1.0
C= 1.0 gamma= 1.0 学習時スコア: 0.9666666666666667 検証スコア 1.0
C= 10.0 gamma= 1.0 学習時スコア: 0.9833333333333333 検証スコア 1.0
C= 100.0 gamma= 1.0 学習時スコア: 0.9916666666666667 検証スコア 1.0
C= 0.01 gamma= 10.0 学習時スコア: 0.36666666666666664 検証スコア 0.2
C= 0.1 gamma= 10.0 学習時スコア: 0.49166666666666664 検証スコア 0.23333333333333334
C= 1.0 gamma= 10.0 学習時スコア: 1.0 検証スコア 0.9666666666666667
C= 10.0 gamma= 10.0 学習時スコア: 1.0 検証スコア 0.9666666666666667
C= 100.0 gamma= 10.0 学習時スコア: 1.0 検証スコア 0.9666666666666667
C= 0.01 gamma= 100.0 学習時スコア: 0.36666666666666664 検証スコア 0.2
C= 0.1 gamma= 100.0 学習時スコア: 0.36666666666666664 検証スコア 0.2
C= 1.0 gamma= 100.0 学習時スコア: 1.0 検証スコア 0.36666666666666664
C= 10.0 gamma= 100.0 学習時スコア: 1.0 検証スコア 0.43333333333333335
C= 100.0 gamma= 100.0 学習時スコア: 1.0 検証スコア 0.433333333333333356-4.決定木/R・C
特定のパラメータの条件値で分岐しながら数値・クラス予測をするモデルが決定木です。
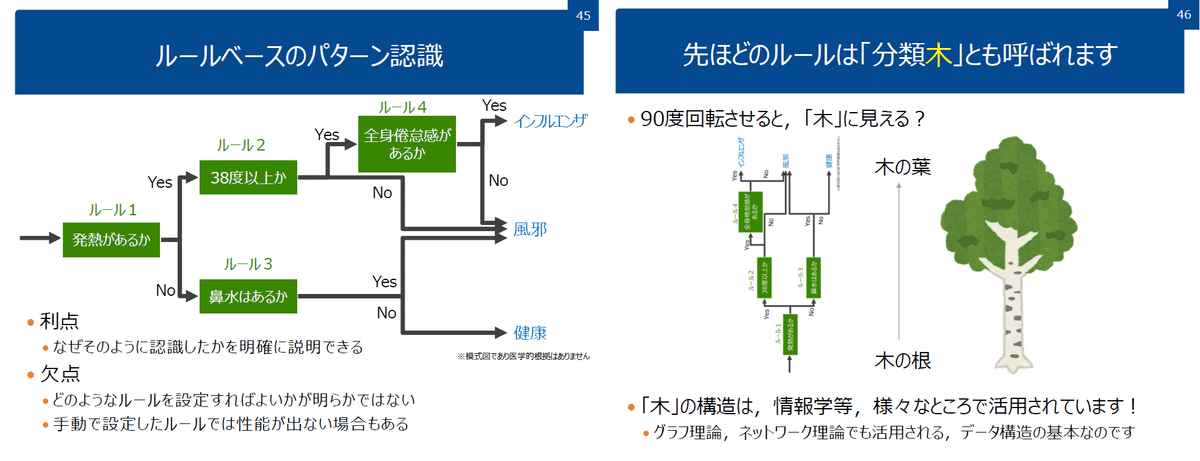
【決定技のパラメータ】
●max_depth:木構造の深さ->深いほど表現力は上がるが過学習
●min_sample_split:分割していった時のグループ内の最小データ数
->小さいほど分岐が進むが過学習傾向
[In]
from sklearn.tree import DecisionTreeClassifier

tree = DecisionTreeClassifier()
tree.fit(x_train, y_train) # 学習
y_pred = tree.predict(x_test) # テストデータの予測値

print(tree.get_params())
print(y_pred)
print('学習時スコア:', tree.score(x_train, y_train), '検証スコア', tree.score(x_test, y_test))

[Out]
{'ccp_alpha': 0.0, 'class_weight': None, 'criterion': 'gini', 'max_depth': None, 'max_features': None, 'max_leaf_nodes': None, 'min_impurity_decrease': 0.0, 'min_impurity_split': None, 'min_samples_leaf': 1, 'min_samples_split': 2, 'min_weight_fraction_leaf': 0.0, 'random_state': None, 'splitter': 'best'}
[2 1 0 2 0 2 0 1 1 1 2 1 1 1 1 0 1 1 0 0 2 1 0 0 2 0 0 1 1 0]
学習時スコア: 1.0 検証スコア 1.0決定木ではモデルの支配的な変数の重要度をmodel.feature_importances_で出力できます。本ケースでは「petal width・length」が重要な要因であることが分かります。
[In]
import matplotlib.pyplot as plt
x = iris.feature_names #特徴量名 ->['sepal length (cm)','sepal width (cm)','petal length (cm)','petal width (cm)']
y = tree.feature_importances_ #特徴量の重要度 -> array([0.   , 0.013, 0.561, 0.427])
plt.barh(x, y)

[Out]
array([0.   , 0.013, 0.561, 0.427])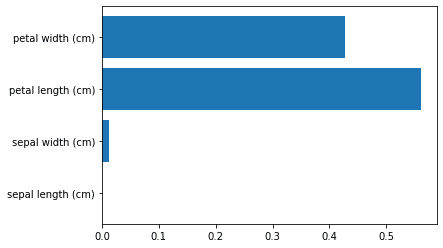
【木構造の可視化】
graphvizを使用して木構造の可視化が可能です(環境構築は別記事参照)
[In]
import graphviz
from sklearn.tree import export_graphviz

dot = export_graphviz(tree) #決定木モデルのdot形式を取得
graph = graphviz.Source(dot) #DOT記法をレンダリング
# print(dot) #Raw-Dotが出力
graph #グラフを出力

[Out]
下図参照:X[2]='petal length (cm)', X[3]='petal width (cm)'です。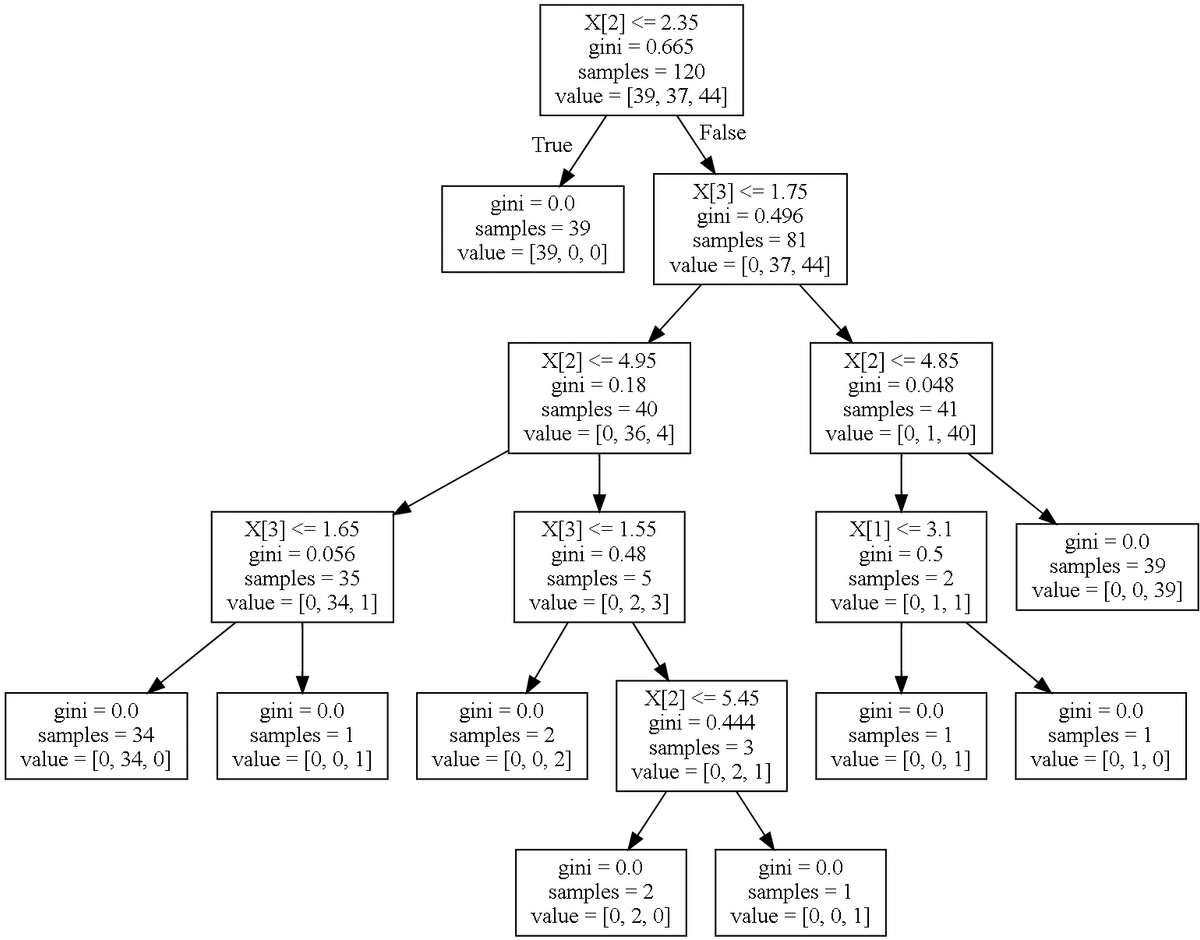
また引数を追加することで①色、②角を丸める、③各ノードでの過半数のラベル名、次元名を追加できます。
[In]
import graphviz
from sklearn.tree import export_graphviz

#決定木モデルのdot形式->色追加
dot = export_graphviz(tree, filled=True, rounded=True,
                      class_names=['setosa', 'versicolor', 'virginica'],
                      feature_names=['sepal length (cm)', 'sepal width (cm)', 'petal length (cm)', 'petal width (cm)'],
                      out_file=None)

graph = graphviz.Source(dot) #DOT記法をレンダリング
graph #グラフを出力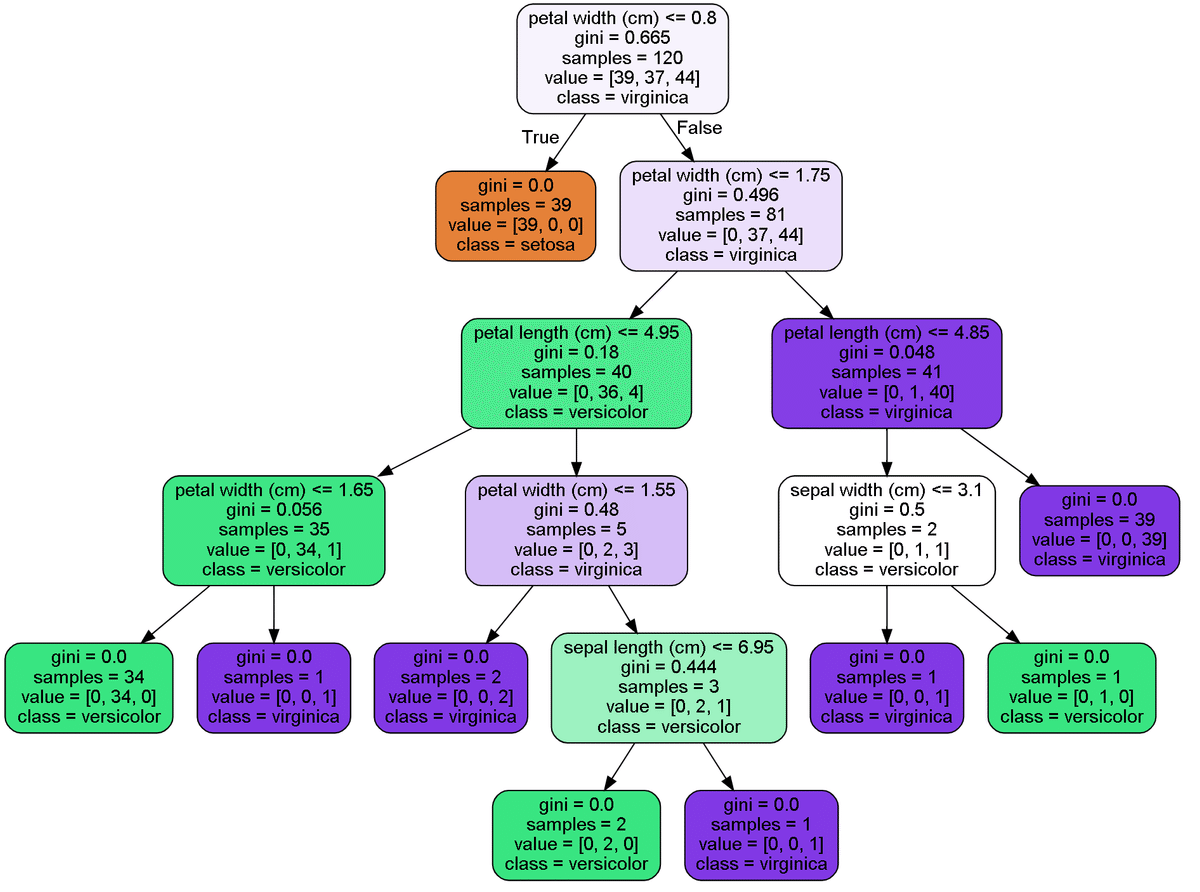
7.機械学習2:次元削減モデル
7-1.主成分分析:PCA
主成分分析は次元数を削減する手法です。多次元->2次元(3次元)にして可視化したり、多重共線性がある変数を削減して精度向上させたりします。
【PCAの注意点】
●教師無し学習にあたるため学習時にラベルデータは不要
●分散最大化のため事前に標準化(mean:0, std:1)の前処理が必要である。
【前処理(標準化)無し】
まずは参考で前処理無しのコードを記載します。PCAの寄与率(次元削減後のデータが持つ削減前の情報量)は"pca.explained_variance_ratio_"を使用します。なお4->2次元に削減後データは可視化しました。
[In]
from sklearn.decomposition import PCA

pca = PCA(n_components=2) #4次元->2次元に圧縮
pca.fit(iris.data)

pca.get_covariance() #共分散行列
x = pca.transform(iris.data)
df = pd.DataFrame(x, columns=['pca1', 'pca2'])

vratio = pca.explained_variance_ratio_ #寄与率:各主成分でどの程度元データの情報量を持っているか
print(vratio)
print(vratio.sum()) #寄与率合計:1.0出ない部分は情報が消失した

[Out]
[0.925 0.053] #vratio
0.9776852063187949 #vratio.sum()
[In] ※可視化
import matplotlib.pyplot as plt
plt.scatter(df['pca1'][:50], df['pca2'][:50], label='0:setosa', c='red', marker='o')
plt.scatter(df['pca1'][50:100], df['pca2'][50:100], label='1:versicolor', c='blue', marker='^')
plt.scatter(df['pca1'][100:], df['pca2'][100:], label='2:virginica', c='green', marker='s')
plt.legend(); plt.grid()
plt.show()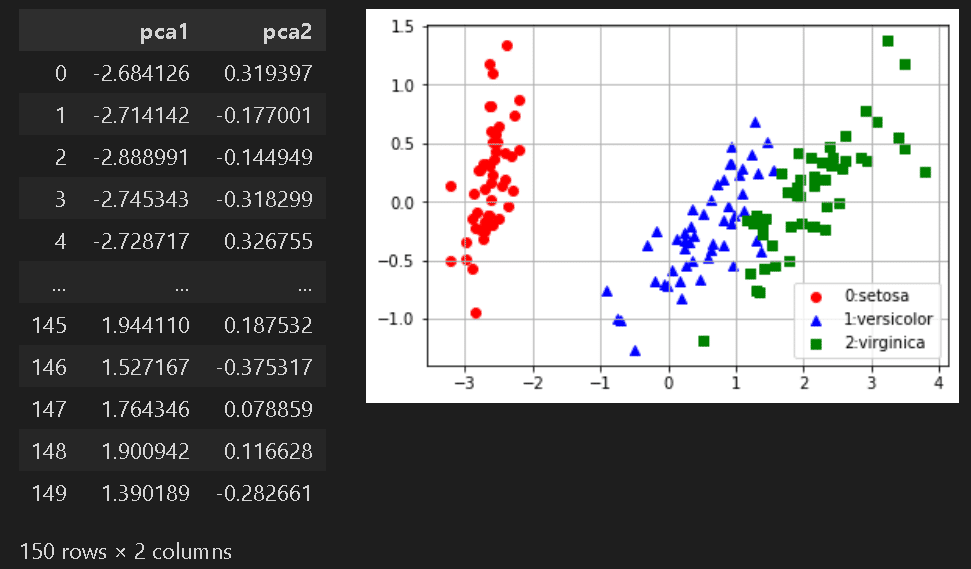
【前処理(標準化)あり】
次にパイプラインを使用して標準化を前処理に加えて作成します。
[In]
from sklearn.decomposition import PCA
from sklearn.pipeline import Pipeline
from sklearn.preprocessing import StandardScaler

#パイプライン
pipeline = Pipeline([
    ('scaler', StandardScaler()), #標準化
    ('pca', PCA(n_components=2)) #主成分分析
])

pipeline.fit(iris.data)
x = pipeline.transform(iris.data)
df = pd.DataFrame(x, columns=['pca1', 'pca2'])
vratio = pipeline['pca'].explained_variance_ratio_ #寄与率:各主成分でどの程度元データの情報量を持っているか
vratio.sum() #寄与率合計:1.0出ない部分は情報が消失した

plt.scatter(df['pca1'][:50], df['pca2'][:50], label='0:setosa', c='red', marker='o')
plt.scatter(df['pca1'][50:100], df['pca2'][50:100], label='1:versicolor', c='blue', marker='^')
plt.scatter(df['pca1'][100:], df['pca2'][100:], label='2:virginica', c='green', marker='s')
plt.legend(); plt.grid()
plt.show()

[Out]
[0.73  0.229]
0.9581320720000164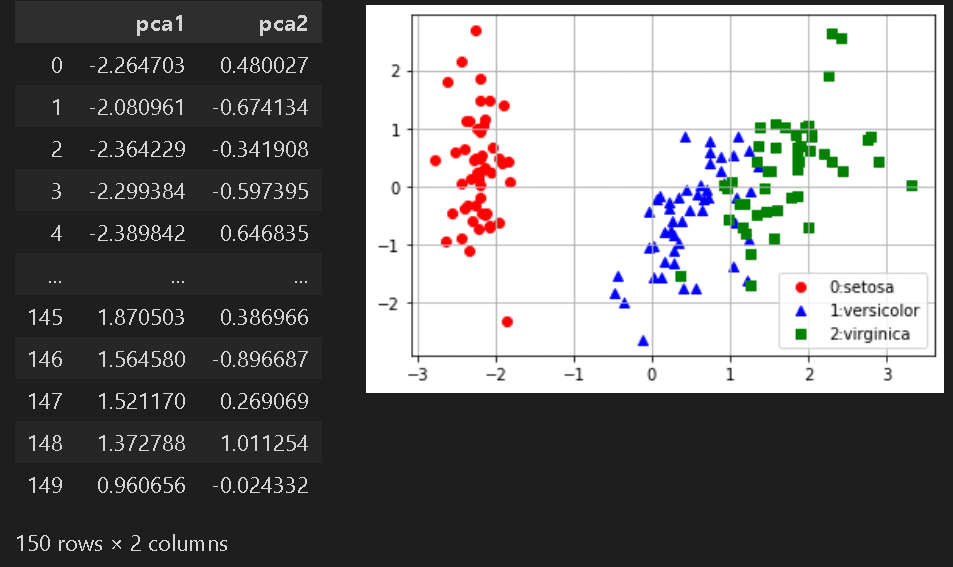
【参考資料】
主成分分析
— L (@ERUin2525) November 19, 2021
判別分析
カプランマイヤー推定量(打ち切りあり)
サポートベクターマシン
の過去ツイです。
機械学習も出題範囲にはなっています!ヽ(•̀ω•́ )ゝ✧#統計検定 pic.twitter.com/madO1cApZn
7-2.t-SNE
t-SNE (t-distributed Stochastic Neighbor Embedding)のサンプルコードは下記の通りです。
[IN]
import seaborn as sns
import matplotlib.pyplot as plt
from sklearn.manifold import TSNE
import numpy as np

X = np.array([[-1, -1], [-2, -1], [-3, -2], [1, 1], [2, 1], [3, 2]])
y = np.array([0, 0, 0, 1, 1, 1])
tsne = TSNE(n_components=2)
tsne_result = tsne.fit_transform(X)

sns.scatterplot(x=tsne_result[:, 0], y=tsne_result[:, 1], hue=y)
plt.show()

[OUT]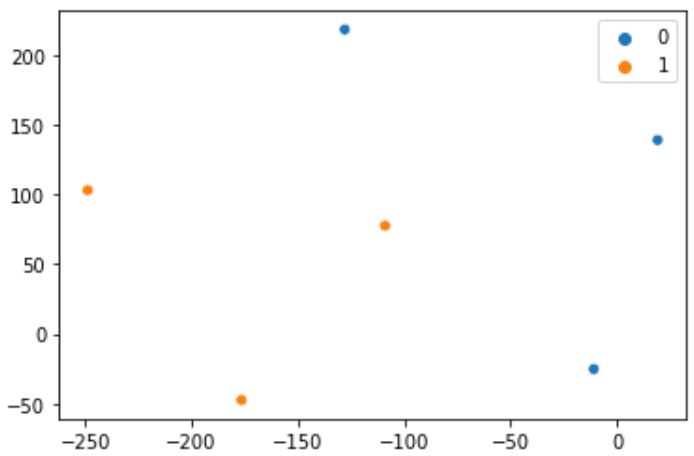
7-3.UMAP
UMAP (Uniform Manifold Approximation and Projection)を使用するためにはsklearnとは別にライブラリをインポートする必要があります。
[Terminal]
pip install umap-learnサンプルコードは下記の通りです。
[IN]
import seaborn as sns
import matplotlib.pyplot as plt
import numpy as np
import umap

X = np.array([[-1, -1], [-2, -1], [-3, -2], [1, 1], [2, 1], [3, 2]])
y = np.array([0, 0, 0, 1, 1, 1])
umap_result = umap.UMAP().fit_transform(X)

sns.scatterplot(x=umap_result[:, 0], y=umap_result[:, 1], hue=y)
plt.show()

[OUT]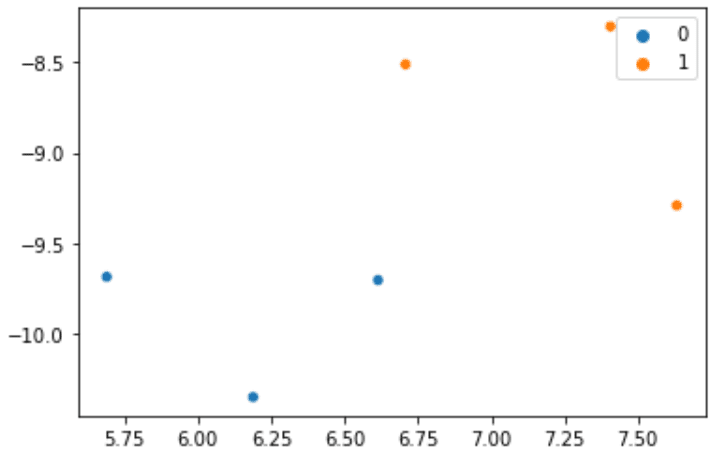
8.機械学習3:クラスタリング(グルーピングモデル)
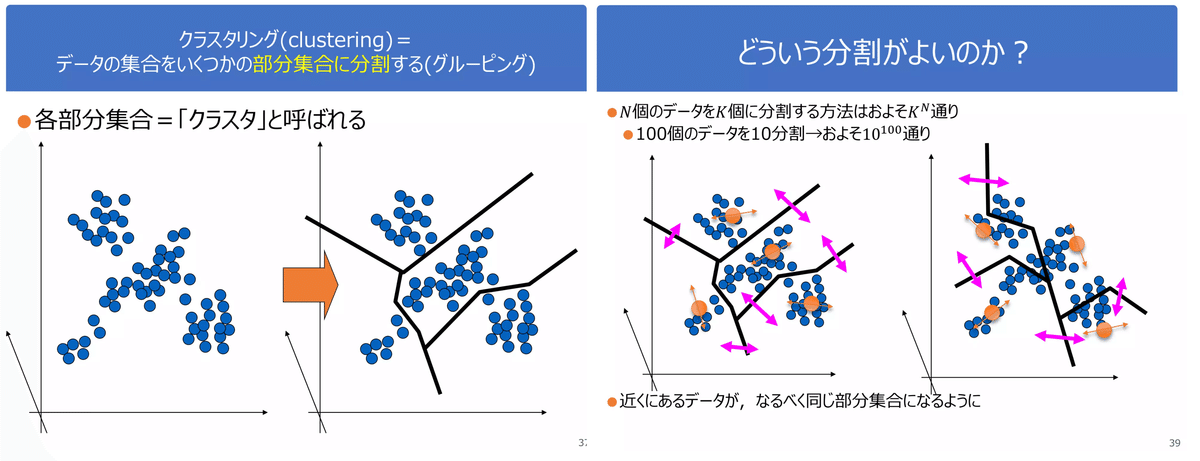
8-1.Kmean(k平均法)_教師無し
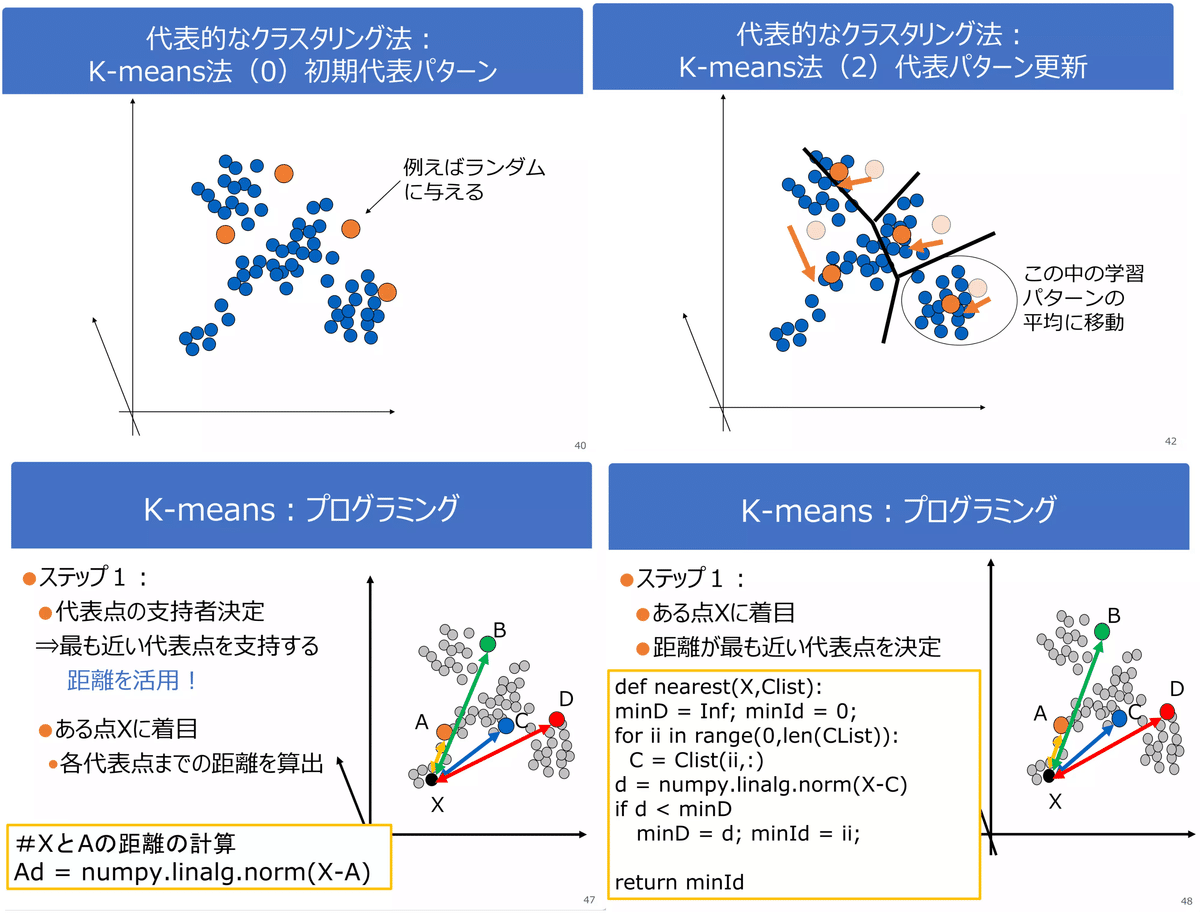
データの重心を取得して重心からの距離でグループ分けする手法です。
【KMeanの注意点】
●教師無し学習にあたるため学習時にラベルデータは不要
●値がコロコロ変わるので乱数値(重心の初期座標)を固定
[In]k
from sklearn.cluster import KMeans

kmeans = KMeans(n_clusters=3, random_state=10)
kmeans.fit(iris.data)
center = kmeans.cluster_centers_ #クラスタリングの中心値を取得

df = pd.DataFrame(center, columns=iris.feature_names, index=['group1', 'group2', 'group3'])
y_pred = kmeans.predict(iris.data) #クラスタリング結果を取得

accuracy = (y_pred == iris.target).sum()/len(y_pred) #正解率
print(f'正解率:{accuracy}')

[Out]
array([1, 1, 1, 1, 1, 1, 1, 1, 1, 1, 1, 1, 1, 1, 1, 1, 1, 1, 1, 1, 1, 1, 1, 1, 1, 1, 1, 1, 1, 1, 1, 1, 1, 1, 1, 1, 1, 1, 1, 1, 1, 1, 1, 1, 1, 1, 1, 1, 1, 1, 2, 2, 0, 2, 2, 2, 2, 2, 2, 2, 2, 2, 2, 2, 2, 2, 2, 2, 2, 2, 2, 2, 2, 2, 2, 2, 2, 0, 2, 2, 2, 2, 2, 2, 2, 2, 2, 2,
       2, 2, 2, 2, 2, 2, 2, 2, 2, 2, 2, 2, 0, 2, 0, 0, 0, 0, 2, 0, 0, 0, 0, 0, 0, 2, 2, 0, 0, 0, 0, 2, 0, 2, 0, 2, 0, 0, 2, 2, 0, 0, 0, 0, 0, 2, 0, 0, 0, 0, 2, 0, 0, 0, 2, 0, 0, 0, 2, 0, 0, 2])

正解率:0.893
参考までに前章の次元削減での2次元化+重心をプロットすることで可視化しました。明確に分かれているsetosaはグループ分けできますが、versicolorとvirinicaの境界部分がうまく分離できていないことが分かります。
[In]
from sklearn.decomposition import PCA
from sklearn.pipeline import Pipeline
from sklearn.preprocessing import StandardScaler
import japanize_matplotlib

#パイプライン
pipeline = Pipeline([
    ('scaler', StandardScaler()), #標準化
    ('pca', PCA(n_components=2)), #主成分分析
    ('kmeans', KMeans(n_clusters=3, random_state=33)) #クラスタリング
])

pipeline.fit(iris.data)
x = pipeline[:2].transform(iris.data)
y = pipeline['kmeans'].predict(x)

mask0, mask1, mask2 = (y == 0), (y == 1), (y == 2)
plt.scatter(x[mask0][:, [0]], x[mask0][:, [1]], label='0:setosa', c='red', marker='o')
plt.scatter(x[mask1][:, [0]], x[mask1][:, [1]], label='1:versicolor', c='blue', marker='^')
plt.scatter(x[mask2][:, [0]], x[mask2][:, [1]], label='2:virginica', c='green', marker='s')
plt.scatter(center[0][0], center[0][1], label='重心', c='black', s=200, marker='*')
plt.scatter(center[1][0], center[1][1], label='重心', c='black', s=200, marker='*')
plt.scatter(center[2][0], center[2][1], label='重心', c='black', s=200, marker='*')
plt.legend(); plt.grid()
plt.show()

[Out]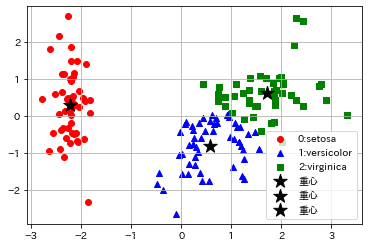
8-2.k-近傍法(k-nearest neighbor)_教師あり
k-近傍法(k-nearest neighbor)は分類と回帰の両方に用いられるアルゴリズムです。前述のk-平均法(k-means)とは別物になります。
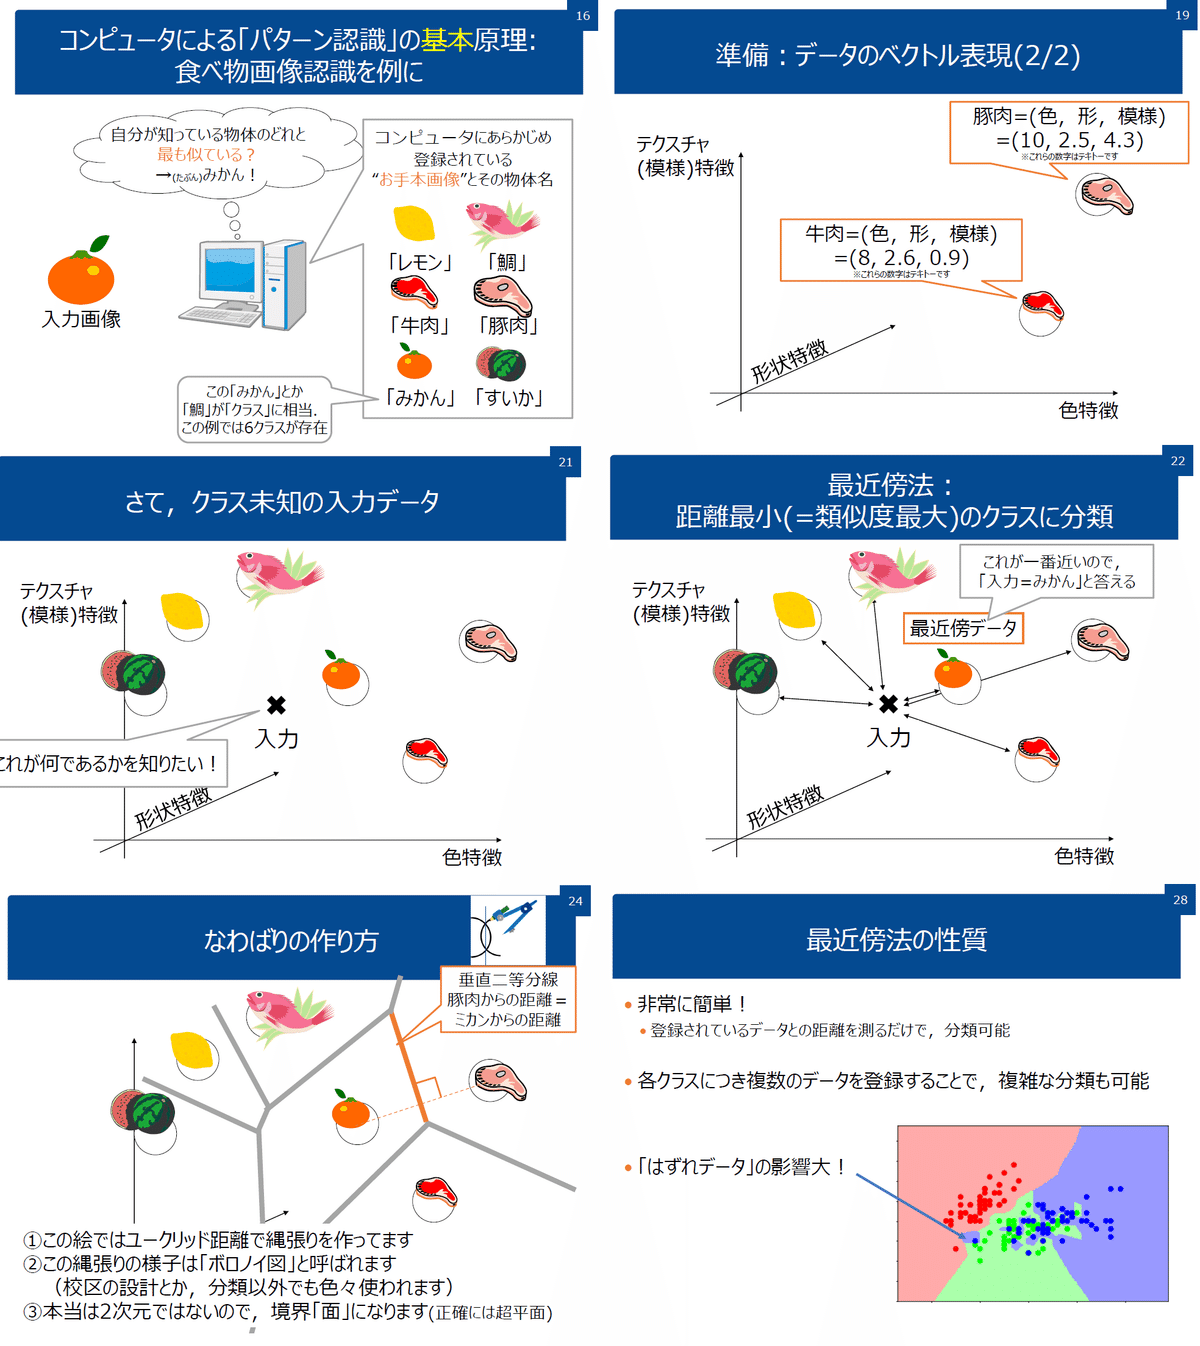

参考資料
https://www.ai-gakkai.or.jp/resource/aimap/
10 ways to use machine learning in trading (with the Python library): pic.twitter.com/3WUrXWCJBA
— PyQuant News 🐍 (@pyquantnews) August 17, 2023
あとがき
とりあえず先出し。後で細かく修正していきます。
