東証の変化率ランキングをスクレイピング【python】【selinium】【beautifulsoup】

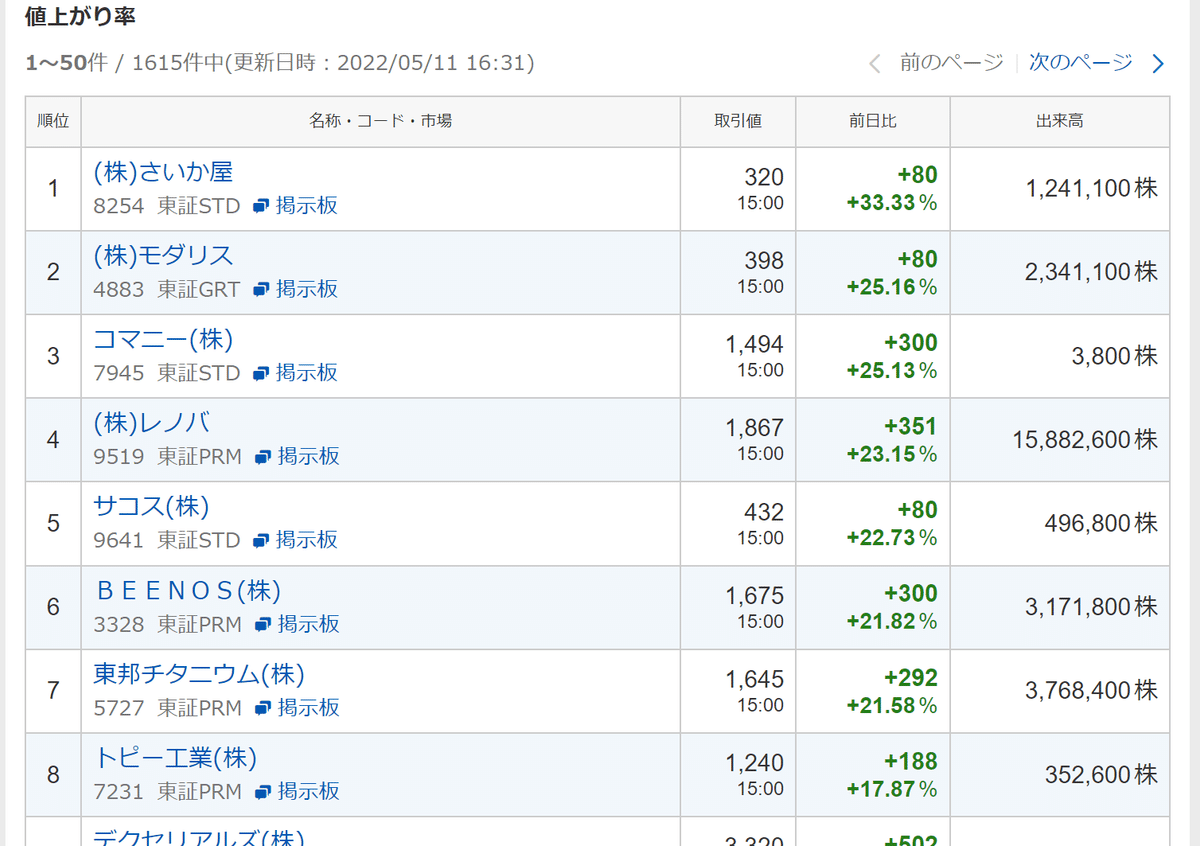
pythonの勉強にヤフーファイナンスから値上がり率上位・値下がり率下位を自動抽出してテーブルに並べるプログラムを作った。
指定の時間にいつでも実行できるので、タスクマネージャーやLINE notifyと組み合わせて銘柄監視の自動化に役立てたい。
前段:seliniumを使って上昇率上位を抽出
下段:beautifulsoupを使って下落率下位を抽出
※それぞれ作成したテーブルを指定ファイルに画像保存
from selenium import webdriver
from selenium.webdriver.common.by import By
from webdriver_manager.chrome import ChromeDriverManager
from time import sleep
import pandas as pd
import japanize_matplotlib
import matplotlib.pyplot as plt
import requests
from bs4 import BeautifulSoup

#selinium version
def jp_stock_raking_morning_ascending_selinium():
    #get latest chrome driver
    browser = webdriver.Chrome(ChromeDriverManager().install())

    #go to url
    url = 'https://info.finance.yahoo.co.jp/ranking/?kd=1&mk=2&tm=d&vl=a'
    browser.get(url)

    #wait until load
    sleep(4)

    #get all page element(s)
    elems_td = browser.find_elements(by=By.TAG_NAME, value="td")

    #prepare open frame to dump data
    keys = []

    #clense html data
    for elem_td in elems_td:
        #make raw data to text
        key = elem_td.text
        #eliminate nonuseful data
        key = key.replace("(株)","")
        key = key.replace("株","")
        key = key.split("\n")
        #make each data to array
        keys.extend(key)

    #reorganize array
    code = keys[1:135:9]
    name = keys[0:135:9]
    price = keys[4:135:9]
    time = keys[5:135:9]
    change = keys[6:135:9]
    percent = keys[7:135:9]
    volume = keys[8:135:9]

    #shorten name to fit table
    shortedname = []
    for shortname in name:
        shortname = shortname[:7]
        shortedname.append(shortname)
    shortedname

    #insert table column
    df = pd.DataFrame()
    df["証券コード"] = code
    df["企業"] = shortedname
    df["価格"] = price
    df["時間"] = time
    df["価格差"] = change
    df["前日比"] = percent
    df["出来高"] = volume

    #create table
    fig, ax = plt.subplots(figsize=(10,14))
    ax.axis('off')
    ax.axis('tight')
    table = ax.table(cellText=df.values,
             colLabels=df.columns,
             loc='center',
             bbox=[0,0,1,1])
    table.auto_set_font_size(False)
    plt.title("東証上昇銘柄", fontsize=30)
    table.set_fontsize(10)
    plt.savefig('JPEQRankUp.png')

#beautifulsoup version
def jp_stock_raking_morning_descending_beautifulsoup():
    import requests
    from bs4 import BeautifulSoup

    #access to website
    url = 'https://info.finance.yahoo.co.jp/ranking/?kd=2&mk=2&tm=d&vl=a'
    res = requests.get(url)

    #interpret to HTML
    soup = BeautifulSoup(res.text, 'html.parser')

    #get each element
    codes_li = []
    codes = soup.find_all('li', attrs={'class': '_2AbqlM50'})
    for code in codes:
        code_li = code.text
        codes_li.append(code_li)
    codes_li = codes_li[0:45:3]

    names_a = []
    names = soup.find_all('a', attrs={'data-ylk': 'slk:name;pos:0'})
    for name in names:
        name_a = name.text
        name_a = name_a.replace("(株)","")
        names_a_short = name_a[:7]
        names_a.append(names_a_short)
    names_a = names_a[:15]

    prices_span = []
    prices = soup.find_all('span', attrs={'class': '_3rXWJKZF'})
    for price in prices:
        price_span = price.text
        prices_span.append(price_span)
    prices_span = prices_span[:60:4]

    times_span = []
    times = soup.find_all('span', attrs={'class': '_3Kcv5jz2'})
    for time in times:
        time_span = time.text
        times_span.append(time_span)
    times_span = times_span[:15]

    changes_span = []
    changes = soup.find_all('span', attrs={'class': '_3rXWJKZF'})
    for change in changes:
        change_span = change.text
        changes_span.append(change_span)
    changes_span = changes_span[1:60:4]

    percents_span = []
    percents = soup.find_all('span', attrs={'class': '_1-yujUee Sc83af6i'})
    for percent in percents:
        percent_span = percent.text
        #percent_span = percent.string + '%'
        percents_span.append(percent_span)
    percents_span = percents_span[1:30:2]

    volumes_span = []
    volumes = soup.find_all('span', attrs={'class': '_1-yujUee'})
    for volume in volumes:
        volume_span = volume.text
        volumes_span.append(volume_span)
    volumes_span = volumes_span[3:60:4]

    #organize in table
    df = pd.DataFrame()
    df["証券コード"] = codes_li
    df["企業"] = names_a
    df["価格"] = prices_span
    df["時間"] = times_span
    df["価格差"] = changes_span
    df["前日比"] = percents_span
    df["出来高"] = volumes_span
    df

    #create table
    fig, ax = plt.subplots(figsize=(10,14))
    ax.axis('off')
    ax.axis('tight')
    table = ax.table(cellText=df.values,
             colLabels=df.columns,
             loc='center',
             bbox=[0,0,1,1])
    table.auto_set_font_size(False)
    plt.title("東証下落銘柄", fontsize=30)
    table.set_fontsize(10)
    plt.savefig('JPEQRankDown.png')

jp_stock_raking_morning_ascending_selinium()
jp_stock_raking_morning_descending_beautifulsoup()