IELTS ライティング①頻出問題 円グラフ4

本日はIELTSライティング①円グラフ問題について、IELTS講師にライティングを添削していただきました。
The pie chart shows the amount of money that a children’s charity located in the USA spent and received in one year.
この円グラフは、米国にある児童慈善団体が1年間に支出した金額と受け取った金額を示している。
Summarize the information by selecting and reporting the main features and make comparisons where relevant.
主な特徴を選んで報告することによって情報を要約し、関連する場合には比較を行いなさい。
イントロダクション
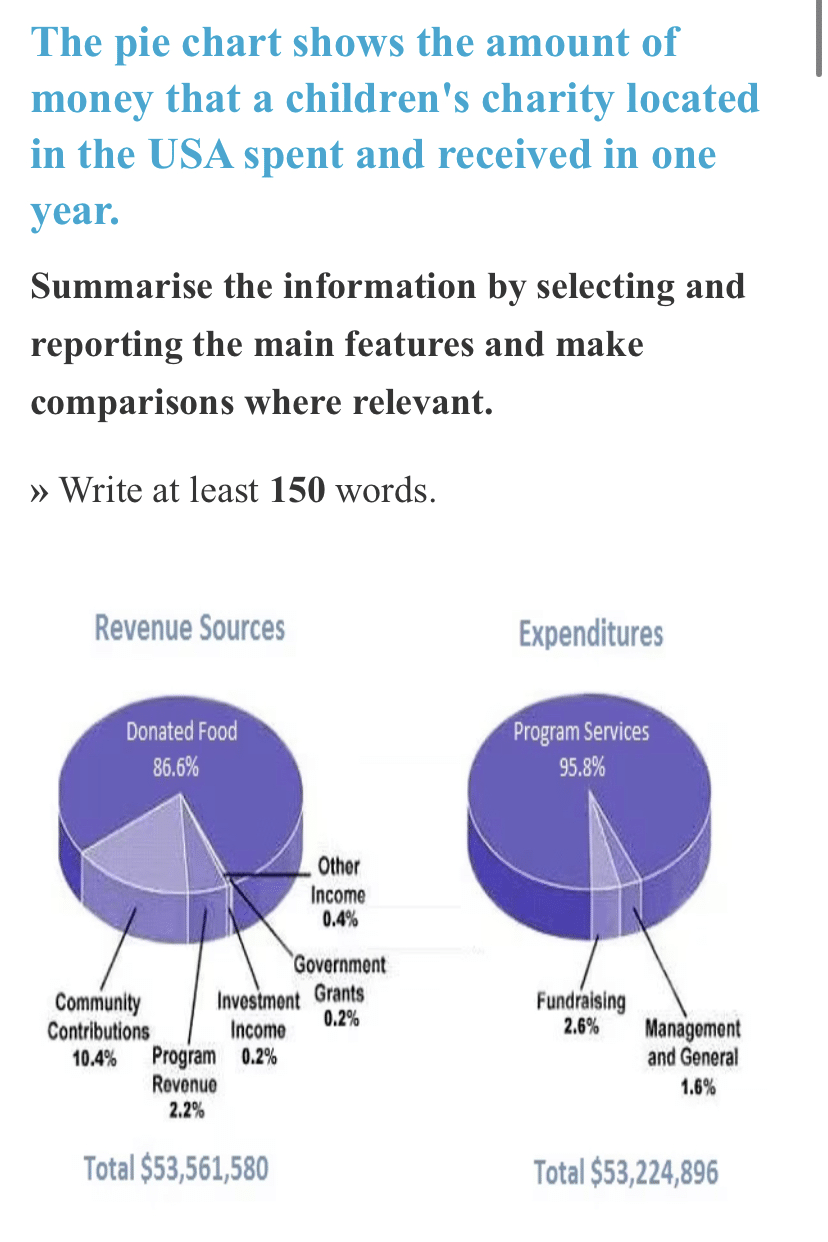
The provided two pie charts illustrate the percentage breakdowns of the revenue sources and expenditure of children’s charity located in USA in one year.
提供された2つの円グラフは、米国にある子供の慈善団体の1年間の収入源と支出の割合を示しています。
概要
Overall, it it obvious that donated food takes the majority share of revenue sources, while the cost of program service takes the biggest spending of all expenditure. In addition to that, the total amount of revenue is slightly larger than that of expenditure.
全体として、寄付された食料が収入源の大半を占めていることは明らかであり、プログラム・サービスの費用が支出全体の中で最大の支出を占めている。加えて、収入総額は支出総額よりもわずかに大きい。
詳細
More specifically, regarding charity’s revenue, the total amount of income is $53,561,580.
The largest revenue comes from donated food which is significantly higher than other revenues, making up 86.6%, followed by community contributions at 10.4%. The rest of the revenues sources are program revenue, other income, investment income and government grands which takes up 2.2%,0.4%,0.2% and 0.2% respectively.
具体的には、チャリティーの収入である、
収入の総額は53,561,580ドルである。
最大の収入源は寄付された食料品で、86.6%を占め、次いで地域社会からの寄付が10.4%となっている。残りの収入源は、プログラム収入、その他の収入、投資収入、政府補助金で、それぞれ2.2%、0.4%、0.2%、0.2%を占めている。
Going to its expenditure, the total cost amounts to $53,224,896 which is a little bit lower than the revenue with around $200,000 left to spare.
支出を見ると、総費用は5,322万4,896ドルで、収入より少し低く、約20万ドルの余裕がある。
The most spent expenditure is program services at 95.8%, followed by fundraising and management and general which constitute 2.6% and 1.6% each , which are obviously significantly lower than program services.
最も支出が多いのはプログラム・サービスで95.8%、次いで資金調達が2.6%、管理・一般が1.6%で、プログラム・サービスより明らかに少ない。