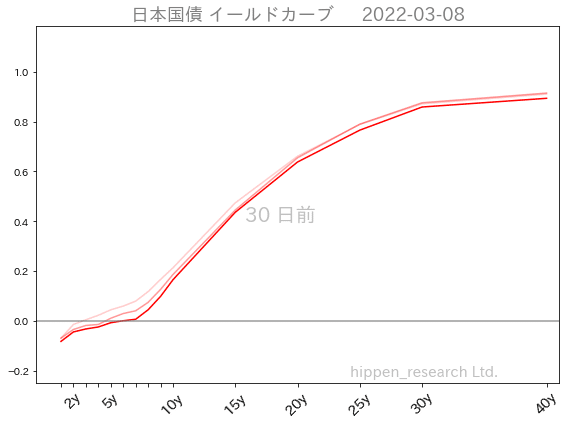
日本国債のイールドカーブを描く。
米国は景気回復後、インフレ抑制のために利上げに舵を切った。一方で、日本の景気回復は弱く、金融緩和の出口が見えないまま、黒田日銀総裁の任期が残り1年となった。
そんな中、急速な円安が進み、日米金利差が注視される状況にある。
弱い景気を背景に日銀は金融緩和をやめれない状況にあり、低空飛行をつづける日本の金利だが、円安抑制、もしくはインフレ抑制のために、なんらかの方針変更を迫られる可能性もある。また、すこし、先の話になるが、来年の任期満了を持って、路線が変更になる可能性もある。
そうなると金利が不安定になる事もありえるだろう。
そんな時に役立つ、日本国債のイールドカーブを見るツールを作成したので、紹介したい。
財務省が公開している金利情報を取得し、下記のようなイールドカーブを線画するツールです。
日本国債のイールドカーブ
— ひっぺん(米国株ブログ/Python) (@beikoku_kabu) April 19, 2022
2013-03 黒田総裁 就任
2013-04 黒田バズーカ 第1弾
2014-10 黒田バズーカ 第2弾
2016-01マイナス金利を導入
2016-09 イールドカーブコントロール
2018-04 黒田総裁 再任
2020-04 新型コロナ対策 金融緩和 pic.twitter.com/l4tPvpLCGD

財務省ホームページの下記から金利情報を取得します。https://www.mof.go.jp/jgbs/reference/interest_rate/index.htm

以下、ツールのプログラムです。
0.ライブラリのインストール
日本語表示ライブラリのインストール。
pip install japanize_matplotlib和暦→西暦変換ライブラリのインストール。
pip install jeraconv1.プログラムの実行
下記をコピペして実行。
import pandas as pd
import pandas_datareader.data as web
import matplotlib.animation as animation
from IPython.display import HTML
import japanize_matplotlib
from jeraconv import jeraconv
import matplotlib.pyplot as plt
from matplotlib import gridspec
%matplotlib inline

# 財務省HPからCSVダウンロード(過去、今年)
tbl=pd.read_csv("https://www.mof.go.jp/jgbs/reference/interest_rate/data/jgbcm_all.csv", encoding="shift-jis",header=1)
tbl2=pd.read_csv("https://www.mof.go.jp/jgbs/reference/interest_rate/jgbcm.csv", encoding="shift-jis",header=1)
# 過去と今年のデータを結合(インデックスは削除して結合)
tbl = pd.concat([tbl, tbl2], ignore_index=True)

# J2W クラスのインスタンス生成
j2w = jeraconv.J2W()

# 変換する「基準日」カラムを取得
nengous=tbl.loc[:,"基準日"]

# ループ前処理
i=0

# 和暦を西暦へ変換するループ処理
for nengou in nengous:

    nengou=nengou.replace('S', '昭和')
    nengou=nengou.replace('H', '平成')
    nengou=nengou.replace('R', '令和')
    seireki=str(j2w.convert(nengou.split('.')[0]+"年"))+"-"+nengou.split('.')[1]+"-"+nengou.split('.')[2]
    # 変換後データ格納
    tbl.loc[i,"基準日"]=seireki

    i=i+1

# グラフ作成用データ整形
df = tbl
# 日付をインデックスに指定
df.rename(columns={'基準日':'Date'},inplace=True)
df = df.set_index("Date")
# 日付のフォーマットを変換
df.index = pd.to_datetime(df.index, format = '%Y-%m-%d').strftime('%Y-%m-%d')
# 空データ削除
df = df.dropna()

# 1年分のデータを抽出(3000日ぐらいまではデータ拡張可能)
df=df.tail(30+10)

# フロート型変換(不純物が混じっているようだったので実施)
for j in range(len(df.columns)):
    for i in range(len(df.index)):

        if(str(df.iloc[i,j])[0:1] == "-"):
            df.iloc[i,j]=-float(str(df.iloc[i,j])[1:])
        else:
            df.iloc[i,j]=float(str(df.iloc[i,j]))

# グラフ作成処理
fig = plt.figure(facecolor='white',figsize=(8,6),tight_layout=True)#
spec = gridspec.GridSpec(ncols=1, nrows=1)
ax1 =  fig.add_subplot(spec[0,0], title='Yield Curve')

# 動画作成処理
def create_ani(i):
    # 前の画像をクリアする処理
    ax1.clear()

    # イールドカーブ作成処理(5日前、10日前の残像あり)
    ax1.plot([10,20,30,40,50,60,70,80,90,100,150,200,250,300,400], df.iloc[i-10,:].astype(float), color="red"  ,alpha=0.2)
    ax1.plot([10,20,30,40,50,60,70,80,90,100,150,200,250,300,400], df.iloc[i-5,:].astype(float), color="red"  ,alpha=0.4)
    ax1.plot([10,20,30,40,50,60,70,80,90,100,150,200,250,300,400], df.iloc[i,:].astype(float), color="red"  ,alpha=1)

    if(df.index[i] >= "2013-03-01") and (df.index[i] < "2013-04-01") :
        ax1.text(0.10, 0.90,"黒田総裁就任 2年で物価上昇2%の実現を表明",horizontalalignment='left', verticalalignment='top',transform=ax1.transAxes, fontsize=20,color="black"  ,alpha=0.7)

    if(df.index[i] >= "2013-04-01") and (df.index[i] < "2013-08-01") :
        ax1.text(0.10, 0.90,"黒田バズーカ 第1弾 質的・量的金融緩和策を導入",horizontalalignment='left', verticalalignment='top',transform=ax1.transAxes, fontsize=20,color="black"  ,alpha=0.7)

    if(df.index[i] >= "2014-10-01") and (df.index[i] < "2015-02-01") :
        ax1.text(0.10, 0.90,"黒田バズーカ 第2弾 質的・量的金融緩和策を拡大",horizontalalignment='left', verticalalignment='top',transform=ax1.transAxes, fontsize=20,color="black"  ,alpha=0.7)

    if(df.index[i] >= "2016-01-01") and (df.index[i] < "2016-05-01") :
        ax1.text(0.10, 0.90,"マイナス金利を導入",horizontalalignment='left', verticalalignment='top',transform=ax1.transAxes, fontsize=20,color="black"  ,alpha=0.7)

    if(df.index[i] >= "2016-09-01") and (df.index[i] < "2017-01-01") :
        ax1.text(0.10, 0.90,"イールドカーブコントロール政策を導入",horizontalalignment='left', verticalalignment='top',transform=ax1.transAxes, fontsize=20,color="black"  ,alpha=0.7)

    if(df.index[i] >= "2018-04-01") and (df.index[i] < "2018-08-01") :
        ax1.text(0.10, 0.90,"黒田総裁 再任",horizontalalignment='left', verticalalignment='top',transform=ax1.transAxes, fontsize=20,color="black"  ,alpha=0.7)

    if(df.index[i] >= "2020-04-01") and (df.index[i] < "2020-08-01") :
        ax1.text(0.10, 0.90,"新型コロナ対策で金融緩和を強化",horizontalalignment='left', verticalalignment='top',transform=ax1.transAxes, fontsize=20,color="black"  ,alpha=0.7)

    #グラフ内の文字出力
    ax1.text(0.40, 0.50,str(len(df)-i) +" 日前",horizontalalignment='left', verticalalignment='top',transform=ax1.transAxes, fontsize=20,color="gray"  ,alpha=0.5)
    ax1.text(0.6, 0.05,"hippen_research Ltd.",horizontalalignment='left', verticalalignment='top',transform=ax1.transAxes, fontsize=15,color="gray"  ,alpha=0.5)
    #グラフタイトル設定
    ax1.set_title(label=('日本国債 イールドカーブ' +"   "+df.index[i]), fontsize=18,color="gray")

    # 金利の長さ合わせてX軸の幅を調整
    ax1.set_xticks([10,20,30,40,50,60,70,80,90,100,150,200,250,300,400])
    ax1.set_xticklabels(["","2y","","","5y","","","","","10y","15y","20y","25y","30y","40y"],fontsize=14)
    # 動画が見やすくなるようにX軸とY軸の最大値・最小値を固定
    ax1.set_ylim(df.min().min()-0.1,df.max().max()+0.1)
    ax1.set_xlim(-10,410)

    # 軸を傾ける処理
    ax1.tick_params(axis='x', labelrotation=45)
    # ±0を灰色で線画
    ax1.axhline(y=0,color="gray",alpha=0.8)
    plt.show()

# 動画作成処理を呼び出し
ani = animation.FuncAnimation(fig, create_ani, interval=100,frames = (range(len(df)-30,len(df),1)), repeat=True)
# 動画バージョン2(直下にファイル出力)
# ani.save('rate.mp4', writer="ffmpeg",dpi=200,savefig_kwargs = {'facecolor':'white'}, fps=40)
HTML(ani.to_html5_video())
下記の記述でデータを絞っています。数値を変更して期間の長さを変更することができます。(5日前と10日前の残像を描くため、10日分、余分にデータを残しています。)
# 1年分のデータを抽出(3000日ぐらいまではデータ拡張可能)
df=df.tail(30+10)
下記の記載で動画にする期間を直近30日間に絞っています。数値を変更して期間の長さを延ばすことができます。「1」の部分を変更すると時間を早く進めることができます。期間を延ばす時は、少し大きめの値を設定すると良いでしょう。
# 動画作成処理を呼び出し
ani = animation.FuncAnimation(fig, create_ani, interval=100,frames = (range(len(df)-30,len(df),1)), repeat=True)
2.結果出力
下記のような結果が出力されます。(正確には動画で表示される。)

何かの参考になれば幸いです。
「缶コーヒー1杯、ご馳走してあげよう」という太っ腹な人は投げ銭を!
課金しなくても、参考になったら「ハートボタン、フォロー、リツイート」をお願いします。読まれる可能性があがるので、次の記事を書くやる気が出ます。
3.おまけ
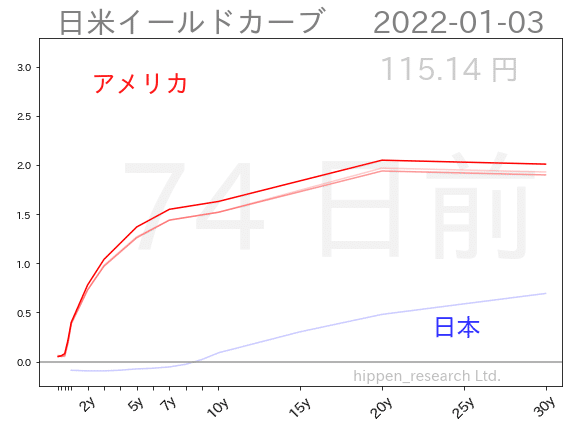
下記のドル円と日米金利差を出力するツールもおまけで作成したので、おまけにつけておきます。(おまけ程度で作ったものなので、少し雑なコードになっています。その点はご了承ください。)
日米イールドカーブとドル円
— ひっぺん(米国株ブログ/Python) (@beikoku_kabu) April 20, 2022
(2022/1~ 4/19)#ドル円 #日米金利差 pic.twitter.com/j8i5hwnmSN

ここから先は
¥ 100
この記事が気に入ったらチップで応援してみませんか?
