
衆院選挙後のたまきチャンネルLIVEで、玉木雄一郎さんが述べた単語ランキング
どうも、データサイエンティストの破綻国家研究所です。
はじめに
2024年10月27日の衆議院選挙で、国民民主党は7議席から28議席に大躍進しました(本当は31議席とっていたが、擁立者が足りなかった)。
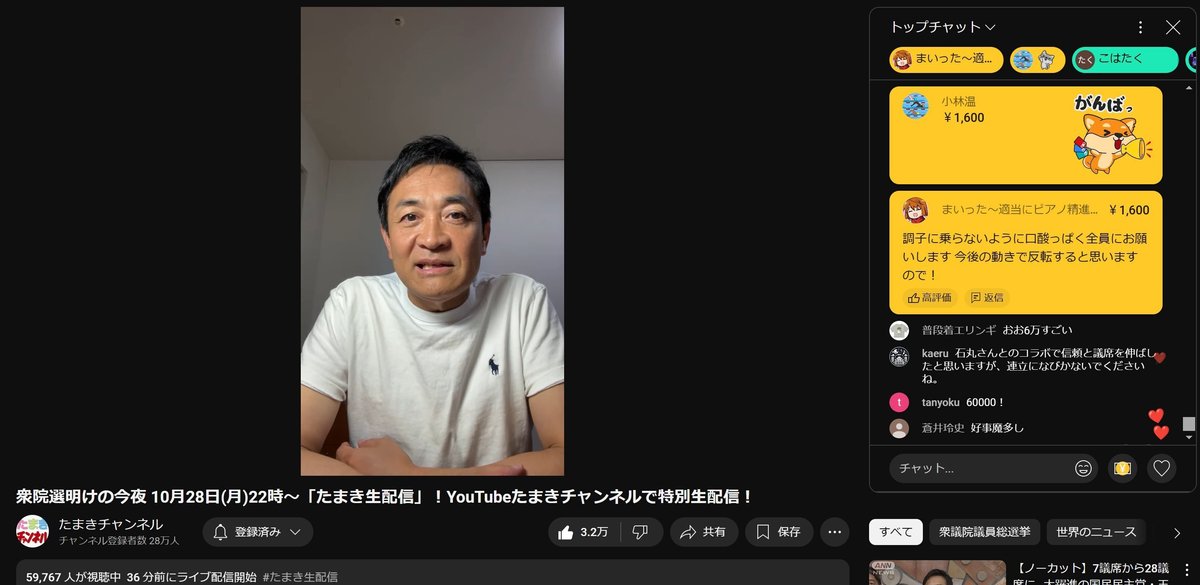
さて、選挙後翌日の10月28日、YouTubeチャンネルのたまきチャンネルライブで、国民民主党党首の玉木雄一郎さんが選挙の振り返りを行いました。
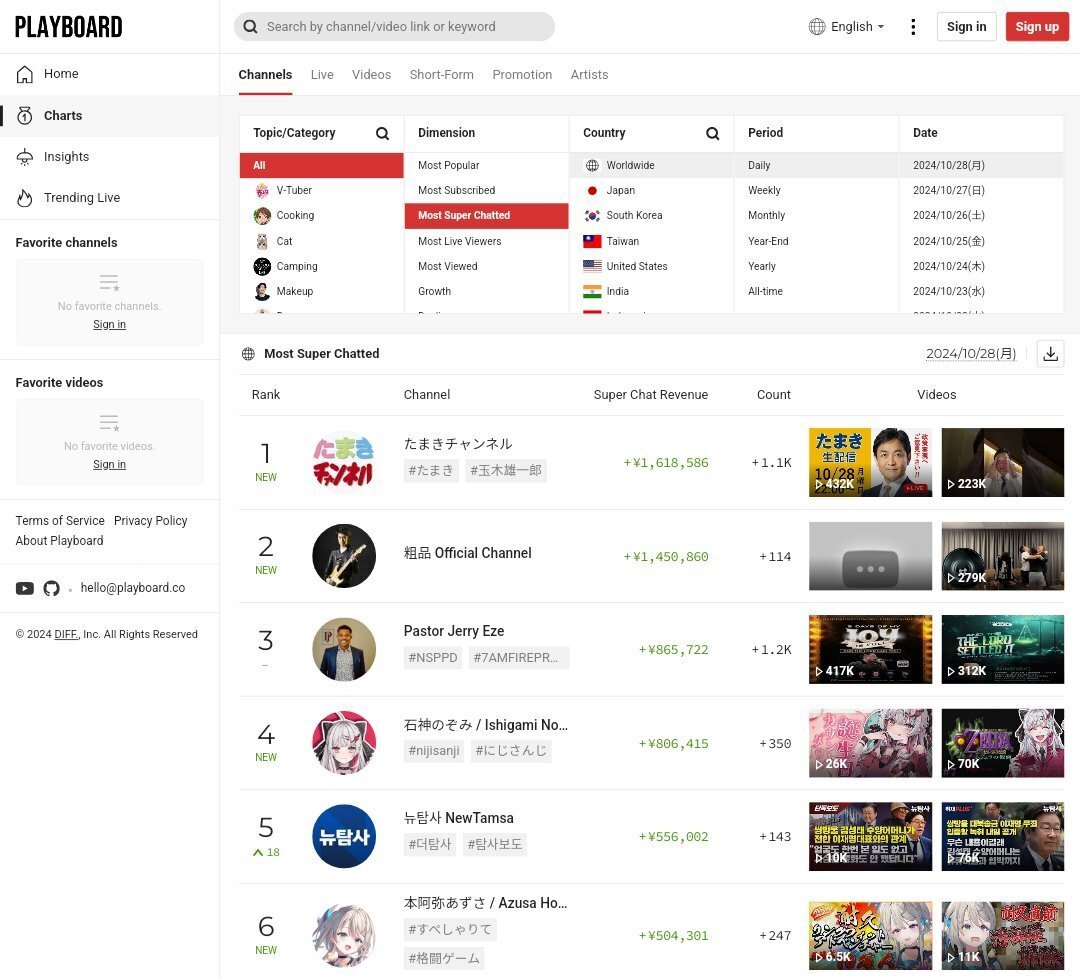
その際、同接数国内1位、スパチャ金額世界1位を達成しています。
すごいですね!
スパチャが飛び交っていますが、丁寧にスパチャを読んでいました。うーん、まじめなお人柄だ。
始まったな、この国

では、玉木雄一郎さんは選挙後のライブでどのようなことを語ったのでしょうか?
気になったので可視化してみました。
コード作成
言語はPython, 環境はJupyter notebook(WinPython)を使用。
コードはこちらに置いておきます。各自ダウンロードください。
まずはpipをインストールします。
いろいろ試したのでいらないものも入っていますが全部入れちゃいましょう!
pip install yt-dlp pytube youtube-transcript-api tqdm pandas transformers torch fugashi ipadic sentencepieceうまくインストールされていますね。

次にundicという辞書をインストールします。
!pip install unidic
!python -m unidic download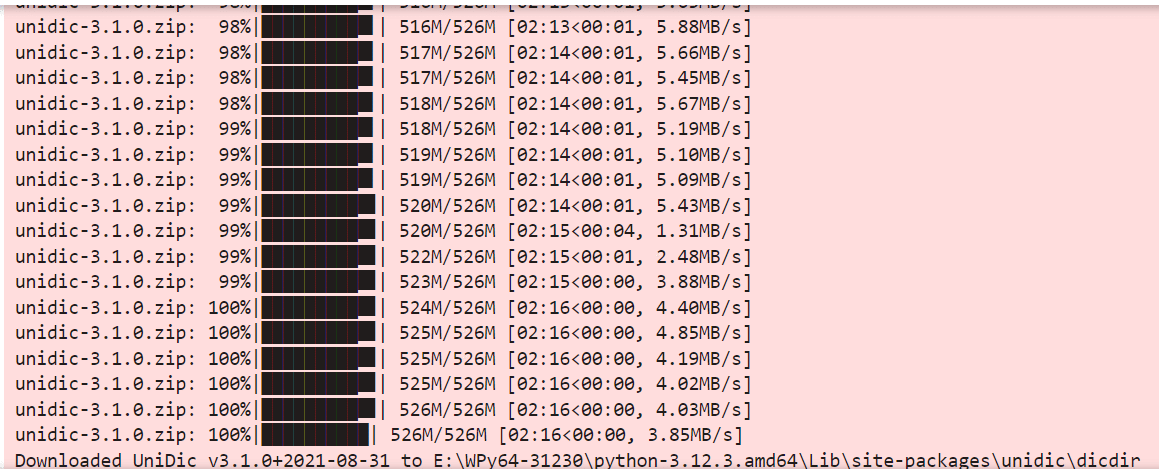
次に調べたいYouTubeの動画の文字おこしから、文字を取得します。
取得した文字おこし文は、text_data.txtデータに保存されます。
今回対象のたまきチャンネルライブ
取得したテキストデータは、データ提供の見出しにあります。ところどころおかしな日本語があります。YouTubeの文字おこしの限界です。LLMなどで自然な日本語にすると、精度は上がるかもしれません。
ifrom youtube_transcript_api import YouTubeTranscriptApi
import re

def get_transcript_with_rule_based_punctuation(video_url, language_code='ja'):
    try:
        # URLから動画IDを抽出
        video_id_match = re.search(r'v=([^&]+)', video_url)
        if video_id_match:
            video_id = video_id_match.group(1)
        else:
            return "動画IDを抽出できませんでした。"

        # 字幕を取得
        transcript = YouTubeTranscriptApi.get_transcript(video_id, languages=[language_code])

        # 動画全体の字幕を抽出し、1行にまとめる
        raw_text = "".join(entry['text'] for entry in transcript)

        # 「です」「ます」「ました」「ございます」などで区切る。
        text_with_punctuation = re.sub(
            r'(です|ます|ました|ございます|いただきます|思います|ください|いきます)(?![。!?])', r'\1。', raw_text
        )

        return text_with_punctuation.strip()
    except Exception as e:
        return f"エラー: {e}"

# 使用例
video_url = 'https://www.youtube.com/watch?v=4wZhheuYyrU'
text_data = get_transcript_with_rule_based_punctuation(video_url)
with open("text_data.txt", "w", encoding="utf-8") as file:
    file.write(text_data)

print("動画全体の字幕がテキストデータとして'text_data.txt'に保存されました。")
次にいろいろと処理しました。動詞を抜いたり、単語を結語したり、人力で試行錯誤しています。
from fugashi import Tagger
from collections import Counter
import pandas as pd

# 解析器の設定
tagger = Tagger()

# 敬語や古い表記を一般的な形に変換するための辞書
replacement_dict = {
    "御座る": "ある",
    "為る": "する",
    "呉れる": "くれる",
    "下さる": "くださる",
    "頂く": "いただく",
    "成る": "なる",
    "居る": "いる",
    "遣る": "やる",
    "有る": "ある",
    "良い": "よい",
    "貰う": "もらう",
    "出来る": "できる",
    "仕舞う": "しまう",
}

# 対象のテキスト
text = get_transcript_with_rule_based_punctuation(video_url)

# 特定の名詞・動詞・形容詞を抽出し、名詞は2つまで結合
words = []
temp_noun = []  # 一時的に連続する名詞を格納

for word in tagger(text):
    pos1 = word.feature.pos1  # 主な品詞
    pos2 = word.feature.pos2  # 詳細な品詞(名詞の場合の種類など)

    if pos1 == '名詞' and pos2 in ('普通名詞', '固有名詞'):
        temp_noun.append(word.surface)
        if len(temp_noun) == 2:
            words.append("".join(temp_noun))
            temp_noun = []
    else:
        if temp_noun:
            words.append("".join(temp_noun))
            temp_noun = []
        elif pos1 == '動詞' or pos1 == '形容詞':
            lemma = word.feature.lemma
            lemma = replacement_dict.get(lemma, lemma)
            words.append(lemma)

if temp_noun:
    words.append("".join(temp_noun))

filtered_words = [w for w in words if len(w) > 1]
filtered_words = ["ございます" if w == "ござい" else w for w in filtered_words]

word_counts = Counter(filtered_words)

df = pd.DataFrame(word_counts.items(), columns=['単語', '出現回数']).sort_values(by='出現回数', ascending=True)

file_path = 'word_counts_sorted.xlsx'
df.to_excel(file_path, index=False)

print(f"単語の出現回数を昇順に並べ替えたデータを{file_path}に保存しました。")
from fugashi import Tagger
from collections import Counter
import pandas as pd

tagger = Tagger()

text = get_transcript_with_rule_based_punctuation(video_url))
replacement_dict = {
    "御座る": "ある",
    "為る": "する",
    "呉れる": "くれる",
    "下さる": "くださる",
    "頂く": "いただく",
    "成る": "なる",
    "居る": "いる",
    "遣る": "やる",
    "有る": "ある",
    "良い": "よい",
    "貰う": "もらう",
    "出来る": "できる",
    "仕舞う": "しまう",
}

# 名詞を抽出し、名詞は2つまで結合
words = []
temp_noun = []  # 一時的に連続する名詞を格納

for word in tagger(text):
    pos1 = word.feature.pos1  # 主な品詞
    pos2 = word.feature.pos2  # 詳細な品詞(名詞の場合の種類など)

    # 名詞が連続している場合のみ一時的に追加
    if pos1 == '名詞' and pos2 in ('普通名詞', '固有名詞'):
        temp_noun.append(word.surface)
        # 名詞が2つ連続したら結合して追加し、リセット
        if len(temp_noun) == 2:
            words.append("".join(temp_noun))
            temp_noun = []
    else:
        if temp_noun:
            words.append("".join(temp_noun))
            temp_noun = []

if temp_noun:
    words.append("".join(temp_noun))

filtered_words2 = [w for w in words if len(w) > 1]

word_counts2 = Counter(filtered_words2)

df2 = pd.DataFrame(word_counts2.items(), columns=['単語', '出現回数']).sort_values(by='出現回数', ascending=False)

file_path = 'noun_word_counts_sorted2.xlsx'
df2.to_excel(file_path, index=False)

print(f"名詞の出現回数を降順に並べ替えたデータを{file_path}に保存しました。")
解析結果
ヒストグラムで可視化
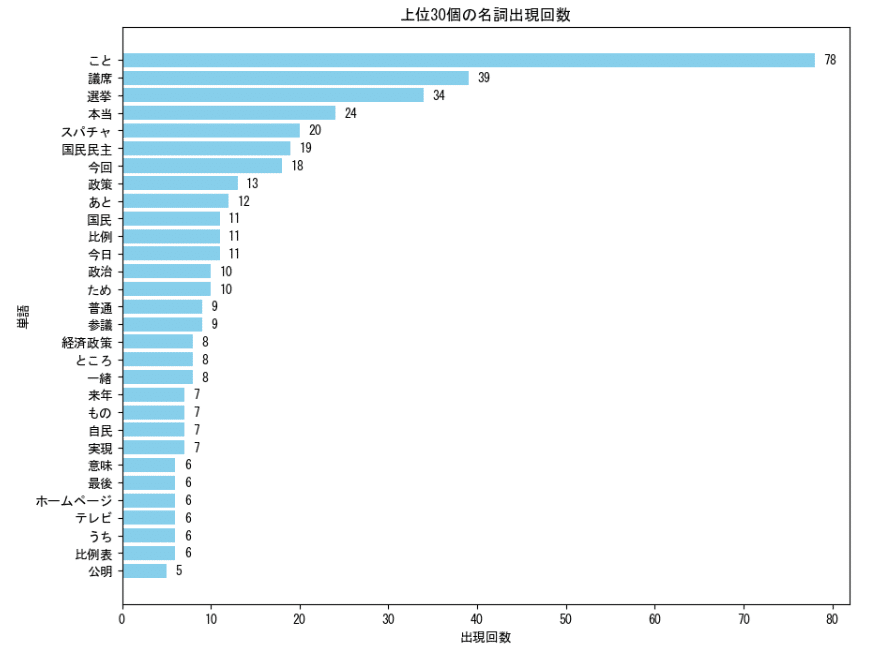
まずはヒストグラムで上位30位の単語ランキングを作ってみました。
import matplotlib.pyplot as plt

top_n = 30
top_words = df2.head(top_n)

plt.figure(figsize=(10, 10))
bars = plt.barh(top_words['単語'], top_words['出現回数'], color='skyblue')
plt.xlabel('出現回数')
plt.ylabel('単語')
plt.title(f'上位{top_n}個の名詞出現回数')
plt.gca().invert_yaxis()

for bar in bars:
    plt.text(bar.get_width() + 1, bar.get_y() + bar.get_height() / 2,
             f'{int(bar.get_width())}', va='center')

plt.show()
1位は"こと"で、~~することといった動名詞のやつです。
これは置いておいて、2位に議席、3位に選挙、4位に本当とあります。
"本当"については「本当にしんどかった」「本当に国民民主が消えると思って選挙をやった」など、玉木さん、お辛かったんだろうなと思いました。
そして5位にスパチャ、6位に国民民主が見えますね。おもしろい!
8位に"政策"とあるのは、選挙で一貫して国民民主党は政策本位と訴えていたことで、それをLIVEでも述べたようです。
ワードクラウド(単語の大きさが変わる画像)で可視化
まずはコードを作ってみました。
from wordcloud import WordCloud
import matplotlib.pyplot as plt
from collections import Counter
from fugashi import Tagger

tagger = Tagger()
text = get_transcript_with_rule_based_punctuation(video_url)

# 敬語や古い表記を一般的な形に変換するための辞書
replacement_dict = {
    "御座る": "ある",
    "為る": "する",
    "呉れる": "くれる",
    "下さる": "くださる",
    "頂く": "いただく",
    "成る": "なる",
    "居る": "いる",
    "遣る": "やる",
    "有る": "ある",
    "良い": "よい",
    "貰う": "もらう",
    "出来る": "できる",
    "仕舞う": "しまう",
}

# 名詞を抽出し、名詞は2つまで結合
filtered_words2 = []
temp_noun = []  # 一時的に連続する名詞を格納

for word in tagger(text):
    pos1 = word.feature.pos1  # 主な品詞
    pos2 = word.feature.pos2  # 詳細な品詞(名詞の場合の種類など)

    if pos1 == '名詞' and pos2 in ('普通名詞', '固有名詞'):
        temp_noun.append(word.surface)
        if len(temp_noun) == 2:
            filtered_words2.append("".join(temp_noun))
            temp_noun = []
    else:
        if temp_noun:
            filtered_words2.append("".join(temp_noun))
            temp_noun = []

if temp_noun:
    filtered_words2.append("".join(temp_noun))

word_counts2 = Counter(filtered_words2)

font_path = r"E:/Noto_Sans_JP/static/NotoSansJP-Bold.ttf"
wordcloud = WordCloud(width=800, height=400, background_color='white', font_path=font_path)
wordcloud.generate_from_frequencies(word_counts2)

plt.figure(figsize=(10, 5))
plt.imshow(wordcloud, interpolation='bilinear')
plt.axis('off')
plt.show()
可視化すると、こんな感じです。
ヒストグラムでは見えなかった細かな文字もわかりやすいですね。

やはり28議席とったので議席、皆(さん)、選挙、スパチャがでかでかとあります。
その他に
風(これまでは向かい風だったのが、今回風を起こせた)
石丸(マイク置きの際に石丸さんが選挙に行こうと演説)
ホームページ(党員募集、参議院選への候補の公募)
公明(国民民主党政策批判への批判)
普通(世の中の人たちは普通を求めていた)
などなど。おもしろいですね。
コード・出力データ提供
コードを提供します。可読性低くて汚いので、コードについては触れないでくださいね。
その他出力データも置いておきます。
感想と考察
今回はたまきチャンネルの衆議院選挙直後のライブから単語の可視化を行いました。
今回はYouTubeでしたが、例えばWeb会議でも使えるかもしれません。
政治家や議会のYouTube公開動画から、このような可視化を行うと面白いかもしれません。
次は伊藤たかえちゃんねるでやってみようかな。
ほなまた
