Python メモ(MatplotlibとSeaborn)
Matplotlib

●Pythonのためのグラフ描画ライブラリ
●NumPyやPandasとの連携が円滑
●Anacondaに含まれている外部ライブラリの一つ
【使い方】
1. ライブラリ(matplotlib.pyplot)のインポート
2. x軸の配列を作る
3. y軸の配列を作る
4. plot関数を使いプロットする
5. show関数を使いプロットしたグラフを描画する
#ライブラリのインポート
import matplotlib.pyplot as plt
%matplotlib inline

# グラフのサイズの指定
plt.figure(figsize=(4,4))
# 引数に指定された値のプロット。引数として、描画する点のx座標, y座標の設定、凡例に表示する文字列の設定
plt.plot([0,2,4,6,8], [0,6,12,24,48],  label="graph")
# x, y軸のラベルの設定
plt.xlabel("x axis")
plt.ylabel("y axis")
# タイトルの設定
plt.title("title")
# 凡例の表示
plt.legend()
plt.show()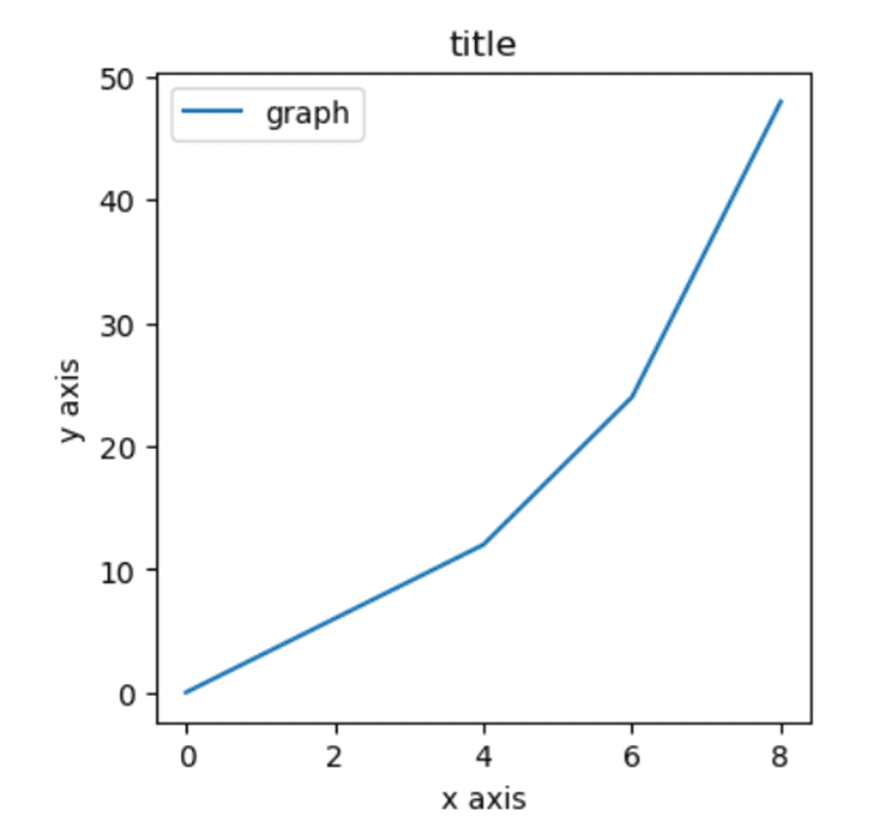
複数のグラフを別々に描きたい場合
plt.figure(figsize = (12,4))

# plt.subplotを用いて 行x列数分だけグラフを分割して表示
# subplot(行, 列, 表示する位置)と引数を与える

# 1列目に表示
plt.subplot(1,3,1)
plt.plot(x,y,label="y=x^2")
plt.legend()

# 2列目に表示
plt.subplot(1,3,2)
plt.plot(x,z,label="y=(x-1)^3")
plt.legend()

# 3列目に表示
plt.subplot(1,3,3)
plt.plot(x,w,label="y=((x-2)(x-4))^2")
plt.legend()

#グラフ同士の重なりを防ぐ
plt.tight_layout()
plt.show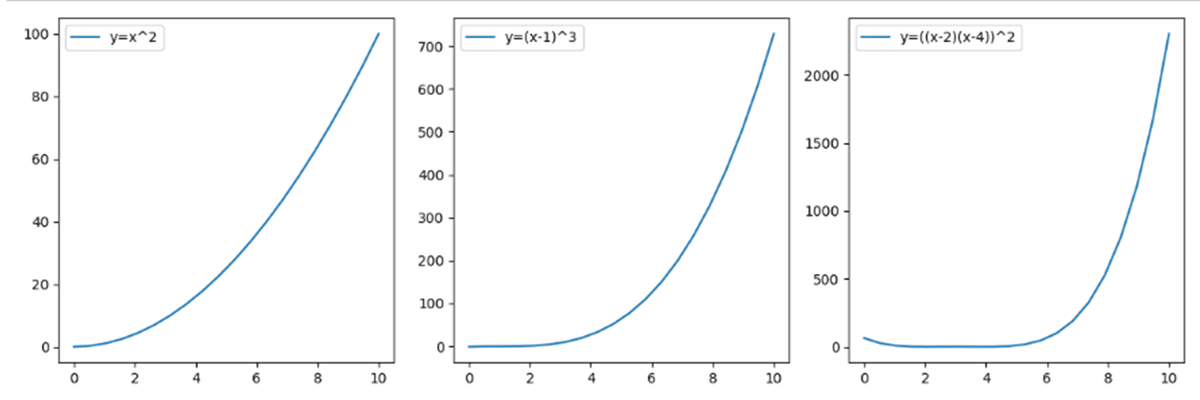
【グラフの種類】
●plot関数
第一引数でx軸、第二引数でy軸の値を指定する。
デフォルトは各点が線でつながっているが、第三引数の値を変更することでいろいろなスタイルのグラフにできる。公式リファレンス
例)
“o” – 点
“^” – 三角の点
“s” – 四角の点
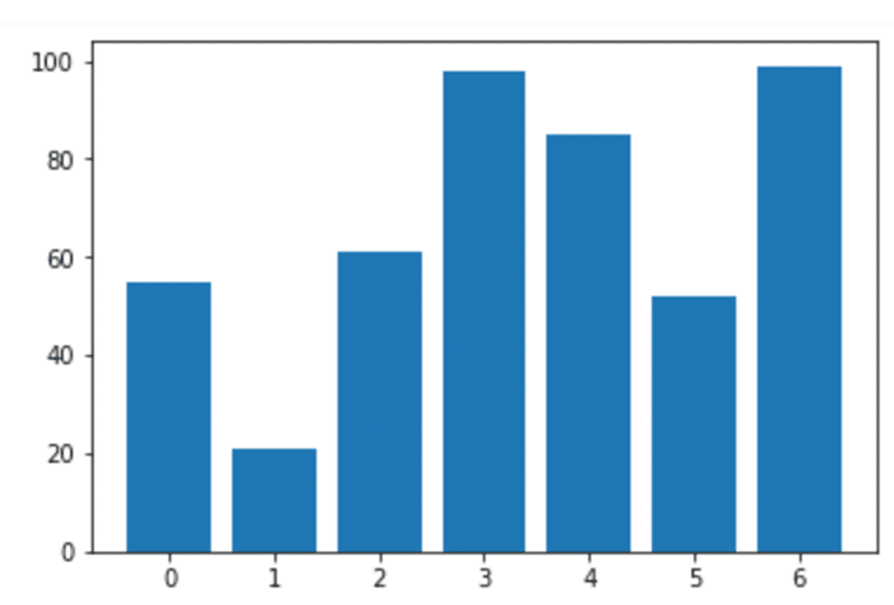
●棒グラフ
plt.bar( )
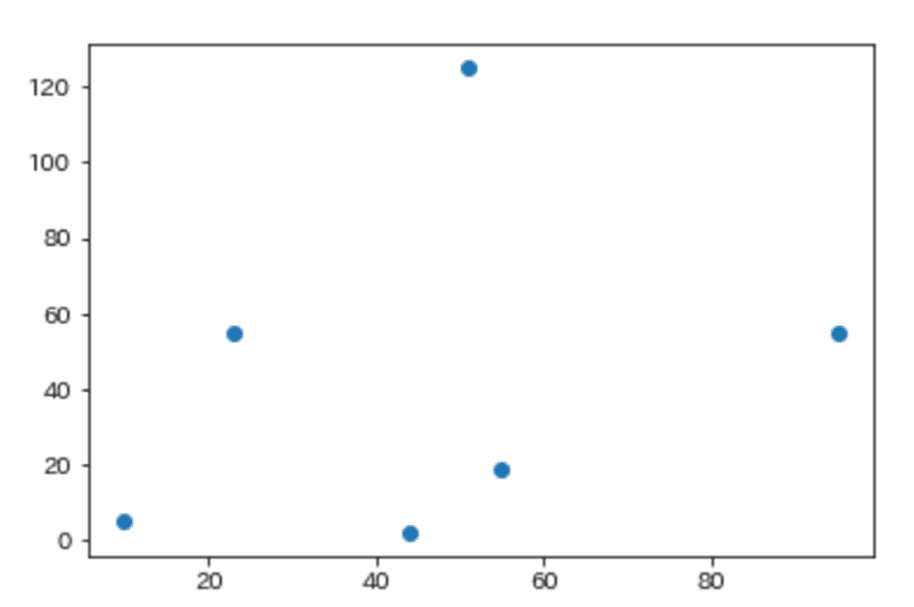
●散布図
plt.scatter( )
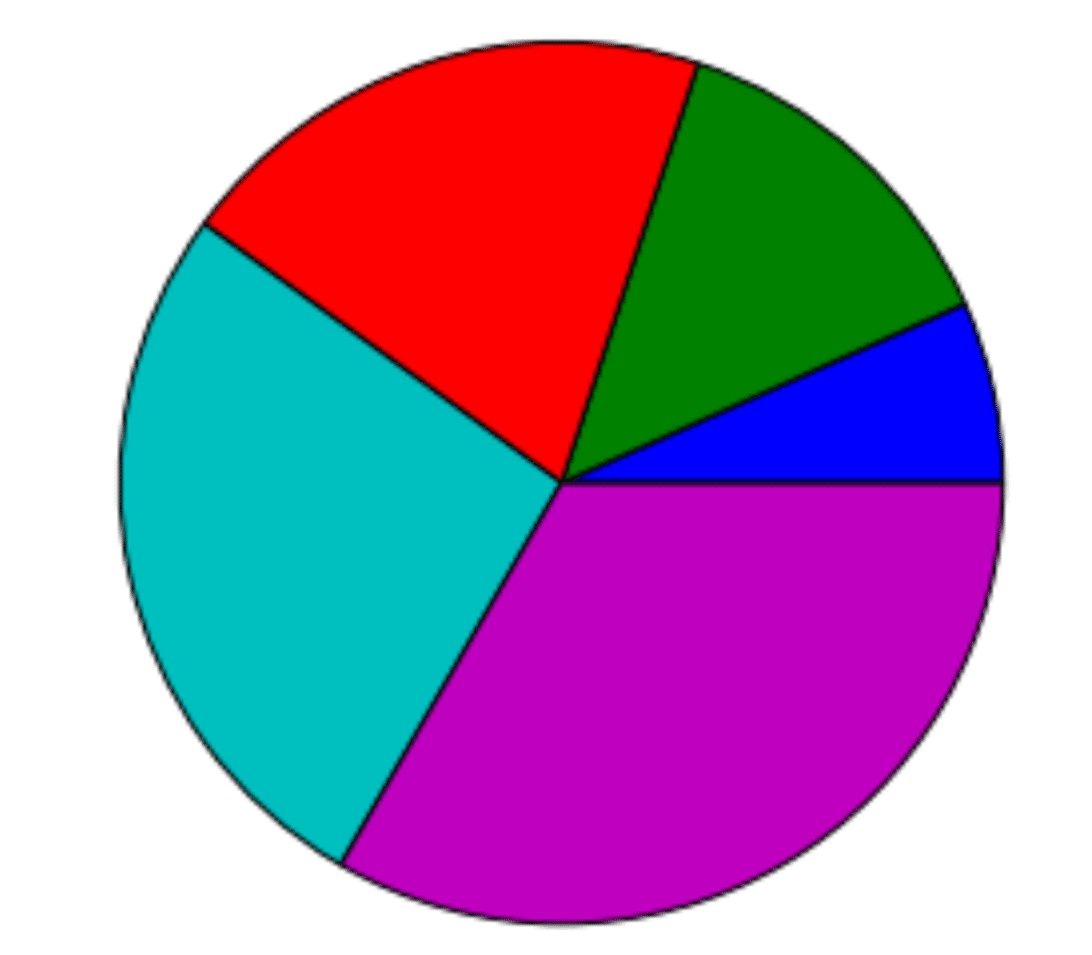
●円グラフ
plt.pie( )
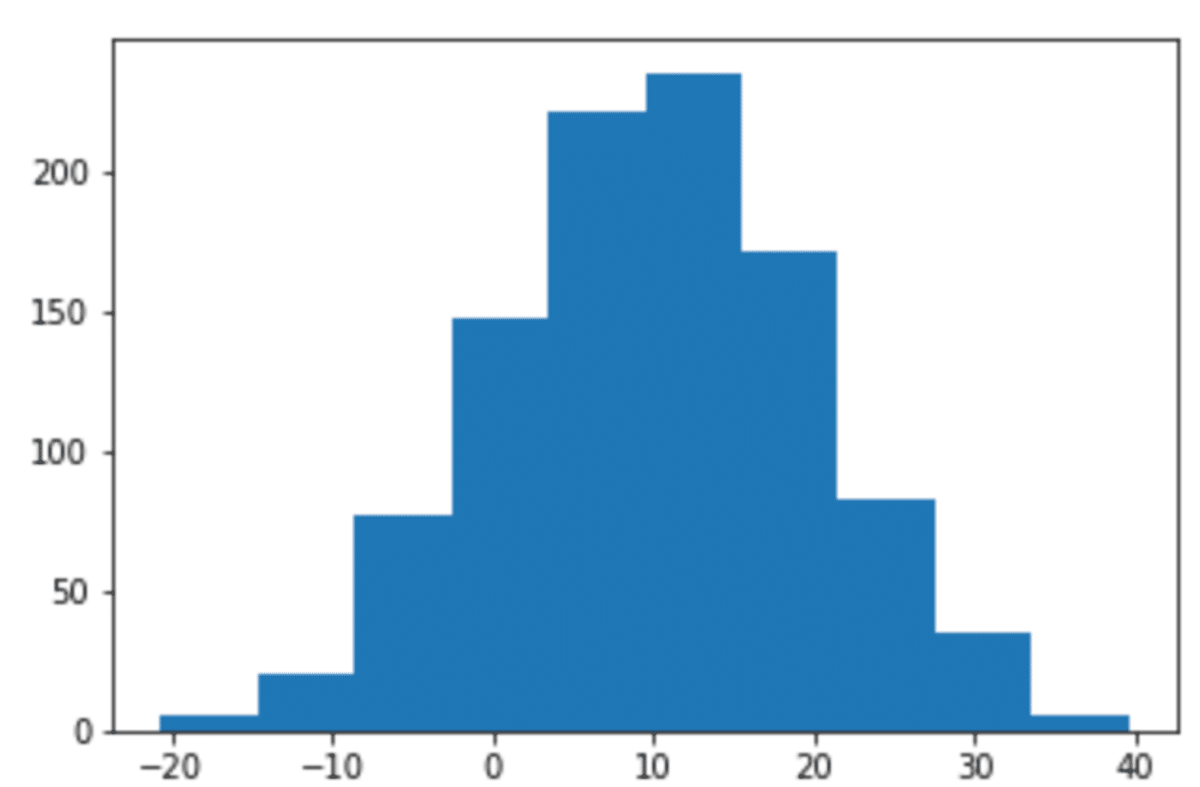
●ヒストグラム
plt.hist( )
●箱ひげ図
plt.boxplot()
Seaborn

●Pythonのためのグラフ描画ライブラリ
●Matplotlibをベース委した高レベルの視覚化ライブラリ
【使い方】
1. ライブラリ(seaborn、matplotlib.pyplot)のインポート
※描画領域の作成などで matplotlib を使用
2. plot関数を使いプロットする
3. plt.showでプロットしたグラフを描画する
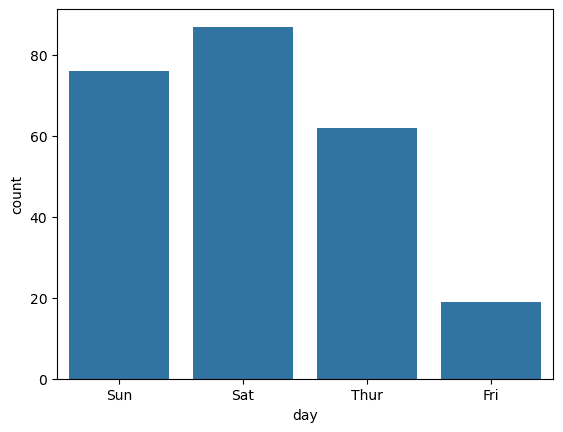
●棒グラフ sns.countplot( )
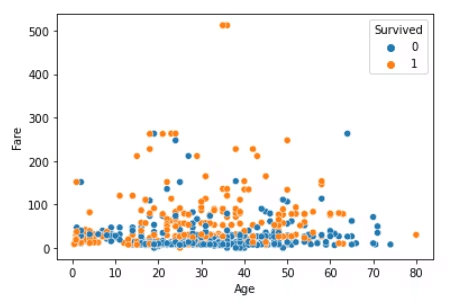
●散布図 sns.scatterplot( )
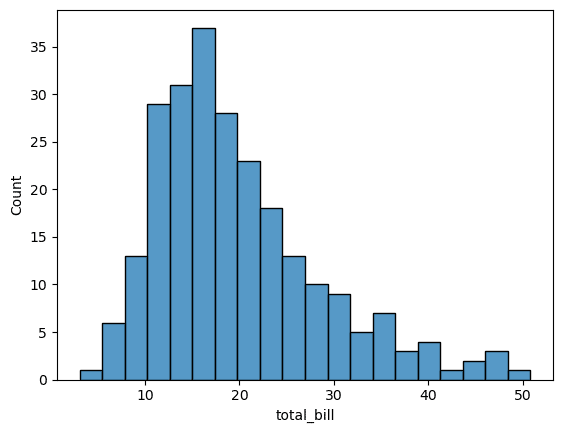
●ヒストグラム sns.histplot( )
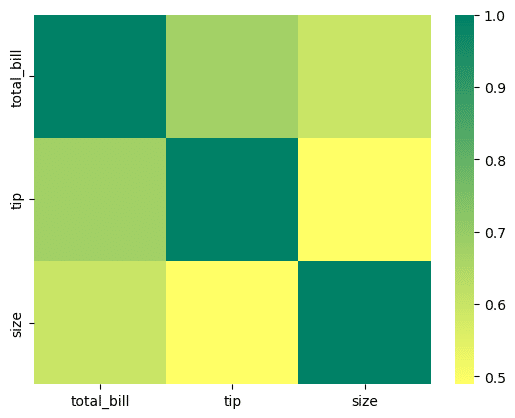
●ヒートマップ sns.heatmap( )
