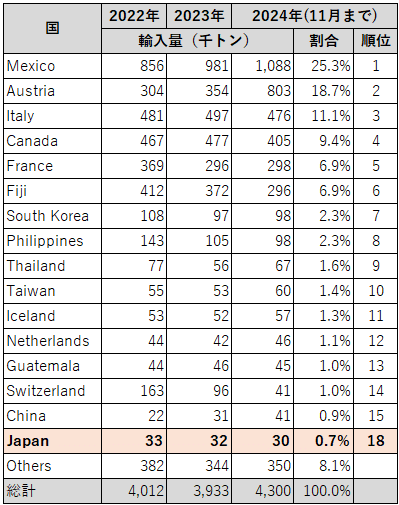
アメリカの【水】輸入状況
2024年(11月まで)のアメリカの水輸入量は(HSコード:2201、2202)、4,300千トンで、メキシコからの輸入が1,088千トン(25%)で一番多く、次にオーストリアからの803千トン(19%)、そして、イタリアからの476千トン(11%)と続く。
日本からの輸入は、30千トン(1%)で18位となっている。


過去10年間の日本からの輸入は、2014年から2022年までは年々増加していたが、2022年以降は横ばい傾向。2014年から2024年(11月まで)の間では、2022年の32.6千トンが最高量。


【注記】
データの引用元は、ITC (U.S. International Trade Commission)。
輸出額は、ITC データベースの輸出合計 (Exports: Total)。
輸入額は、後日、関税率などを算定すること等もあり、一般輸入額 (Imports: General)ではなく、消費用輸入額 (Imports: Consumption)の関税評価額(Customs Value)を引用している。
